
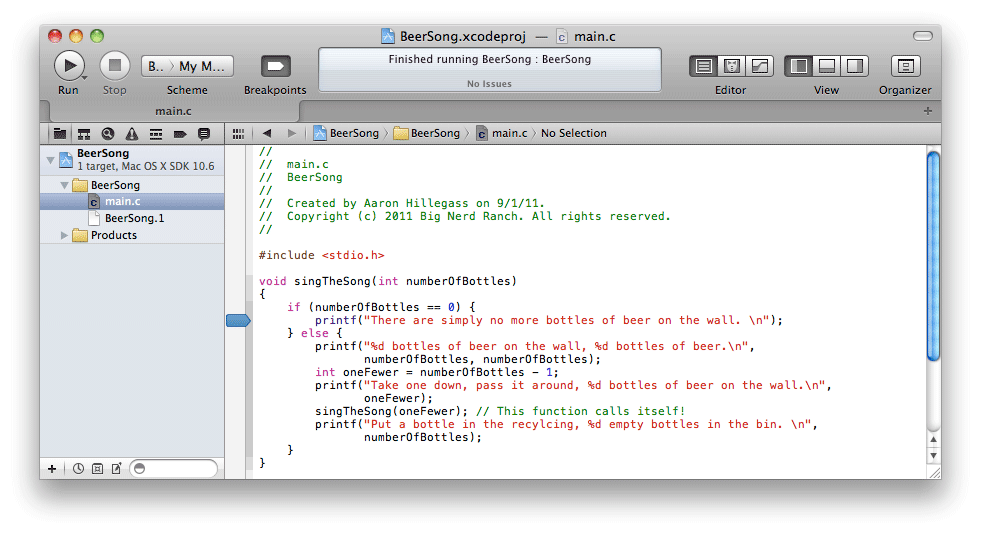
You can use the debugger to browse the frames on the stack. To do this, however, you have to stop your program in mid-execution. Otherwise, main() will finish executing, and there won’t be any frames left to look at. To see as many frames as possible in our BeerSong program, we want to halt execution on the line that prints “There are simply no more bottles of beer on the wall.”
How do we do this? In main.c, find the line
printf("There are simply no more bottles of beer on the wall.n");
There are two shaded columns to the left of your code. Click on the wider, lefthand column next to this line of code.
The blue indicator shows that you’ve set a breakpoint. A breakpoint is a location in code where you want the debugger to pause the execution of your program. Run the program again. It will start and then stop right before it executes the line where you set the breakpoint.
Now your program is
temporarily frozen in time, and you can examine it more closely. In the
navigator area, click the ![]() icon to open the debug
navigator. This navigator shows all the frames currently on the stack, also
called a stack trace.
icon to open the debug
navigator. This navigator shows all the frames currently on the stack, also
called a stack trace.
In the stack trace, frames are identified by the name of their function. Given your program consists almost entirely of a recursive function, these frames have the same name and you must distinguish them by the value of oneFewer that gets passed to them. At the bottom of the stack, you will, of course, find the frame for main().
You can select a frame to see the variables in that frame and the source code for the line of code that is currently being executed. Select the frame for the first time singTheSong is called.

You can see this frame’s variables and their values on the bottom left
of the window. To the right, you can also see the output in an area called the console.
(If you don’t see the console, find the ![]() buttons at the right of the screen towards the bottom half.
Click the middle button to reveal the console.)
In the console, you can see the effect of your breakpoint: the
program stopped before reaching the line that ends the song.
buttons at the right of the screen towards the bottom half.
Click the middle button to reveal the console.)
In the console, you can see the effect of your breakpoint: the
program stopped before reaching the line that ends the song.
Now we need to remove the breakpoint so that the program will run
normally. You can simply drag the blue indicator off the gutter. Or click
the ![]() icon at the top of the navigator area to reveal
the breakpoint navigator and see all the breakpoints in a project. From
there, you can select your breakpoint and delete it.
icon at the top of the navigator area to reveal
the breakpoint navigator and see all the breakpoints in a project. From
there, you can select your breakpoint and delete it.
To resume execution of your program, click the ![]() button on the debugger bar between the editor and the variables view.
button on the debugger bar between the editor and the variables view.
We just took a quick look at the debugger here to demonstrate how frames work. However, using the debugger to set breakpoints and browse the frames in a program’s stack will be helpful when your program is not doing what you expect and you need to look at what is really happening.