CHAPTER 8
External Loss Data
In this chapter, we consider the use of external loss data in the operational risk framework. In addition to the events that have occurred within a firm, the operational risk department will look at those that have occurred outside the firm. These events can offer valuable insight into the operational risks faced at the firm, and may also provide input into any operational risk capital calculation. External data is also a required element in an Advanced Measurement Approach (AMA) capital calculation and in the new Standardized Approach. The use of external data in capital calculations is considered further in Chapter 12.
EXTERNAL OPERATIONAL RISK EVENT DATA
External events are useful in many areas of the firm's operational risk framework. They can help inform the risk and control self-assessment activities, they can provide sample input for scenario analysis, and they might be used to develop key risk indicators that monitor the changing business environment.
The role of external data in the operational risk framework is illustrated in Figure 8.1.
External events are often of real interest to senior management, as major news headlines are often associated with operational risk. External data is therefore a key element in the development of a strong operational risk culture and a firm-wide awareness of the importance of effective operational risk management. When events occur in the industry among peers and competitors, it helps to underscore the importance of effective operational risk management and mitigation.
An example of an operational risk event that had a huge impact on the discipline was the $7 billion unauthorized trading scandal at Société Générale in 2006, which is discussed later in this chapter. This was an internal loss data event for Société Générale, but for the rest of the industry it was a very large external event that underscored the size of losses that can be experienced as a result of operational risk. This event is often considered a watershed moment in the development of the operational risk discipline.

FIGURE 8.1 The Role of External Loss Data in the Operational Risk Framework
Despite the lessons learned from that event, the industry saw another huge unauthorized trading event at UBS in 2011. This led financial firms to revisit what they had learned from Société Générale just five years earlier and to reassess the way that they respond to large external events to ensure that the lessons have truly been learned. It took large events for the financial services sector to embrace the necessary controls to prevent large unauthorized trading losses. The UBS event is discussed in more depth in Chapter 18.
Chapter 18 considers several more recent operational risk case studies. Each of those cases offer important external data points for the firms that were not involved (and painful internal loss data points for those that were).
SOURCES OF EXTERNAL LOSS EVENT DATA
There are many good online sources of operational risk event data in the form of news articles, journals, and e-mail update services. Some operational risk system vendors also have external databases that they make available on a subscription basis. For example, SAS offers an external database to its technology users, and IBM offers a subscription service called IBM FIRST Risk Case Studies®.1 There are also member consortiums of operational risk losses such as The Operational Riskdata eXchange Association (ORX), which is discussed further in the next section.
External events are a valuable source of operational risk information on an individual event basis and also as a benchmarking tool. Comparing internal loss patterns to external loss patterns can provide insight into whether the losses in a firm reflect the usual losses in their industry.
Subscription Databases
These databases include descriptions and analyses of operational risk events that are gleaned from legal and regulatory sources and from news articles. They provide helpful data to assist with mapping the events to the appropriate business lines, risk categories, and causes. The mission of these external databases is to collect tail losses and so to provide examples of potential large exposures.
The data also provide insight into the types of events that have occurred in the industry, but that a firm may not yet have experienced itself.
Consortium Data
In addition to subscription-based external data services, there are consortium-based operational risk event services that provide central data repositories and benchmarking services to their members. ORX provides such a service to its 81 members.
ORX gathers operational risk event data from its banking members and produces benchmarking information. It applies quality assurance standards around the receipt and delivery of data to promote members' anonymity and to provide consistency in definitions.
Unlike news-based subscription services, ORX data does not suffer from the availability bias that skews subscription data, which relies on public sources of data. In contrast, all operational risk events that occur in the member institutions are provided anonymously into the database.
However, the ORX data relate only to a subset of financial services, those member banks that provide data to ORX.
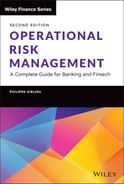
ORX publishes reports that summarize the data. Table 8.1 is derived from ORX data and illustrates the number of losses and the amount of losses in euros for each business line and each risk category for the period of 2015–2020.
TABLE 8.1 Number and Amount of Losses (in Euros) by Business Line and Risk Category between 2015 and 2020
|
ORX uses slightly different business lines than the Basel business line categories, as they split out Retail Banking into two groups: Retail Banking and Private Banking. They also rename Payment and Settlement as Clearing and capture Corporate Items in a separate category. Also, instead of Damage to Physical Assets (DPA) and Business Disruptions and System Failure (BDSF) risk types, they use Disasters and Public Safety (DPS) and Technology and Infrastructure Failure (TIF) when categorizing losses.
To date, ORX has gathered more than 800,000 events that have cost their consortium members over €500 billion. The cost of operational risk is abundantly clear. This table shows that ORX business line data is dominated by Retail Banking events, both in size of losses and frequency of events.
To further understand the relative impact to the different businesses and from the different risk categories, it is helpful to take another look at this data in percentage format, as shown in Table 8.2.
From Table 8.2 we can see that over 61 percent of the total number of events is generated in the Retail Banking business area and most of those are in the External Fraud category.
Retail Banking also has a large share of the total costs of events, with over 36 percent of the total losses. Trading and Sales has more than 24 percent of losses, and Commercial Banking and Corporate Items follow, with about 14 percent and 13 percent, respectively.
It is clear that External Fraud and Execution, Delivery, and Process Management produce the greatest number of events, between them accounting for more than 60 percent of the number of events and 40 percent of the total costs.
Clients, Products, and Business Practices accounts for a little under 21 percent of the events but carries more than 45 percent of the total loss amount. This demonstrates that for the member banks of ORX, Clients, Products, and Business Practices events tend to be larger events. It is for this reason that many firms carefully investigate this category in scenario analysis to attempt to identify potential “fat-tail” events—that is, events that are infrequent but very large.
The data can also be used to visually represent the relative levels of operational risk in each business line, as shown in Figure 8.2.
Figure 8.2 clearly illustrates the relatively high levels of operational risk that exist today in the Retail Banking sector.
CHALLENGES OF EXTERNAL DATA
Many operational risk functions use ORX or IBM FIRST or other provider data and then supplement these data with their own research by subscribing to online news feeds and relevant industry journals.
However, these data must be used with caution. There are several challenges with external data.
First, if the external data are gathered from news sources, then they are subject to a bias in reporting. Only events that are interesting to the press are reported in the press, resulting in a bias in favor of illegal and dramatic events over errors. For example, a large fraud will receive intensive coverage, while a major systems outage might not make it into any press report. It is also unlikely that a major gain will make the press in the same way that a major loss would, although the same lessons could be learned in both cases.
TABLE 8.2 The Percentage Contribution to Number of Events and Amount of Losses by Business Line and Risk Category between 2015 and 2020

|

FIGURE 8.2 Dollar Value Losses between 2015 and 2020, by Risk Category for All Business Lines
Second, it can be difficult to determine whether an event is relevant. The fact that a firm has the same business line does not mean it could have the same event occur, as it may have a different product or a stronger (or weaker) control environment. Indeed, many external events might be ignored simply because they “could not happen here” for one or many reasons. The best use of external data is not to use it to try to spot an exact event that should be avoided, but rather to determine the types of errors and control failings that can occur so as to avoid similar (rather than identical) losses.
An external event may have direct relevance regardless of the exact details. For example, the Société Générale event (which is considered in detail later) led to many firms overhauling their fraud controls, regardless of whether they had any traders working on the exact same desks as Société Générale's Jérôme Kerviel.
Third, the use of benchmarked data relies on the quality of the underlying data, and there may be a chance that the comparisons made are not accurate due to a different interpretation of the underlying definitions.
However, if all of these challenges are acknowledged, then external data have a very valuable role to play in operational risk management. They provide insight into lessons that can be learned prior to an event occurring at the firm. They demonstrate that the size of an event may be beyond the initial estimation made by the firm. They provide context and highlight trends in the industry.
Internal and external operational risk events provide a rich source of data on what has already gone wrong. It is possible to use these data to implement mitigating controls to prevent future repetitions of the same events. Moreover, operational risk event data provide a valuable input into the other elements of the operational risk framework that will be designed to predict potential events that have not yet occurred.
Loss data provide useful examples for risk and control self-assessment and scenario analysis discussions and analysis, as well as key risk indicators (KRIs) that can indicate trends of losses and control weaknesses.
Société Générale and the External Event That Shook the Operational Risk World
This event was originally reported in IBM FIRST Risk Case Studies as follows:
In what the Wall Street Journal (1/24/2008) called a “singular feat in the world of finance” Societe Generale announced a €4.9 billion (USD $7.2 billion) loss on January 24, 2008, arising from the misdeeds of a single rogue trader. The bank characterized the largest rogue trading event to date as involving “elaborate fictitious transactions” that allowed Jerome Kerviel to circumvent its internal controls. The trades involved the arbitrage of “plain vanilla” stock-index futures. Mr. Kerviel had previously worked in a back office function and learned how to circumvent the bank's systems. Although he was initially characterized by the governor of the Bank of France as a “computer genius” later he was described as an unexceptional employee who worked very hard to conceal unauthorized trading positions, which SocGen estimated to have a value of €50 billion ($73.26 billion). The French Finance Ministry said that Kerviel's rogue trading started in 2005; he was allegedly given a warning at the time concerning trading above prescribed limits. In addition to the €4.9 billion trading loss, the French Banking Commission levied a €4 million fine against Societe Generale on July 4, 2008, bringing the total loss amount to €4,904,000,000. On October 5, 2010, a court in Paris sentenced Mr. Kerviel to three years' imprisonment, plus a two year suspended sentence and ordered him to repay €4.9 billion ($6.7 billion) to his employer.2
On October 24, 2012, a French appeals court upheld Kerviel's fraud conviction and lifetime trading ban.
This external event galvanized the operational risk world, as it clearly demonstrated the dangers that exist in unmitigated operational risk. In 2008, many firms were still engaged in developing their early operational risk frameworks and were often focused on first-run delivery of new reporting, new loss data tools, and new adaptations to their RCSA and scenario analysis programs. The regulatory requirements were paramount in many programs, with the business benefits being developed as rapidly as possible, but sometimes lagging behind the urgent regulatory pressures.
However, when the news hit of Kerviel's audacious activities and their multibillion-dollar impact on his firm, many heads of operational risk found themselves in front of their executive management being asked the urgent question: “Could that happen here?”
This was a classic large operational risk event in that it resulted from numerous control failings. Kerviel's job was to make arbitrage trades that would result in small gains, but he began taking unauthorized “directional” positions starting in 2005, and these grew in size until he was discovered in January 2008.
Reports on the events suggest that Kerviel may have been more motivated by a sense of pride than an attempt to defraud the firm. His unauthorized activities did not result in secret transfers into his bank account; they resulted in huge positions at the bank.
At one point, Kerviel's activities allegedly resulted in gains for the firm that have been estimated to have been as high as €1 billion in 2007. It has been suggested that he realized that these gains were too large to explain, and so he pursued a strategy to reduce them. That strategy, it is alleged, resulted in losses of €1.5 billion by February 2008. The adverse market conditions that existed when Société Générale discovered the unauthorized trading and unwound the positions resulted in the loss growing to €4.9 billion.
This is an extreme example of how an operational risk event can be exacerbated by a market risk event.
IBM FIRST Risk Case Studies provides an in-depth prose analysis of the event based on extensive press reviews. The highlights of the many contributing factors that are alleged can be summarized as follows:
- Kerviel engaged in extensive unauthorized activities in order to demonstrate his prowess as a trader rather than to defraud the bank.
- He was insufficiently supervised and at times had no supervisor at all.
- He had worked in the middle and back offices prior to becoming a trader and used his knowledge of those controls to ensure that his activities were not detected.
- He gained password access to back office systems that allowed him to manipulate data and approve his own trades.
It is alleged that many red flags were raised but were ignored or were dismissed as unimportant.
The head of the Bank of France, Christian Noyer, said that Mr. Kerviel managed to breach “five levels of controls.” The controls were identified in the earlier Mission Green report3 and included cancelled or modified transactions; transactions with deferred dates; technical (internal) counterparties; nominal (non-netted exposures) and intra-month cash flows. In addition, the second and more detailed Mission Green report4 identified a host of supervisory lapses, organizational gaps, and warning signs that were never heeded.5
It is alleged that there were numerous other red flags that were not heeded including:
- Kerviel requested an unusually high bonus due to his above-market returns.
- He frequently breached limits, and despite being reprimanded for this in the past, was able to continue to do so.
- Concerns were raised by EUREX regarding his trading volume but were dropped after a response from Kerviel satisfied their concerns.
- At least 75 compliance alerts were raised but were dismissed when Kerviel supplied minimal, and sometimes forged, documentation to explain his unusual activity.
- Kerviel never took his vacation time, allowing him to be on-site to continue to maintain and conceal his unauthorized activities.
- The bank had to rely on manual processing due to inadequate technology to support the increasing volumes in the market.
- Net cash flows were monitored, whereas monitoring of nominal flows might have revealed the unauthorized activity.
IBM FIRST Risk Case Studies categorized this event, as shown in Table 8.3.
TABLE 8.3 Classification in IBM FIRST Risk Case Studies
| Entity Type | Financial Services/Banking/Commercial/Full-Service Bank |
|---|---|
| Business Unit Type | Trading and Sales (BIS)/Trading |
| Service/Product Offering Type | Derivatives, structured products, and commodities/derivative products/futures and options/equity index futures |
| Contributory/Control Factors | Corporate Governance/General Corporate Governance Issues, Corporate/Market Conditions/Corporate and Market Conditions, Employee Action/Inaction/Employee Misdeeds, Employee Action/Inaction/Employee Omissions, Lack of Control/Failure to Question Above-Market Returns, Lack of Control/Failure to Reconcile Daily Cash Flows, Lack of Control/Failure to Test for Data Accuracy, Lack of Control/Lack of Internal Controls, Lack of Control/Lax Security, Lack of Control/Rules, Regulations, and Compliance Issues, Management Action/Inaction/Lack Management Escalation Process, Management Action/Inaction/Undertook Excessive Risks, Omissions/Failure to Set or Enforce Proper Limits, Omissions/Failure to Supervise Employees, Omissions/Inadequate Due Diligence Efforts, Omissions/Omissions and Lapses, Organizational Structure/Inadequate Organizational Structures, Organizational Structure/Organizational Gap(s), Strategy Flaw/Inadequate Technology Planning Process, Organizational Structure/Organizational Structure—General, Lack of Control/Lack of Internal Controls—General, Management Action/Inaction/Undertook Excessive Risks, Omissions/Omissions—General |
| Loss Impact | Direct Loss/Regulatory/Compliance/Taxation Penalty (BIS)/Fines/Penalties, Direct Loss/Write-Down (BIS)/Write-Downs, Indirect Loss/Management Remediation, Indirect Loss/Ratings Agency Downgrade/Ratings Watch, Indirect Loss/Related Market Risk Losses, Indirect Loss/Reputational (Nonmonetary), Indirect Loss/Share Price |
| Loss Detection Sources | Whistle Blowing/Employee Originated |
| Market Focus | Institutional Services |
| Event Trigger | People Risk Class/Trading Misdeeds/Unauthorized Trading/Activity above Limits/Unauthorized Trading—Proprietary Accounts |
| Basel Levels I and II | Internal Fraud/Unauthorized Activity/Trans type unauthorized (w/monetary loss) |
| Basel Business Line | Investment Banking/Trading and Sales/Proprietary Positions |
| Entity Type | Financial Services/Banking/Commercial/Full-Service Bank |
| Business Unit Type | Trading and Sales (BIS)/Trading |
ORX also provides a news service, and they categorized this event as shown in Figure 8.3.
The industry responded to this event with energy. Operational risk teams met with senior management, as executive teams and boards asked whether such an event could happen at their firm. Perhaps for the first time, the possible size of an operational risk event was fully appreciated, and the operational risk function had an opportunity to demonstrate its relevance and importance.

FIGURE 8.3 ORX Classification of the Société Générale Event
Fraud risk assessments were conducted in many firms, and numerous control improvements were implemented. Mandatory vacation policies were written and enforced. Passwords were disabled for employees who had moved to new roles. Supervisory oversight was reviewed.
Industry forums were held as operational risk managers compared notes on how best to minimize the risk that such an event could happen in the industry again. As an external data point, the event galvanized many aspects of operational risk frameworks across the industry and also paved the way for how to respond to future serious events.
Work plans were drawn up to evaluate the current state of the controls that had failed at Société Générale and to kick off work to remediate any control gaps that might be uncovered. RCSAs and scenario analysis were updated in the unauthorized trading aspects of internal fraud. Working groups were formed, board packs prepared, and external event tracking was enhanced. As IBM FIRST Risk Cases notes in its longer description of the event:
The AFP press agency reported (October 8, 2010) that Société Générale's own efforts to enhance its internal controls in the wake of the event were estimated to have cost the bank at least 150 million euros over a three-year period.
The Société Générale event shocked the financial services industry, and turned the spotlight on to operational risk. However, only three years later another startlingly similar event occurred at UBS, and since the financial crisis, we have seen several very large events occur; these incidents are discussed in the case studies in Chapter 18.
KEY POINTS
- Loss events that have occurred outside the firm can provide valuable insight into potential catastrophic events, as well as opportunities to benchmark internal data against the industry.
- Subscription databases use legal, regulatory, and press reports of events to provide analysis and categorization of operational risk events.
- Consortium databases collect data from members and share trends and benchmarking information with members.
- The methods of collection can produce biases in data that must be considered when analyzing external sources of data.
REVIEW QUESTION
- Which of the following statements best describes the value of using external database sources?
- Consortium data provide a full data set for a bank to use for benchmarking.
- Subscription data sources provide a full data set for a bank to use for benchmarking.
- A combination of subscription and consortium data provides a full data set for a bank to use for benchmarking.
- Consortium and subscription data provide helpful information on external loss data trends that can help inform a bank's operational risk framework.
NOTES
- 1 IBM FIRST Risk Case Studies. Property of IBM. 5725-H59 © Copyright IBM Corp. and others 1992, 2021, IBM, the IBM logo, ibm.com.
- 2 Excerpted and reproduced with permission of IBM FIRST Risk Case Studies (see note 1).
- 3 Investigatory report published on February 20, 2008, by Société Générale.
- 4 Investigatory report published in May 2008 by Société Générale.
- 5 IBM FIRST Risk Case Report.