
CHAPTER
7
Measuring and Optimizing Your Pipeline
Prospecting is not a set-it-and-forget-it process. Sales teams must vigilantly measure and optimize their pipeline to achieve the maximum return on sales investment. Over the course of this chapter, we will review the critical metrics that serve as leading and lagging indicators of success at each stage of the sales journey.
Lean Optimization
Since optimization applies to all metrics, we need to spend a little bit of time discussing two extremely popular and closely related techniques. The first, Lean Six Sigma, combines the efficiency principles of the lean movement that started in manufacturing and has since moved on to innovation and other business processes with the quality principles of six sigma. The second, Design Thinking, complements Lean Six Sigma by adding user centeredness and fast iteration. The steps in the two frameworks are shown in Figures 7-1 and 7-2.
FIGURE 7-1 Lean Six Sigma Framework
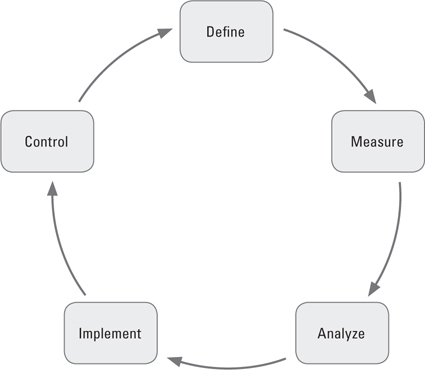
FIGURE 7-2 Design Thinking Framework
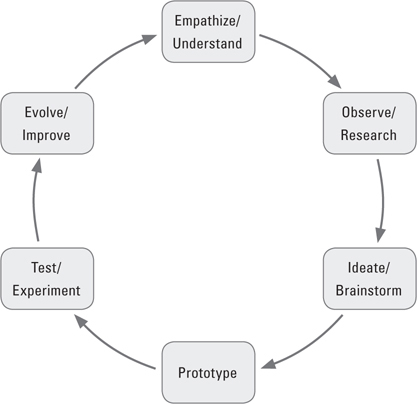
The Define step in Lean Six Sigma corresponds to the Empathize/Understand step in Design Thinking. In the context of Predictable Prospecting, Define means to articulate the part of the pipeline that needs to be optimized. Typical problems come from contacts getting stuck in a particular stage or wasting time by moving bad contacts to the next stage. Design Thinking asks sales managers and sales operations experts to empathize by taking a step back and putting themselves in the shoes of individual salespeople.
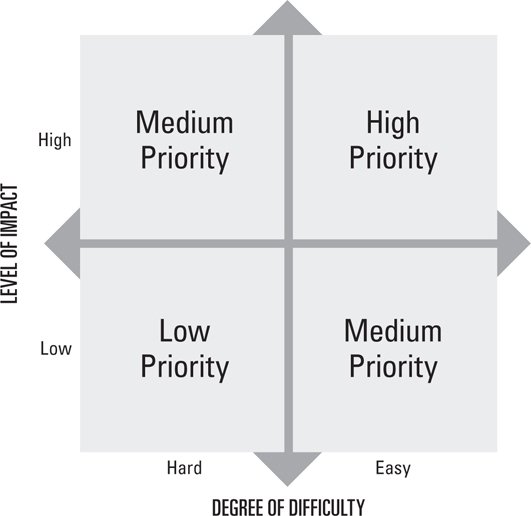
The Measure and Analyze steps in Lean Six Sigma link directly to the Observe/Research and Ideate/Brainstorm steps in Design Thinking. In both frameworks, the two steps are a combination of establishing starting point benchmarks for key performance indicators (KPIs), developing hypotheses regarding the root causes of problems, and formulating viable and creative solutions. In any process, including Predictable Prospecting, these steps will reveal many opportunities. Hence, it is critical to spend time prioritizing the issues and opportunities based on business impact and degree of difficulty (see Figure 7-3). This issue prioritization classifies easy, high-impact issues as high; easy, low-impact and hard, high-impact issues as medium; and hard, low-impact issues as low.
FIGURE 7-3 Issue Prioritization Matrix
The Implement step in Lean Six Sigma corresponds to two Design Thinking steps: Prototype and Test/Experiment. Here, one or more test solutions are designed and piloted.
Finally, the Control step in Lean Six Sigma links to the Evolve/Improve step in Design Thinking. Assuming the results for the pilot were positive, the solution is scaled and the improvement cycle begins again.
The New Queue
Leads enter the New Queue from either inbound or outbound sources. Since some sources will turn out to be better than others, new leads should be tagged with a Lead Source attribute. Our rough ranking from highest to lowest quality of sources is as follows:
1. Inbound: Become a client
2. Outbound: Reactivation (of former clients)
3. Outbound: Referral
5. Outbound: Targeted lists assembled in-house
6. Inbound: White paper or e-book download
7. Outbound: Trade show lists
8. Outbound: Targeted lists sourced from third parties
Consider including a graph for volume by lead source. Sales leaders should monitor this graph to assess lead generation relative to targets or to inspect any service-level agreements established in partnership with their marketing department or agencies.
Note: For the inbound sources above, we have not distinguished how the leads were pulled in. For digital inbound leads, the main channels are direct, organic, or paid. Direct leads, where individuals enter a vendor’s URL directly into their browser, are usually the best of the three. The other two are nearly of the same quality. Organic leads occur when an individual conducts a search and clicks on an unpaid link to a vendor’s website. Investments in search engine optimization (SEO) increase the volume of organic leads by helping a company rank higher on the search engine results page (SERP). Paid leads occur when an individual clicks on an ad in a search engine, banner ad network, or social media property. In addition to these pay-per-click (PPC) leads, vendors can also pay third-party content publishers who host content on a per-lead basis.
When developing metrics for the New Queue, as well as other queues, we consider both intra-stage and inter-stage measures. Generally speaking, intra- (or within) stage measures include volume and cycle time. Inter- (or between) stage measures explore pipeline advancement or dropout and are usually expressed as percentages or ratios.
In the charts that follow, we include six months of data for simplicity, but sales teams should choose the frequency that best suits their business. When possible, add one extra period to help identify deviations from normal seasonality—for example, five quarters of quarterly data or 13 months of monthly data.
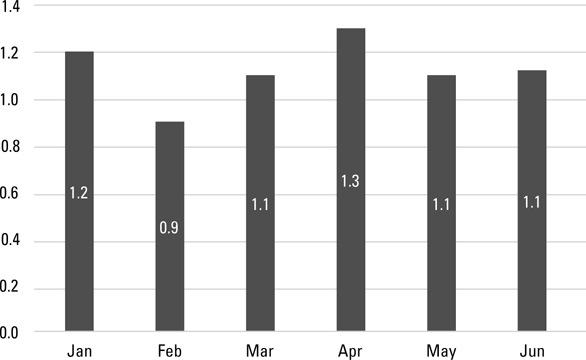
As illustrated in Figure 7-4, the first New Queue measure to examine is the number of New Queue leads engaged (that is, those contacted for the first time). In this chart, we include the ability to toggle between the total number of leads engaged and the average number of leads engaged per day over a specific date range. The total comes in handy because quotas are often set over longer time horizons, typically monthly or quarterly. The average number of New Queue leads engaged per day is instrumental for coaching. When computing the average per day, only count business days worked in the denominator; though not perfect, the simplest way to make this adjustment is to include only days when an SDR engaged at least one lead.
FIGURE 7-4 Average New Queue Leads Engaged per Day

Sales leaders should also examine the time it takes to engage New Queue leads as shown in Figure 7-5.
FIGURE 7-5 Average Time to Engage New Queue Leads by Type
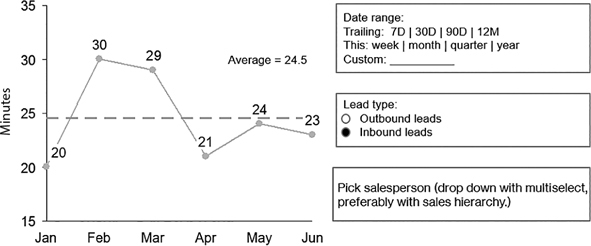
Since leads from different sources are not created equal, the dashboard must include the ability to toggle between different types of leads. SDRs should respond within minutes to prospects who call in or submit contact forms seeking to speak with a salesperson. Inbound leads from content marketing can be responded to in hours or days; it can be unsettling for a prospect to receive a phone call mere minutes after downloading a white paper. Generally, outbound leads should be handled within days of being sourced. Based on performance to preestablished response time targets, different actions may be required:
1. If New Queue cycle time is increasing, the first option is always to improve the efficiency and productivity through process optimization, training, new technology, or job specialization.
2. If the team is efficient and sales are lagging behind targets, then the next option is adding sales capacity.
3. If the team is hitting targets and does not wish to add capacity, then the marketing team can scale back lead generation either by engaging in less activity or, better yet, by improving lead quality by tightening up marketing-qualified lead (MQL) criteria.
Figure 7-6 shows New Queue lead disposition by type. Read this graph as follows: Of the new leads dispositioned in January, 80 percent were advanced to Working, a quality number that would probably be too low for most salespeople. Five percent were rejected for bad data, usually malformed contact information, obvious garbage (for example, Homer Simpson, Nuclear Safety Inspector, Springfield Nuclear Power Plant), or the contact was gone from the company. Seven percent were rejected for low quality, indicating either that the Ideal Prospect Profile needs to be updated or that leads are being put into the New Queue that do not adhere to the profile.
FIGURE 7-6 Dispositioned New Queue Leads by Action Type

Many sales organizations are starting to look closely at the number of leads per account, represented as an average over time, for at least two reasons. First, metrics from companies like the Corporate Executive Board show that an increasing number of individuals weigh in on B2B purchase decisions. Second, messaging multiple individuals at once in a personalized manner is a more strategic way to get around gatekeepers. If a salesperson does advance multiple contacts from the same company from the New Queue to the Working Queue, we recommend limiting the number to two or three at a time to avoid being flagged as a spammer. In addition, deliver a higher degree of personalization by referencing other people who were contacted.
Saving the best for last, we come to the most important New Queue metric. The ultimate measure of New Queue quality is whether or not new leads turn into paying customers, as illustrated in Figure 7-7. In the graph, 3.2 percent of new leads generated in January converted into paying customers. The downward ramp is as expected because leads need time to mature. Many companies add a maximum duration cutoff so that the percentages are locked down at some point in time. Again, as with all other metrics, all values should be compared against targets.
FIGURE 7-7 New-Queue-to-Client Win Rate

The Working Queue
The most important Working Queue graph is the average number of appointments set per day per sales representative (see Figure 7-8). This graph is a fairly accurate representation of reality: most average outbound SDRs produce one appointment set per day while great ones can produce two or more. We also believe it is critical to track the appointment-set-to-appointment-held rate. In many organizations, SDRs (assuming they do not conduct first meetings) should only get credit for appointments held. Hence, if the prospect no-shows, the SDR remains on the hook to reschedule the meeting. Leads are advanced to qualifying only after first meetings. Some SDRs will be better than others at ensuring prospects show up. Their best practices should be captured and shared.
FIGURE 7-8 Appointments Set per Day per SDR
Many activities drive the appointment set rate, beginning with touches per day (or touches per account per day). The two most common types of touches to track are e-mails and phone calls as illustrated in Figure 7-9. Additionally, some sales organizations track social media such as LinkedIn connects or Twitter direct message touches.
FIGURE 7-9 Average Total Working Queue Touches per Day

At a high level, one must understand how many touches in total are needed to secure an appointment; the most sophisticated sales teams optimize the touch cadence—the type, order, and frequency of touches. Additionally, sales leaders should track and optimize the meeting held rate (expressed as a percentage of the number of meetings set).
At the individual sales representative level, the most common e-mail metric tracked is the volume of e-mails sent per day per SDR. More is not necessarily better because 50 truly customized e-mails may very well lead to more appointments than 100 mass-personalized e-mails. In terms of e-mail outcomes, the positive e-mail reply rate, typically around 3 percent, is the most important. For SDRs, there are several technologies that provide real-time notification when links are clicked, which is a great trigger to call a prospect to offer assistance.
Sales leaders tasked with optimization should look regularly at which e-mail templates are working best. Since it is difficult if not impossible to attribute meetings to any given touch, e-mail template effectiveness is often assessed by looking at the open rate and click-to-open rate (CTOR), or the click-through rate (CTR). The open rate is defined as the number of e-mails opened divided by the number of delivered e-mails. The benchmark for average open rate is 21 percent,1 though open rates are becoming less and less reliable as e-mail clients do a better job of protecting user privacy. The click-to-open rate is defined as the number of unique clicks divided by the number of opens, and it averages 12.6 percent.2 The click-through rate is the product of these other two, and it averages a paltry 2.6 percent. It is also wise to monitor unsubscribe rates and spam complaint rates to ensure that e-mails are not damaging relationships or your company’s domain identity; benchmarks for these average 0.13 percent and 0.03 percent, respectively.
Next up are phone activity and outcome metrics. The most common are dials per day and talk time. We do not recommend setting either of these as primary objectives for SDRs (again, appointments are what matters). Setting a dials-per-day objective leads to reps feeling rushed to get off the phone. Setting a talk-time-per-day objective leads to reps leaving excessively long voice mails. We have even seen instances of reps calling weather services to hit these arbitrary numbers.
For phone activity, sales leaders often measure the dials-to-connect rate. When doing this, here are some benchmarks to consider:
![]() Dials to connect: It takes 12 direct-line dials to reach a prospect (8.3 percent connect rate).
Dials to connect: It takes 12 direct-line dials to reach a prospect (8.3 percent connect rate).
![]() Dials to conversation: It takes 90 dials on average to secure an appointment (30 dials per conversation and 3 conversations per appointment).
Dials to conversation: It takes 90 dials on average to secure an appointment (30 dials per conversation and 3 conversations per appointment).
![]() By dialing a direct line, reps are 46 percent more likely to reach a director and 147 percent more likely to reach a VP as compared to dialing through a switchboard. (Bonus tip: Be sure to ask the operator, “Can I have her number just in case we get disconnected?”)3
By dialing a direct line, reps are 46 percent more likely to reach a director and 147 percent more likely to reach a VP as compared to dialing through a switchboard. (Bonus tip: Be sure to ask the operator, “Can I have her number just in case we get disconnected?”)3
For outcome activity, we prefer “meaningful conversation” as a measurement. A meaningful conversation is any conversation that furthers a prospect into (or out of) the sales pipeline. Consider the following metaphor. Driving along the freeway, you have exits and mile markers. Meaningful conversations that result in an unsuitable or not-yet-ready prospect falling out of the pipeline are exits. In contrast, meaningful conversations through which you learn more about a prospect show advancement and are mile markers. Conversations resulting in neither an exit nor a mile marker are not meaningful. Even more so than e-mails, phone calls, and meetings, the number of meaningful conversations needed to progress from one stage to the next is a critical metric.
Finally, sales leaders may wish to examine Working Queue cycle time. We do not consider this a primary dashboard metric like New Queue cycle time because we have not seen huge variations in SDR performance provided that each member of the team is maintaining appropriate activity levels.
The Qualifying and Closing Queues
After the first appointment is set and held, leads move on to the Qualifying Queue. The primary metric to follow is Qualifying Queue lead disposition by type (advanced to closing versus disqualified; recall that we do not recommend adding reporting complexity by requiring reps to choose a more detailed reason code for not qualified). Like Working Queue cycle time, Qualifying Queue cycle time by disposition type is a secondary metric.
Assuming the first appointment ends with an affirmative answer to the are-we-a-fit question, contacts become associated with opportunities and move into the Closing Queue. Here, we focus on similar metrics: first, Closing Queue lead disposition by type (transacted won or transacted lost) and second, Closing Queue cycle time. In addition, most organizations track metrics for opportunities by stage and also report on the weighted (or factored) pipeline to get a sense of revenue potential.
Case Study: SalesLoft
After stints as a bartender for a theater in Georgia, a manager for a youth hostel in Costa Rica, and a recruiter for a staffing organization, Sean Kester joined SalesLoft as its first sales development representative (SDR). SalesLoft competes in the sales workflow automation space with Outreach.io, PersistIQ, ToutApp, and Velocify. Over the years, Sean had risen to become the head of product, and his responsibilities included managing SalesLoft’s entire SDR team. This meant he had to figuratively make and eat his own dog food. A self-described open book, Sean was kind enough to allow us to share a wealth of information. For starters, here is their first cold outreach e-mail template:
Next, here are SalesLoft’s key metrics:
![]() On average, SDRs handle 700 to 800 outbound leads per month, or 35 to 40 per business day.
On average, SDRs handle 700 to 800 outbound leads per month, or 35 to 40 per business day.
![]() 3.7 percent of net new outbound leads turn into a first (demo) meeting.
3.7 percent of net new outbound leads turn into a first (demo) meeting.
![]() On average, it takes six activities to secure a first meeting. Activities include e-mails, calls (with or without voice mail), LinkedIn views, Facebook likes, and Twitter follows.
On average, it takes six activities to secure a first meeting. Activities include e-mails, calls (with or without voice mail), LinkedIn views, Facebook likes, and Twitter follows.
![]() The average lead lifetime is 11.3 days, and 95 percent of outbound leads that convert do so in the first 30 days.
The average lead lifetime is 11.3 days, and 95 percent of outbound leads that convert do so in the first 30 days.
![]() 12.4 percent of inbound leads convert into a (demo) appointment.
12.4 percent of inbound leads convert into a (demo) appointment.
![]() 95 percent of SalesLoft’s pipeline is generated by SDRs.
95 percent of SalesLoft’s pipeline is generated by SDRs.
Finally, here are several additional SalesLoft best practices:
![]() On the first day, SDRs first view the prospect’s LinkedIn profile, and then they send an e-mail, and then call, leaving a voice mail if they do not connect.
On the first day, SDRs first view the prospect’s LinkedIn profile, and then they send an e-mail, and then call, leaving a voice mail if they do not connect.
![]() SDRs send personalized LinkedIn connections only after their first conversation with a prospect. (Do not merely send connections with LinkedIn’s standard language that reads, “I’d like to add you to my professional network on LinkedIn.”)
SDRs send personalized LinkedIn connections only after their first conversation with a prospect. (Do not merely send connections with LinkedIn’s standard language that reads, “I’d like to add you to my professional network on LinkedIn.”)
![]() SDRs spend less than 5 minutes personalizing the first and last line of each e-mail.
SDRs spend less than 5 minutes personalizing the first and last line of each e-mail.
![]() To save time, SDRs drop voice mails (when they choose to do so) by leveraging one of five prerecorded templates.
To save time, SDRs drop voice mails (when they choose to do so) by leveraging one of five prerecorded templates.
![]() SalesLoft has found that sending LinkedIn Inmails referencing prospecting e-mails is an effective complement or alternative to leaving voice mails.
SalesLoft has found that sending LinkedIn Inmails referencing prospecting e-mails is an effective complement or alternative to leaving voice mails.
![]()
We urge sales professionals and sales leaders to adopt a “peel-the-onion” approach to optimization so as not to get overwhelmed by the many metrics presented in this chapter.
Start with the most important metrics: total sales relative to target and appointments held per rep per day. Set the target so that somewhere between 60 and 80 percent of SDRs hit the quota.
Next look at the New-Queue-to-customer win rate and interrogate the inter-stage conversation rates to detect any problem areas.
Then, go deeper into intra-stage metrics as needed. Also, while transparency is valuable, exposing people to highly volatile data is counterproductive, so be thoughtful about who should see what metrics at what frequency.
Finally, the measurement and optimization process requires a delicate balance between sales management who would like everything measured and sales professionals who see most activity tracking as a wasteful administrative burden. In Predictable Prospecting, we recommend the following two guidelines to help maintain this balance: First, sales training and sales force automation systems should be continuously aligned to best practices. Second, strive to eliminate the collection of any data that is either unlikely to be used or very likely to be garbage. It is for this reason that we do not recommend collecting reason codes for disqualification unless an organization is committed to using them.
Though execution, measurement, and optimization of Predictable Prospecting may seem daunting, there are many off-the-shelf tools and technologies designed to make tasks and processes simple so sales professionals can focus on activities that deliver deals. These sales productivity tools and technologies are the subject of our next chapter.