
![]()
Reporting Services
One of the most vital aspects of business intelligence is reporting. Organizations rely on reporting engines to deliver key information in a timely fashion. These engines need to allow users to create and deliver a variety of reports based on customer requirements. SQL Server 2012 Reporting Services (SSRS) provides a complete range of tools and services to meet those customer requirements.
If you’ve designed reports using any version of SSRS, you’ll probably be familiar with some of the topics. However, if you are new to SSRS 2012, we recommend you read the overview of SSRS beginning at http://msdn.microsoft.com/en-us/library/ms159106(v=sql.110).aspx.
What Will You Learn in This Chapter?
By the end of the chapter, you’ll learn about
- Architecture of Reporting Services
- Setting up the infrastructure for Reporting Services
- Data source management
- Authoring reports using reporting tools
- Publishing and subscribing to reports
- Integration with SharePoint
- Creating a Power View report
- Interacting with Power View reports
Software Prerequisites
To get the most out of this chapter, you’ll need the following software:
- SharePoint Server 2013 Enterprise Edition
- SQL Server 2012 SP1
- Adventure Works Database (AdventureWorksDW2012 Data File, AdventureWorks Multidimensional Models SQL Server 2012 and AdventureWorks Tabular Model SQL Server 2012 ) downloadable at http://msftdbprodsamples.codeplex.com/releases/view/55330
- SQL Server 2012 Data Tools
- Silverlight Browser Add-In (Required for Power View Reports)
Introduction to Reporting Services
Reporting Services is a server-based platform that facilitates reporting with ready-to-use tools to author, manage, deploy, and deliver reports using Web or Windows applications. Using Reporting Services, you can retrieve data from various data sources, publish reports, and view or export them in various formats. Reporting Services also includes a central management capability through which you can manage reports and report security.
Reporting Services delivers end-to-end processing and management of reports, with solutions that address a wide range of scenarios. You can take advantage of the out-of-the-box features using built-in tools or write custom code using the API. In this way, the product meets the needs of different audiences—report administrators, report authors, and business users. Although they all essentially share same tools, the Reporting Services API helps developers extend the features and functionality.
Here are some of the key features of Reporting Services:
- Builds reports from a range of data sources
- Creates a variety of reports, (including tabular, matrix, and charts) to meet different needs (such as column-based, with summarized data, with graphical data, and more) using built-in templates
- Supports ad hoc reporting with report templates using a ClickOnce application called Report Builder
- Lets users create reports, save them locally, publish them to a SharePoint site or Report Server, and subscribe to these reports
- Supports interactivity, drill-down, and linking to subreports
- Supports eight presentation formats—HTML, MHTML, PDF, XML, CSV, TIFF, Word, and Excel—to open or export a report
- Allows embedding custom or third-party controls with custom report extension(s) in reports
- Allows adding bookmarks and document maps in large reports
- Aggregates and summarizes data using controls and expressions
- Supports embedding images and external content
Now let’s take a look at the Reporting Services architecture.
Architecture
The Reporting Services architecture consists of three major components:
- Report Manager: This is the front end of Report Services, the UI that provides access to the Reporting Services web service, which in turn connects to the Report Server database.
- Web Service Components: These components handle and process all on-demand and interactive requests from report manager and the other tools. They act as a programmatic interface for any custom development and interact with background processing applications.
- Background Processing Applications: These are Windows service components that process reports triggered from a schedule and deliver them based on processing extensions. There are several processing extensions to support different operations:
- Security extensions handle authentication and authorization of users and groups. While the default security extension is Windows authentication, you can write a custom authentication model and replace the default.
- Data processing extensions are used to interact with different data sources. They perform query operations as they process query requests from the report processor component. While default data processing extensions are used to connect to many data source types, you can also write your own custom data processing extension.
- Rendering extensions are those that render data and the layout of the report from the report processor in one of the seven supported formats mentioned earlier. Report Server processes tables, charts, matrices, and more by default. When you need to add a custom feature to a report, you can design and create a custom report processing extension.
- Delivery extensions are used to deliver reports to specific destinations. For instance, an e-mail delivery extension delivers a scheduled report to specified e-mail address through SMTP.
All of these extensions allow users to create custom features in the product. For example, you can create and install a custom rendering extension to support a new output format. Given all these extensions, on a high level the Reporting Services service and component architecture looks like what’s shown in Figure 3-1.

Figure 3-1. Reporting Services service and component architecture
Information about reports, report properties, and objects are stored in a SQL Server database, which also holds report models, published reports, and the folder hierarchy managed by Report Server. This database provides internal storage information for single or multiple report servers. This all arrives as an installation package with SQL Server 2012.
Choosing the Right SSRS Mode
SSRS operates in two modes, native and SharePoint mode. With native mode, Report Server takes the lead and manages all the functions of reporting services. If there is no plan for implementing SharePoint or for integrating with SharePoint, then choosing native mode is appropriate. However, there are significant advantages to using SharePoint mode. Here are some of them.
- Familiar user interface with consistent look and feel
- Document libraries to host reports and data sources
- Single security model for all reports since they are deployed as items in a document library
- BI dashboards designed with reports
- SharePoint features for collaboration
- Publishing and subscription of reports
- Delivery of reports in chosen formats
- Use SharePoint scability options for SSRS reports
Reporting Services supports multiple instances of Report Server and you can have both modes running on a single server. However, to integrate with SharePoint, additional configuration steps are needed. And it is also important to understand what changes occur to the infrastructure after installing SSRS and integrating with SharePoint. Since the SharePoint platform provides the necessary infrastructure when you choose SharePoint mode, you no longer have the functions such as Report Manager, Management Studio, My Reports, Linked Reports, and Job Management that are available in native mode. Also, there’s no way to migrate reports deployed in native mode to SharePoint mode. You have to republish them to SharePoint manually.
Installing and setting up SQL Server Reporting Services and SharePoint 2013 is quite easy. Though you can choose to install any edition of SQL Server 2012, in this chapter we will walk you through installing and configuring Enterprise edition for SharePoint mode.
![]() Note To understand the differences in the feature set of various SQL Server 2012 editions, see the Reporting Services Section at http://msdn.microsoft.com/en-us/library/cc645993(v=SQL.110).aspx.
Note To understand the differences in the feature set of various SQL Server 2012 editions, see the Reporting Services Section at http://msdn.microsoft.com/en-us/library/cc645993(v=SQL.110).aspx.
Setting Up the Infrastructure
After you’ve finished the basic steps for installing SQL Server, such as verification, entering the product key, accepting licensing terms, and installing setup support files, you can then choose features as shown in Figure 3-2. If you are installing SQL Server for the first time, you can select Reporting Services, along with Database Engine Services and others features. If SQL Server is already installed and you are setting up Reporting Services now, rerun the SQL Server setup and choose Reporting Services in the Features pane.

Figure 3-2. Choosing SQL Server features to install
In the next several steps, you configure a number of items, including the installation rules, the SQL Server instance, and the service account for the server. When you’ve completed the basic installation, you then go through Database Engine Configuration, Analysis Services Configuration, and Reporting Services Configuration. For Reporting Services Configuration, you can choose among three options as shown in Figure 3-3.
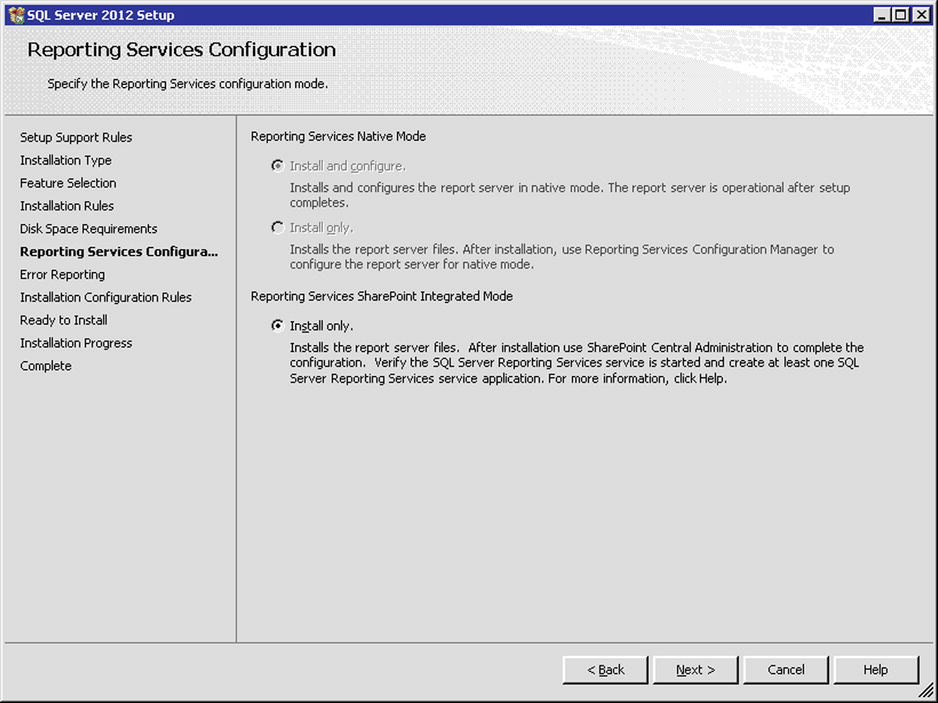
Figure 3-3. Reporting Services configuration modes
Here are the details about the three options you have for on the Reporting Services Configuration screen:
- Install the native modedefault configuration: Select this option to install the report server in its native mode, irrespective of SharePoint. If you choose this option, though, you can technically use report server after installation, but you can’t run it in a SharePoint environment. However, the Report Viewer Web Part can load native-mode reports. Skip this option because you will be using the Reporting Services SharePoint mode.
- Install the SharePoint modedefault configuration: Choose this option to install report server in SharePoint mode. You will also need to install and configure the Reporting Services Add-in for SharePoint products. For this mode to be operational, SharePoint must be available on the same computer. If it is not, choose the next option. The SharePoint mode report server is installed as a SharePoint Shared Service, and it allows Reporting Services to use the enterprise and administrative features of SharePoint.
- Install, but do not configure the report server: Choose this option to install but not configure Reporting Services. When you decide to configure, you can simply run the Reporting Services Configuration tool to set the various options.
Now that Reporting Services and the Reporting Services Add-in are installed, you can configure your SharePoint environment for Reporting Services by following the article at http://msdn.microsoft.com/en-us/library/jj219068.aspx.
To begin authoring reports, it is important to understand the features offered by the Reporting Services Add-in and to choose the right mode (Local vs. Connected) for your reports. It is more likely that you will use connected mode for enterprise reporting scenarios.
In previous versions of SQL Server, the Reporting Services Add-in was available as a standalone installer. But in SQL Server 2012, this is bundled as part of the standard installation package. Let’s take a look at the features offered by this add-in.
Reporting Services Add-in Features
This add-in brings the collaborative features of SharePoint into the reporting environment. Here are some key features enabled by this add-in:
- The Report Viewer Web Part, which can load and render report files.
- Ability to create subscriptions and schedules, implement item-level security, and manage reports, data sources, alerts, version control, and filters.
- Publish reports using SSDT Report Designer to SharePoint libraries.
- Open reports published to a document library using Report Builder.
- Manage report server content using a Simple Object Access Protocol (SOAP) endpoint.
- You can install the add-in either before or after the SharePoint product installation.
- The steps you need to take to configure a report server are greatly reduced.
- You can use SharePoint list data as a data source and generate reports from list data.
- There is support for the SharePoint user token and claims-based authentication.
- There is support for SharePoint Universal Logging Service.
- You can run reports generated using Microsoft Access 2010 and Reporting Services SharePoint list data extension in local mode.
- There is support for multiple languages.
- Provides support for Power View reports.
Reporting Services Local Mode vs. Connected Mode
In the context of SharePoint Server, Reporting Services can run in either connected mode or local mode. Connected mode is the default and includes SharePoint Server, the SSRS add-in, and SQL Server report server. It enables end-to-end reporting, collaboration, and server-based features such as subscriptions. However, after installing the SSRS add-in, you have to configure your SharePoint server.
Local mode was introduced in the SQL 2008 R2 version; it is very lightweight and integrates Reporting Services with SharePoint Server. It consists of SharePoint Server and the SSRS add-in, but it does not require a report server. Because report server is not available, users can view the reports but they have no access to server-side features such as subscriptions. In local mode, reports are rendered locally from a SharePoint document library. In order to run local-mode reporting, you need to enable the ASP.NET session state.
When a user requests a report on the SharePoint site, the report server proxy endpoint creates a session and connects to the report server. It prepares for the processing of the report, and on the report layout it delivers the data and displays it using the Report View Web Part. There are other processing instructions that help in exporting the report in the selected output format and providing drill-down capabilities, delivery on subscription, and so forth.
A key item to note is the SharePoint API. You can program and create custom delivery extensions, extend the data processing, transform data, and create custom rendering extensions. You can also build a custom security extension to support your own authentication needs. Furthermore, you can use the SOAP API to access a report server and the web service programmatically.
Now that you have a good understanding of the Reporting Services infrastructure and the various components involved, it is time to start building your first report. Before authoring your report, you need to consider the entire life cycle of the report.
There are three general steps to consider with any report you want to generate:
- Authoring or creating reports, in which you create a report definition file (.rdl) using SQL Server 2012 SSDT Report Designer or Report Builder 3.0. These report files use data sources that are either embedded or shared and can be published to a report server that is either integrated or not integrated with your SharePoint environment.
- Managing reports, which involves the administration of reports, defining security, managing data-source connections, setting properties, scheduling operations, and so forth.
- Delivering reports, which can be done by various means. The delivery mechanism can be either on-demand or subscription-based.
To consume data or add it to your reports, you will have to create a connection to a data source. To create a data source connection, you need three elements: a data source type, connection information, and credential information. A data source type is a connection type, such as a Microsoft SQL Server, SharePoint List. Connection information contains details about the name and location of the data source. And credentials with permissions over the data source are required in order to access the data.
Data sources can be either shared or embedded. Shared data sources are necessary when a data source is used often by more than one report. Embedded data sources are part of the report itself and can’t be shared with others. Table 3-1 compares shared and embedded data sources.
Table 3-1. Comparison of Shared and Embedded Data Sources
| Shared Data Source | Embedded Data Source |
|---|---|
| Available on report server or SharePoint site | Defined inside a report |
| Can be used by multiple reports | Can be used only by a specific report |
| Managed on a report server | Managed on a report server |
| Can’t be created with Report Builder 3.0 | Can be created using Report Builder 3.0 |
| Required for shared datasets | Not required |
You can author reports with data sources using Report Builder or Report Designer from SQL Server 2012 Data Tools (SSDT). The key difference between the two is that in Report Builder you use the ribbon to insert and configure report items, while in Report Designer you use the SSDT toolbox to perform those tasks. However, both tools generate reports in report definition language (rdl). Table 3-2 compares the tools.
Table 3-2. Comparison of Report Designer and ReportBuilder
| SSDT Report Designer | Report Builder 3.0 |
|---|---|
| Reports authored using SQL Server Data Tools by connecting with various data sources | Does not use SSDT and is a separate application |
| Source control system compatible | Though it is not directly compatible, reports can be source-controlled from the application. For instance, you can source-control report files using SharePoint document library versioning. |
| Used mostly by advanced users and developers | Used by business users for easy report generation |
| Capable of multiple deployments | Not capable of multiple deployments |
| Can embed a data source and create shared data sources | Add report models |
| Can view RDL file source | Can’t view RDL file source |
| Can import reports from an Access database | Can’t import reports from an Access database |
Even a brief glance at the products, as in Table 3-2, suggests that SSDT provides many more features than Report Builder 3.0. To get more details about the features of both, visit http://msdn.microsoft.com/en-us/library/dd207010.aspx. Now, let’s author a basic report using SSDT.
Building and Publishing a Basic Report
When you’re authoring a report and publishing it to your SharePoint environment, it is important to choose the right tool. We will use SSDT Report Designer for the following example and later edit the published report using Report Builder.
PROBLEM CASE
Use SSDT Report Designer to author a report that retrieves data from the Adventure Works DW 2012 cube, and publish the report to a SharePoint environment.
Solution
- Launch SQL Server Business Intelligence Studio and, from the File menu, click on New Project.
- In the New Project window, select the Business Intelligence template from the left side and select Report Server Project from the available templates. Set the Name, Location and Solution Name values, and click OK. In this example, let’s name this project “Report Project Sample.” In the Solution Explorer window, right-click on the Reports folder and then on Add New Report.
- Click Next on the Report Wizard Welcome screen. In the “Select the Data Source” window (Figure 3-4), choose the “New data source” option and enter a valid name for the data source. Under type, select Microsoft SQL Server Analysis Services from the drop-down list.

Figure 3-4. Choose the data source, and set the connection properties
- Click the Edit button. In the Connection Properties window, enter the Server Name, and then choose or enter a database name in the “Connect to a database” area. For this example, choose Adventure Works DW 2012 as your database.
- Click the Advanced button if you need to configure security options, such as integrated security or extended advanced options. Return to the Connection Properties window by clicking OK.
- Verify the connection by clicking on Test Connection, and then click OK.
- When you return to the “Select the Data Source” window, click Next to continue.
- In the “Design the Query” window, click the Query Builder button. Then in the Query Designer window, from the Measure Group drop-down list, select Internet Sales.
- Expand Measures, and select Internet Sales
 Internet Sales Amount. Drag and drop Internet Sales Amount to the grid pane.
 - Expand the Date dimension and open the Fiscal folder. Select Date.Fiscal year, and drag and drop it to the Dimension grid pane. Under Filter Expression, select All Periods and click OK.
- Expand the Product dimension, and drag and drop the attributes Category, Subcategory, and Product onto the grid pane. Your final Query Designer window should look like Figure 3-5.

Figure 3-5. Query Designer
- Click OK to return to the “Design the Query” window.
As a result of previous step, a Query string will be built for you that is nothing but an MDX query that retrieves data from the Adventure Works cube. You can also use query mode by simply clicking on the Design Mode icon (which toggles between design mode and query mode) from the Query Designer window and write your own MDX query.
- Click Next to continue. In the “Select the Report Type” window, select Tabular and click Next.
- In the “Design the Table” window, you can choose where to place the fields on the report. The Page option displays fields at the page level, which means that for any field added to this section, all pages see the value. A classic example in this case is the Title field.
- Use the Group option to view other fields grouped with a selected field in the report table. For instance, you can use this option when you want to group items by some category or by date.
- Finally, choose Details to view the fields in the Details section of the report table. In this example, because our aim is to display Internet Sales Amount grouped by Category and Subcategory of Products, you can simply use the Group and Details options shown in Figure 3-6.

Figure 3-6. Designing the table in the Report Wizard
- Select the Category, Subcategory, and Product fields and click on the Group button.
- Now select Internet_Sales_Amount and click the Details button. Click Next to continue.
- In the “Choose the Table Layout” window, select the Stepped option and click the “Enable drilldown” check box. Click Next to continue.
- From the “Choose the Table Style” window, select Corporate and click Next to continue.
- Finally, provide the report name as “rptInternetSales” and click Finish. You can choose to preview the report by selecting the “Preview report” option before clicking Finish.
- If you opt to preview, your report will now open in preview mode. To toggle the design mode, simply click on the Design tab. Because the title of the report table will automatically inherit the report name, you have to manually change it if you want to display a proper name. Set the title to “Product Internet Sales” in design mode. Adjust the table column widths so that they fit values without wrapping.
- In the Internet Sales Amount column, right-click on the field [Internet_Sales_Amount] and choose Text Box Properties. In the Text Box Properties window, select the Number property in the left pane and choose the Currency category as shown in Figure 3-7. You can leave the other values at the defaults and click OK.

Figure 3-7. Choose Text Box Properties for a specific column field
Your final design-mode window should look like what’s shown in Figure 3-8.

Figure 3-8. SSDT Report Designer design-mode window
Before you deploy this report to your SharePoint environment, you need to adjust some settings on the SSDT project and create some libraries to host the report and data source if it is shared.
- Fire up your SharePoint site, and from the left menu select Libraries “add an app” and then select Data Connection Library. For the Name, use RS Data Connections and click Create. This is the location where your data source will be published.
- After successful creation, your new data connection library will show in the list with a new! icon. Select “add an app” Document Library, set the name to Data Sources, and click Create. Similarly, create two other folders named Datasets and Report Parts, as shown in Figure 3-9.

Figure 3-9. Adding a new app (folders) in the library
This data connection library and the corresponding folders will be used as placeholders for the data sources, datasets, and report parts you design in the report. These will be used only when you share any data sources, datasets, and report parts in your report. If you don’t share, these libraries will be empty even after deploying the reports. Create one more document library to publish the report itself.
- From the Library Menu “add an app”, select the Document Library template, name it Report Library, and click Create.
Ok! Your infrastructure is ready. You can now publish your report and its data source to SharePoint.
- Return to SSDT and in Solution Explorer, right-click your Report project and select Properties. You need to set the deployment options on the Project Property Page to those in Listing 3-1.
Listing 3-1. Basic Report Property Page settings
Target Dataset Folder -     http://yoursharepointsite/datasets
Target Data Source Folder - http://yoursharepointsite/data%20sources
Target Report Folder -      http://yoursharepointsite/report%20library
Target Report Part Folder - http://yoursharepointsite/rs%20data%20connections/report%20parts
Target Server URL – http://yoursharepointsite/ - Leave all the other options as they are, and click OK to close the window.
- Right-click the project in Solution Explorer, choose Build, and ensure there are no errors. Again, right-click on the project, but this time choose the Deploy option. Verify that the deployment was successful, as shown in Figure 3-10.

Figure 3-10. Deployment status output window
The deployment uses the target library settings indicated in Listing 3-1, and the report is deployed to Report Library. Return to your SharePoint site, and access the Report Library document library. You should now see the rptInternetSales.rdl file in the Report library. Because the data source is embedded in this example, nothing will be deployed to the dataset or data source folders.
 Note If you created a shared data source, it is deployed to the report server’s data connections/data sources library folder.
 - To view the report, simply click on the rptInternetSales.rdl file to render the report in the browser as shown in Figure 3-11. Because the report you authored has drill-down capabilities, you can expand a group under the product category and view the Internet sales amount value for a given product.
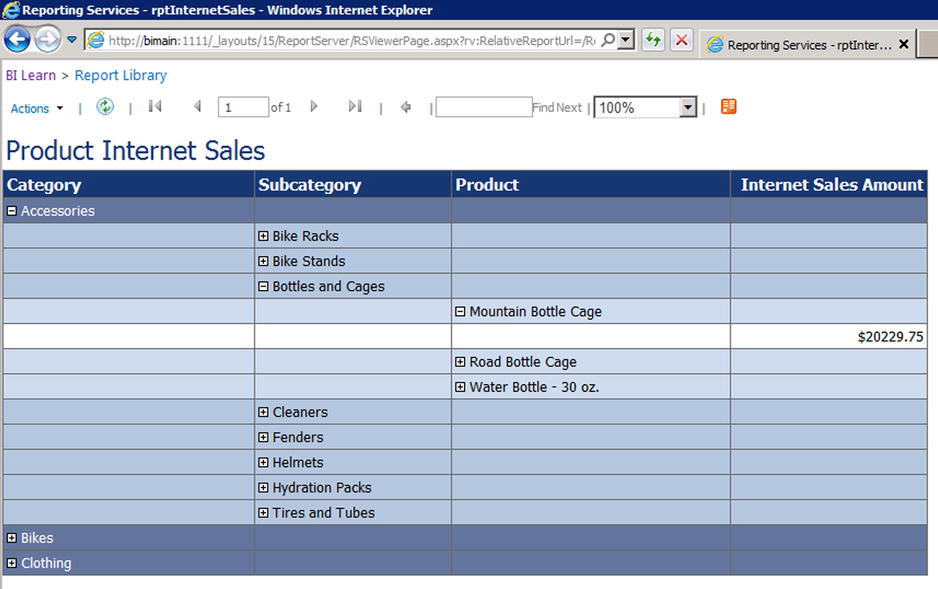
Figure 3-11. Report rendered in the browser in a SharePoint enviroment
Take a look at the report viewer URL. The URL consists of the Report viewer page and arguments passed to the page that include the relative path of the report, source document library, and the default view option of the report indicating whether to open in the client application or browser:
http://yoursharepointsite/_layouts/15/ReportServer/RSViewerPage.aspx?rv:RelativeReportUrl=/Report%20Library/rptInternetSales.rdl&Source=http%3A%2F%2Fbimain%3A1111%2FReport%2520Library%2FForms%2FAllItems%2Easpx
Now that you know how to construct a URL for a specific report, you can use it to load the report in any web or Windows application. For instance, on a different web page, you can use this URL within an iframe to load the report. As mentioned earlier, you can use Report Builder to edit published reports, as you’ll see in the next section.
Using Report Builder to Edit a Published Report
Now you’ve seen how to author and publish a report using the SSDT Report Designer. You can edit the same published report using Report Builder 3.0:
- Click “Edit in Report Builder” from the ECB menu of the report item (Figure 3-12). You can also edit the report after you open it by clicking on “Open with Report Builder” on the Actions menu as shown in Figure 3-13.

Figure 3-12. Edit in Report Builder from the ECB menu of the report

Figure 3-13. Opening Report Builder from the Actions menu
- Once you choose one of those options, the click-once application (Figure 3-14) will launch Report Builder and request user permission to run the application, as shown in Figure 3-15.
Figure 3-14. Launching Report Builder

Figure 3-15. Asking user permission
- Click the Run button to download and run the Report Builder application. Once it loads, you‘ll see the rptInternetSales.rdl file open in design mode. Let’s add some additional functionality to this report now.
- Select the Insert tab on the ribbon, and click on Chart from the Data Visualization section. Choose Chart Wizard from the drop-down menu.
- In the New Chart Wizard window, select the option “Choose an existing dataset in this report or a shared dataset” and click on DataSet1. Click Next to continue.
- Specify the chart type as Pie, and click Next to continue.
- In the “Arrange chart fields” window, from the “Available fields” list, select Internet_Sales_Amount and drag it to the Sum Values section as shown in Figure 3-16. Then select Subcategory, and drag it to the Categories section and click on Next.
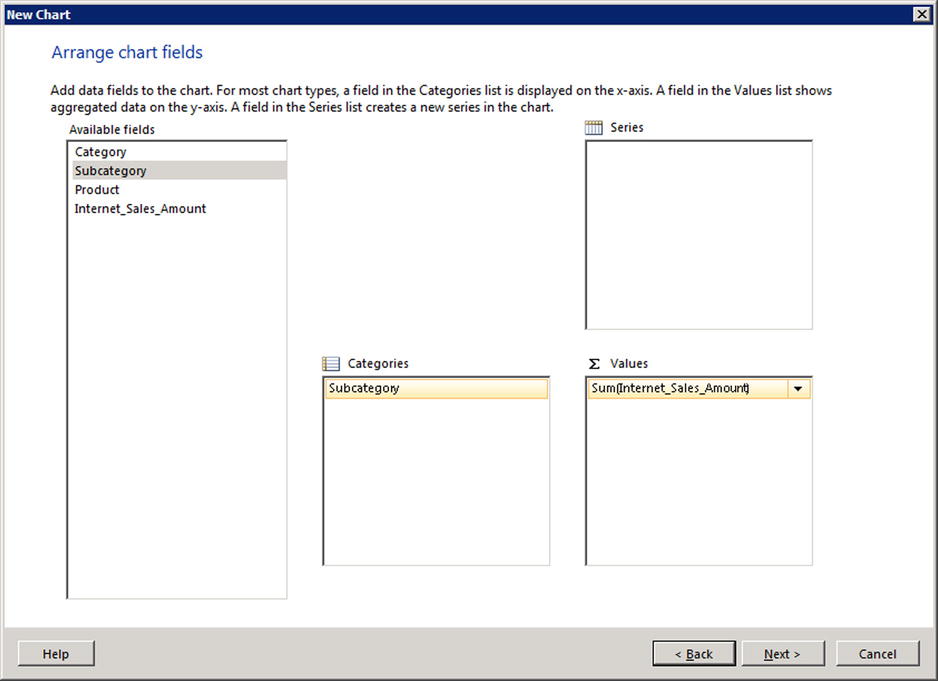
Figure 3-16. Arrange the chart fields for a report using Report Builder
- Select the Generic chart style in the “Choose a style” window, and click Finish. Once the chart is added to the report canvas, adjust it to fit under the table that already exists, as shown in Figure 3-17.
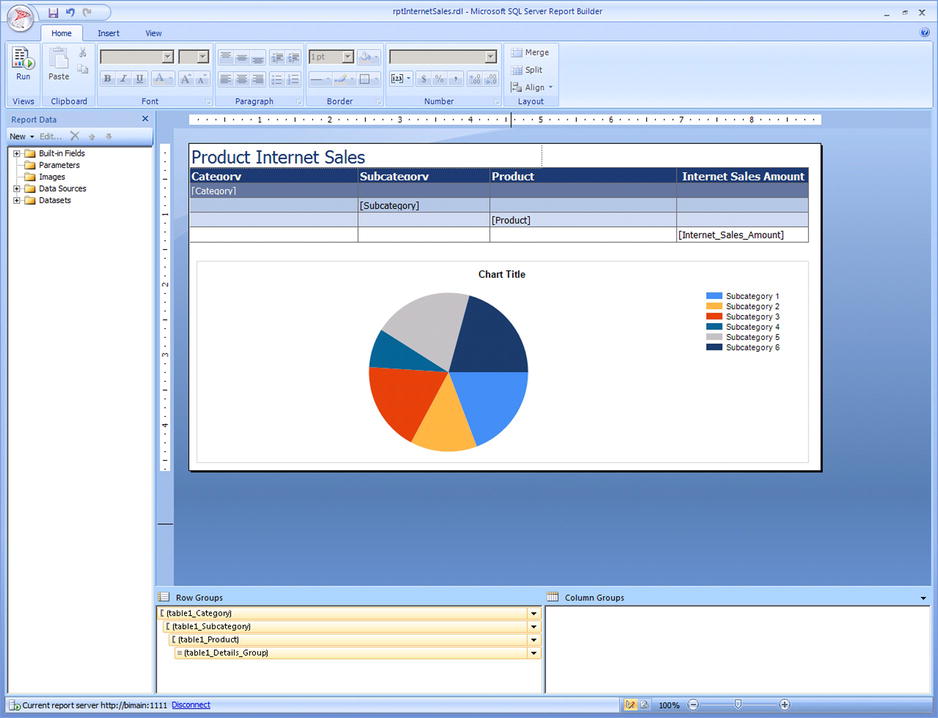
Figure 3-17. Report Builder 3.0 with the report file loaded
- Click the Home tab, and then click the Run button in the Views section to preview the report. To return back to the design mode, simply click on the Design button in the Views section of the Run tab.
- From the File menu, click the Save button, and then click on Exit Report Builder.
- Return to Report Library on your SharePoint site, and click on rptInternetSales item to view the output, as shown in Figure 3-18.

Figure 3-18. Report rendered in the browser using the Reporting Services viewer
Although this report is loaded and rendered using the Reporting Services viewer page, some situations might require you to add the report to a specific custom page instead. In that case, you can load the report to any page using the Report Viewer Web Part, which is available when you install the Reporting Services Add-in to your server. The Report Viewer Web Part provides the same functionalities as the Reporting Services viewer page, such as opening with Report Builder, subscribing to the report, retrieving a report rss feed, and so forth. Let’s see how to load reports using the Report Viewer Web Part.
Loading Reports Using the Report Viewer Web Part
- Click on the Settings button from the top right corner Add a Page provide a page name in the Add a page creation window.
- Once the page is created, from Editing Tools Insert, click the Web Part button on the Ribbon menu.
- From the Categories section, select SQL Server Reporting. In the Available Web Parts section, select the SQL Server Reporting Services Report Viewer Web Part and click Add.
- After the Report Viewer Web Part is added to the page, as shown in Figure 3-19, you can configure the options.

Figure 3-19. SSRS Report Viewer
- Click the “Click here to open the tool pane” link, and in the editor window, click the Browse button next to the “Report input” text box.
- Browse to the Report Library document library, choose the rptInternetSales.rdl file, and click OK.
- Expand the View settings in the editor window, and choose the options you’d like for the report viewer. For now, let’s leave them at the default values.
- Click OK.
- Save and close the page. Notice that the report is loaded in the Report Viewer as shown in Figure 3-20.

Figure 3-20. The SSRS Report Viewer with the Internet Sales report loaded
Is there a way to create a new report using Report Builder? Yes! And it’s quite simple, too. When you install Reporting Services in SharePoint integrated mode, you will have Reporting Services predefined content types automatically enabled on the site. Let’s see what different content types are available and how to use them on your SharePoint site.
Reporting Services Content Types
Reporting Services content types are enabled on SharePoint sites that are integrated with Reporting Services, which you can use to manage Report Builder reports (.rdl) and shared data sources (.rsds). You can enable these content types in a library so that you can create new documents of these types.
Before setting up these content types in a library, you will have to verify few things on the site. First, make sure you are a site collection administrator or have full permissions. Second, ensure that the Report Server Integration Feature is Active in the site collection feature of your site. This feature provides the necessary infrastructure, content types, and so forth for the site. This feature should have been activated when you configured your SharePoint site for Reporting Services earlier in this chapter (Figure 3-16).
You’ll find the content types available under Report Server Content Types. Because you already created a Report Library document library earlier, go ahead and enable these content types on it:
- Open the Report Library document library. From the Library tools Library tab menu on the ribbon, click Library Settings.
- Click the Advanced Settings link under General Settings, and ensure that “Yes” is selected for “Allow management of content types?” Click OK to return to the Document Library Settings window.
- Click Add from existing site content types under Content Types.
- From the Select Content Types section, in the “Select site content types” drop-down list, choose SQL Server Reporting Services Content Types.
- Select Report Builder Model, Report Builder Report, and Report Data Source from the Available Site Content Types list box, and click Add.
- Click OK to return to the Document Library Settings window. Browse back to the Report Library.
- Click the FILES tab from the Ribbon Menu. Under New Document, click the New Document button to view the drop-down list that consists of links to create a Report Model, Report, or a Report Data Source.
- Click on Report Builder Report to load Report Builder 3.0. You can create a new report and publish it to this document library.
In the examples you’ve seen so far, we’ve used an embedded data source, which means the data source is specific to this report only. And as we discussed earlier in this chapter, when you want a data source that can be used in other reports, you need to create a shared data source. The connection information file can be either a report shared data source (.rsds) file or an office data connection (.odc) file that can be hosted in a SharePoint document library. An .rsds file is the same as an .rds file, but it has a different schema. When you create a Report Data Source from a new file in a document library on SharePoint, an .rsds file is created. When you create an .rds file from the SSDT Report Designer and publish it to a SharePoint document library, it will be converted into an .rsds file.
Creating a Report Data Source
To create an .rsds file on your SharePoint site, open the document library where you used the Reporting Services content type earlier.
On the Documents tab of the Library Tools tab, click on Report Data Source on the New Document menu. In the Data Source Properties window, follow these steps:
- Enter the Name of the shared data source (.rsds) file.
- Select the data source type you’d like to use.
- Under Connection String, enter the statement needed to connect with the selected data source type. For examples of connection strings, visit msdn.microsoft.com/en-us/library/ms156450.aspx#Common. For instance, if you’d like to connect to SQL Server and the Adventure Works database, your connection string would be data source="(local)";initial catalog=AdventureWorks.
- Choose credentials for the report server to use to access the external data source.
- a. Use Windows authentication when you want to use users’ credentials to access data in the report; this works well when Kerberos is in effect, and it can’t be used when Forms Based Authentication (FBA) is active on the site. The Windows authentication model doesn’t fit when subscriptions are scheduled for the report, because the user typically doesn’t have exclusive permissions to the report data source.
- b. Choose Prompt for credentials when you want users to enter credentials every time they access the report.
- c. Choose Stored credentials for accessing data with a single set of credentials.
- d. Use Credentials are not required when you are specifying them in the connection string itself.
- Click on Test Connection to ensure the credentials entered are accurate.
- Under Availability, select “Enable this data source” to make the data source active.
- Click OK to save the shared data source file.
The new data source can be accessed via a URL. Whenever you create a shared data source using SSDT Report Designer or Report Builder, you can enter the shared data source’s URL to access it. To know if there are any dependent items using this shared data source, you can click View Dependent Items from the ECB menu of the shared data source item in the document library. You can certainly edit or delete this shared data source, but be aware that will impact the reports using it.
Now, what if someone wants to subscribe to these reports and knows how the data is changing over a course of time? Or maybe you want to save these reports in a particular output format on a scheduled basis? Reporting Services provides a mechanism to fetch these reports either on-demand or on a subscription basis. In the next section, you’ll see how to subscribe to reports that are published to a SharePoint environment.
Subscription to Reports
When you publish reports to a SharePoint environment integrated with a report server, you have the option to subscribe to them as long as you have access to the reports. You can create subscriptions that can be delivered as follows:
- To a SharePoint document library: Reports are delivered to a document library that is available on a SharePoint site integrated with report server running in SharePoint integrated mode. The delivered reports are static in this case.
- To a shared folder on file system: Static reports can be delivered to a shared folder that is accessible from the network.
- To e-mail: Reports are delivered as an e-mail attachment.
- Null: You can preload ready-to-view parameterized reports into a cache for specific scenarios. They can be used by administrators with the data-driven subscription model.
![]() Note Data-driven subscriptions are used when you want to customize the distribution based on dynamic subscriber data at run time. For instance, you can distribute a report in any format either as is or filter data within your organization where subscriber lists vary over time. To learn more about data-driven subscriptions, go to msdn.microsoft.com/en-us/library/ms169673.aspx.
Note Data-driven subscriptions are used when you want to customize the distribution based on dynamic subscriber data at run time. For instance, you can distribute a report in any format either as is or filter data within your organization where subscriber lists vary over time. To learn more about data-driven subscriptions, go to msdn.microsoft.com/en-us/library/ms169673.aspx.
Reports are delivered in one of the available formats you choose while subscribing, including xml, csv, tiff, pdf, mhtml, Excel, and Word. For best results, it is recommended that you export reports in preview mode to see if they emerge correctly. If not, you can change them in design mode to make them look better.
An important aspect to note here is that reports delivered by subscription are not the original report files (.rdl). They are static reports, and you can’t use them with the Report Viewer Web Part. Even if you change the extension back to .rdl, you will not be successful in loading them.
![]() Note When versioning is enabled, only the major version will be created for the rendered output documents.
Note When versioning is enabled, only the major version will be created for the rendered output documents.
In the following example, let’s try to subscribe to the Internet Sales report and deliver it to a SharePoint document library in the web archive file format (.mhtml).
PROBLEM CASE
Subscribe to a published Internet Sales Report, and have the report delivered to the document library in the web archive file format.
Solution
- From the menu on the left, click on Libraries and select “add an app.”
- From the available templates, choose Report Library1, enter a valid name (in this case, “Subscription Reports”), and click Create. This will be the location where subscribed reports will render the output files.
- Return to the Report Library document library where you previously published the Internet Sales report file (rptInternetSales).
- From the ECB menu on the report file, choose Manage Subscriptions. On the Manage Subscriptions page, click Add Subscription (Figure 3-21).
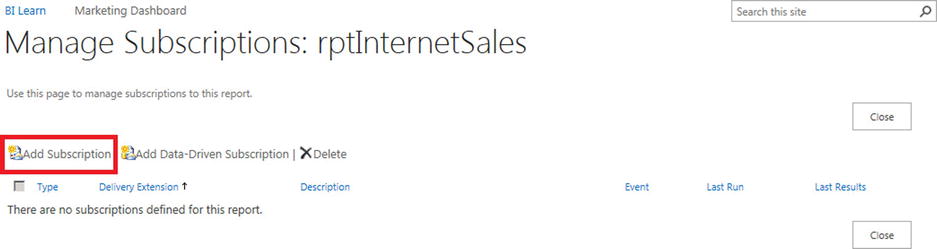
Figure 3-21. Add subscription to report
Because credentials used to run the report are not stored and are embedded on the report, you will not be able to create a subscription. Also, you’ll see an error message, as shown in Figure 3-22.

Figure 3-22. Error resulting from trying to add a subscription to a report
- Return to Report Library, and right-click on the rptInternetSales item. From the ECB menu, choose Manage Data Sources.
- Click on the dsAdventureWorks data source item. In the Credentials section on the Data Source Connection Information screen, select Stored credentials.
- Enter your domain username for User Name, and enter the corresponding password in the Password text box that has access to the data source. Most importantly, make sure you select the check box that says “Use as Windows credentials.” This ensures that the credentials act as if they are running in Windows Authentication mode, which is what is required for SQL Server Analysis Services (SSAS) databases.
- Click on Test Connection to ensure that the credentials have access to the data sources, as shown in Figure 3-23. On verification, you will see the connection status under the Test Connection button.

Figure 3-23. Manage report data source connection credentials
- Click OK to return to the data source information page. Click the Close button to return to your Report Library document library. From the ECB menu, select Manage Subscriptions and click Add Subscription.
- In the Subscription Properties window, select SharePoint Document Library as the Delivery Extension.
- Enter the path of the document library, or use the browse button next to the text box.
- Under File Options, enter a valid file name. If you’d like to append the file extension, choose “Append file extension to name.” The file extension is decided based on the output format you choose in the next setting. For instance, if you use “rptInternetSales” as the file name and choose the MHTML (web archive) format, the delivered subscription would have the file name rptinternetSales.mhtml. If you don’t choose this option, the file will have no extension. If you’d like to set the Title property of the file, set its value in the Title input box.
- Choose MHTML (web archive) as the output format from the drop-down list.
- Under Overwrite Options, select the option named “Overwrite existing file or create new version of file”.
- Under Delivery Event, select “On a custom schedule” and click the Configure button.
- In the Schedule definition window, select the Frequency as Day. Under Schedule, select “Repeat after this number of days” and set the value as 1. Select the Start time as 8:00 A.M.
- Under “Start and End Dates,” specify “Begin running this schedule on” as the current date. If you’d like to run it forever, just leave “Stop running this schedule on” blank and click OK.
- On returning to the Subscription Properties window, click OK.
Note To run Schedules, make sure that SQL Server Agent (MSSQLSERVER) is running.
- You should now be able to view the newly created subscription in the Manage Subscriptions window as shown in Figure 3-24.
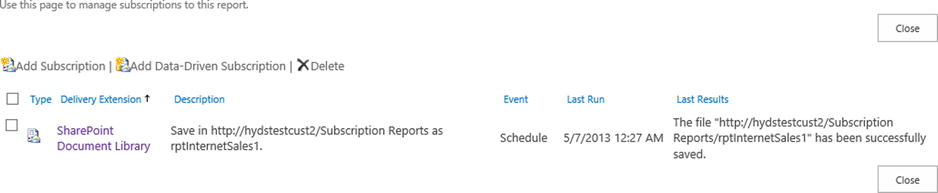
Figure 3-24. Manage subscriptions to a report
- Return to the previously created subscription reports library and you should see that a copy of the report is saved as shown in Figure 3-25.

Figure 3-25. Subscription report saved to Report Library
You can click and download the document to your local system and open it to view it. However, you will notice that the drill-down capabilities don’t work when you open these reports. This is one of the limitations of the delivered reports. To overcome this issue, you need to subscribe for e-mail delivery, which will contain a hyperlink to the generated report.
Tip Visit msdn.microsoft.com/en-us/library/bb283186.aspx to learn how to create a subscription for report-server e-mail delivery.You can view a complete list of available data connection types when creating a new data source or a report, as Figure 3-26 shows.

Figure 3-26. Data connection types available for a report
In the previous example, you saw how to use SQL Server Analysis Services as your data connection type. Authoring a report using a SharePoint list as a data source and publishing it to a SharePoint document library is similar. In the latter case, of course, you retrieve data from a SharePoint list.
Integration with a SharePoint List
For this example, let’s use the Airport Flight Stats custom list you created in Chapter 2. We will also author a new report using the same Report Project Sample you created using SSDT earlier in this chapter.
PROBLEM CASE
Author and publish a report using the Airport Flight Stats custom list.
Solution
- Launch SQL Server 2012 SSDT, and open the previously created Report Project Sample project. In Solution Explorer, right-click on the Reports folder, and then click Add New Report.
- On the Welcome screen, Click Next to continue. For “Select the Data Source,” choose “New data source,” enter the Name as dsAirportFlightStatus, and choose “Microsoft SharePoint list” under Type.
- Click on Credentials, select “Use Windows Authentication (Integrated Security),” and click OK. In the “Select the Data Source” window, enter http://yoursharepointsiteurl/ as the Connection String and click Next.
- In the “Design the Query” window, click the Query Builder button. In the Query Designer window, from the available SharePoint Lists, select the Airport Flight Stats list as shown in Figure 3-27 and click OK.

Figure 3-27. SSDT Report Designer Query Designer
- The Query Builder window will close and return you to the “Design the Query” window. Notice that the Query string is now populated with field reference information. Click Next to continue.
- In the “Select the Report Type” window, choose Tabular and click Next.
- In the “Design the Table” window, from the Available fields, select Title, Number_of_flight_run, Number_of_cancelled_flights, Arrival_delays, and Missing_baggage_count and add them to Details display fields. Click Next, and select Corporate style in the “Choose the Table Style” window.
- In the “Completing the Wizard” window, enter the Report name as rptAirportFlightStats and click Finish.
- In the Design window, adjust the column widths and provide a proper title for the table as shown in Figure 3-28.

Figure 3-28. Authoring a report using SharePoint List data
- Because the project is already configured with deployment settings from our earlier project, right-click on the rptAirportFlightStats.rdl file and click Deploy. This step builds the project and deploys the report file to the Report Library.
- Return to the SharePoint site, and access the Report Library where the report was deployed.
- Click the report file, and view the report rendered in the browser as shown in Figure 3-29. Now that you have a published report, you can use the Report Viewer Web Part as well to load it to a specific page.

Figure 3-29. View a report authored using SharePoint List data
Power View is a Silverlight-based web client for ad-hoc data analysis and interactive data visualizatons. It is part of the SQL Server 2012 Reporting Services Add-in and runs within SharePoint. This feature is available only within a SharePoint Reporting Services native mode installation and will not be able to run Power View reports.
Until recently, Power View could work only with Analysis Services Tabular models. Power View internally sends DAX queries to the back-end model, gets the required results, and renders them in the view. The traditional SSAS cubes (Multidimensional cubes) used to accept only MDX queries, not DAX Queries. Microsoft recently added DAX support for Multidimensional cubes. You will be able to use Power View with Multidimensional models now. More details on this can be found at http://blogs.msdn.com/b/analysisservices/archive/2013/05/31/power-view-connectivity-for-multidimensional-models-released.aspx.
There are good reasons to use Power View for data visualization compared to other data visualization tools such as Excel and Performance Point Services:
- End users can quickly build highly interactive and visually appealing dashboards.
- Power View, by default, provides cross-filtering capabilities across charts: selecting an item in one chart can automatically filter data in other charts based on the current selection.
- There’s no need to establish a connection between filters and charts explicitly to filter data.
- A Power View report can be exported into PowerPoint, and you can interact with the charts within PowerPoint as you do on the SharePoint site.
![]() Note Power View needs the Silverlight add-in to be installed on users’ machines to be able to author or view reports.
Note Power View needs the Silverlight add-in to be installed on users’ machines to be able to author or view reports.
Creating a Power View Report
Bulding an interactive Power View report is quick and easy. Unlike a traditional SSRS report, fully functional Power View reports can be built right within the browser. SQL Server Data Tools is not required for building Power View Reports. Let’s build our first Power View report now.
PROBLEM CASE
Create a Power View report from Adventure Works Tabular Model.
Solution
- Navigate to Report Library from the SharePoint menu.
- From the FILES tab on the ribbon, click the New Document button to see the drop-down menu options, as shown in Figure 3-30.

Figure 3-30. Creating a new Data Connection for Power View
- In the Data Source properties page, enter the name as dsPowerViewDataConn.
- Select “Microsoft BI Semantic Model for Power View” from the Data Source Type list.
- Choose the “Windows Authentication (Integrated) or SharePoint user” option from the Credentials section.
- Click on the Test Connection button at the bottom of the page. At this point, the page should look like the one shown in Figure 3-31.

Figure 3-31. Configuring the data connection for Power View
- From the report library, click on the ECB menu and select the Create Power View Report option as shown in Figure 3-32.This opens a new page for you to design your Power View report.

Figure 3-32. Invoking the Power View report designer from SharePoint
- From the field list on the right side, expand “Internet Total Sales” and drag and drop it in the Field list as shown in Figure 3-33.

Figure 3-33. Adding Internet Toal Sales Amount to Power View
- On the Design ribbon, select Table and change the chart type to Bar.
- From the Field list, select Sales Territory and drag it into the Axis section.
- From the Field list, select Product Subcategory Name and drag it into the Legend section.
- Click on the Title section in the Report design area, and enter the text “Internet Sales”.
- Adjust the chart height and width to maximize the viewing area. At this point, your report should look like Figure 3-34.

Figure 3-34. Creating a bar chart with Power View
- Click on the empty section below the chart, and select Internet Total Sales from the Field list.
- From the Field list, select Month from the Date table, Promotion Type from the Promotion table and Internet Total Sales from the Internet Sales table.
- From the ribbon, select the Line chart option from the Design tab. At this point, your table should look like the one shown in Figure 3-35.

Figure 3-35. Creating a line chart with Power View
- Click on the File menu at the top of the screen, and select Save. Then enter the File Name as Power View - Internet Sales and click on the Save button.
Interacting with Power View Reports
Once the Power View report is saved into a document library, users can open this report and explore the data in it. Power users can edit the report, change the layout of the report, and save it into the document library with the same name or a different one.
PROBLEM CASE
Let’s look at how you can interact with the Power View report in the View mode.
Solution
- Go to the Report Library, and select the Power View - Internet Sales report from the list, as shown in Figure 3-36.

Figure 3-36. Opening a Power View report from a SharePoint library
- Click on the areas marked by the arrows as shown in Figure 3-37, and see how other parts of the charts filter data based on the selection. This is one of the powerful features of Power View that makes it possible to create a more interactive report. You can click on the empty area on the chart to clear the current selection and return to the initial view of the report.

Figure 3-37. Exploring the Power View cross-filtering feature
- Place your mouse on the data bars. You will see a tooltip window with additional details for the item your cursor is hovering over, as shown in Figure 3-38.

Figure 3-38. View additional details of data bars
- Each chart item has an option to apply filters to restrict data. You can click on the Filter icon in the top right corner of the chart to access the filter options. From the filter section, you can use sliders to choose a range for numeric fields and a drop-down list to filter other fields. As soon as you change the filter options, you can immediately see the result of the filter operation in the charts, as shown in Figure 3-39.

Figure 3-39. Filter numeric values using sliders
You can also export the contents of the Power View dashboard into PowerPoint and interact with charts within PowerPoint.
- Click on the Edit Report option on the ribbon, as shown in Figure 3-40, and then select the File Export to PowerPoint option as shown in Figure 3-41.

Figure 3-40. Switching to the Edit mode for a Power View report

Figure 3-41. The Export to PowerPoint option
![]() Note The exported PowerPoint file supports interactivity with the charts/tables only if you have a connection available to the SharePoint server.
Note The exported PowerPoint file supports interactivity with the charts/tables only if you have a connection available to the SharePoint server.
Summary
As Figure 3-42 highlights, in this chapter you learned about the following:
- Reporting Services architecture and installation
- Setting up Reporting Services
- Configuring SharePoint for Reporting Services
- Report life cycles
- Data source management
- Authoring tools for Reporting Services
- SharePoint integration
- Subscribing to reports
- Introduction to Power View and creating a Power View report
- Interacting with Power View reports

Figure 3-42. Reporting Services road map
What’s Next?
In the next chapter, you will learn about Business Connectivity Services (BCS) and the improvements in the latest version. We will walk you through setting up BCS, the tools, and external content types (ECT). You will learn how to create an ECT using both SharePoint Designer and.NET Connector. And finally, you will learn about the Business Data Catalog (BDC) runtime and integration with Office applications such as Word and the SharePoint workspace.
1 You can use any document library template as well.