
Chapter 15: Monitoring SharePoint 2010
What’s In This Chapter?
- Improvements in diagnostic log management
- Using correlation IDs
- Using the logging database
If you’ve made it this far you’ve got SharePoint 2010 installed and running. You’ve created a web application or two and uploaded some content. You’ve probably configured some service applications and sent them off to do their work. SharePoint is doing its thing and life is good. You might be tempted to lean back in your chair and put your feet up, but your adventure is not finished. While SharePoint might be spinning like a top now, the day will come when there are problems. When that happens, you will need to know how to find out what’s troubling SharePoint so that you can fix it. A lot of work has been put into monitoring in SharePoint 2010. So much has been added that Monitoring has been given its own tab in Central Administration. SharePoint will report errors, but you need to know where to find them. This chapter will show you how to keep an eye on SharePoint, both in proactive and reactive ways so that you can keep your SharePoint servers in tip-top shape. This will enable you to fix SharePoint when it’s broken, as well as see where problem areas are before they become bad enough that your end users complain. Nobody likes that.
We will start our journey toward SharePoint monitoring enlightenment with the Unified Logging Service (ULS). To the seasoned SharePoint administrator, the ULS logs are nothing new. They have been around for a version or two of SharePoint. SharePoint 2010 carries on that tradition but improves on it. The ULS surfaces information in three different places; trace logs, Windows Event Viewer, and a new reporting database. This chapter covers all three areas and explains how they differ.
ULS is sort of like SharePoint’s tattletale. It is only a logging service; it does not act on any of the events that it sees. However, as you’ll see later in this chapter, SharePoint monitoring is more than just the ULS logs and is not always passive. The ULS service’s purpose in life is to provide the SharePoint administrators or operations teams with all the information they need to solve problems, or head problems off at the pass. The hope is that with all the information that ULS provides, you should be able to spend fewer resources keeping an eye on SharePoint; and in the unlikely event of a SharePoint problem, the ULS should provide you with the information you need to resolve the problem quickly.
Trace Logs
When most SharePoint administrators hear “ULS” they immediately think of the ULS logs that they have been using for years with previous versions of SharePoint. In SharePoint 2010 these are officially referred to as the trace logs. The trace logs have a similar address to their counterparts in previous versions of SharePoint. You can find them in the Logs folder of C:Program FilesCommon FilesMicrosoft SharedWeb Server Extensions14. That’s quite a mouthful, so Microsoft has lovingly christened that path the “SharePoint Root.” You may also hear some less refined people refer to it as the “14 Hive.”
Figure 15-1 shows what you can expect to see if you look for the ULS trace logs in Explorer. The filename consists of the server name, the date in four-digit year, month, and date order, followed by the time in 24-hour format. You’ll also notice that the duration between log file creation is always exactly 30 minutes apart, at least while the machine is on. This is the default setting, although you can use Windows PowerShell to change this. See the sidebar for more information on using PowerShell with trace logs.

If you open one of the trace logs, you will see that it is packed full of great SharePoint information, probably more than you need on a daily basis. The good news is that you will probably access the trace logs only when you’re researching a problem. The bad news is that even then, there still might be more information presented than what is really helpful for troubleshooting your issues. You’ll see later how to control how much information is added to the trace logs.
Improvements from SharePoint 2007
If you used SharePoint 2007 at all you’re probably asking yourself what’s so special about trace logs in SharePoint 2010. We’re glad you asked. While they are similar in intent, the trace logs received a number of really exciting improvements. Figure 15-1 hinted at the first improvement; the log files are smaller. A lot of changes have made that possible. From Figure 15-1 you can see that by default the log files themselves are compressed on the drive, using NTFS compression. Because the logs are text files and consist of a lot of repeating data, they compress very well. The files in Figure 15-1 each show a size of around 31MB, but each actually uses around 13MB on disk due to the compression. That’s over 50% smaller and the only penalty is some CPU cycles. To make the files even smaller, many of the noisy events that were written to the SharePoint 2007 log have been removed.
To better manage the information written to the trace logs, the throttling interface has been given a complete overhaul. In SharePoint 2007, the information written to the trace logs could be controlled, to a point. Unfortunately, it wasn’t very useful. If the diagnostic levels were increased to troubleshoot a problem, it was impossible to determine which settings had been changed. Moreover, even if you knew which levels had been changed, there was no way to determine what they had been changed from. It was a mess. In SharePoint 2010 this has all been fixed.
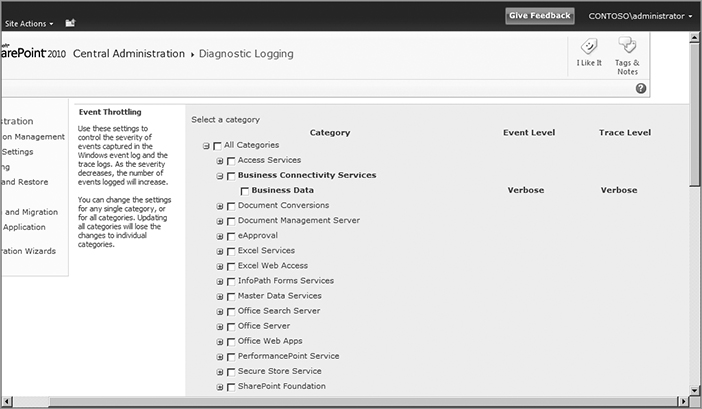
To get to the new Event Throttling settings, go into Central Administration and click Monitoring on the left navigation pane. Figure 15-2 shows all the Monitoring links.

In the Reporting section, click “Configure diagnostic logging” to get to the Event Throttling settings, shown in Figure 15-3. Compared to SharePoint 2007, you’ll notice a wider variety of categories. This makes it easier to determine which category covers the event you want to find. Expand the category to see the settings each contains. This demonstrates two improvements over SharePoint 2007. First, you have more granular ability to find the settings you’re looking for. One of the diagnostic categories in SharePoint 2007 was General/Administration, which isn’t particularly helpful when you’re trying to find where you can increase logging. Second, the interface has checkboxes so you can alter multiple events at once.
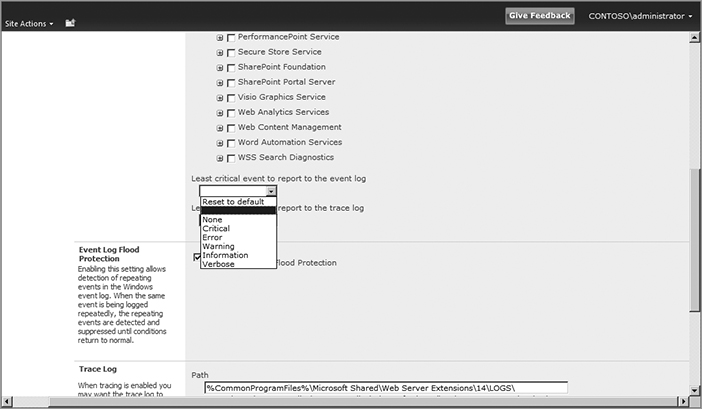
Some features are shared with SharePoint 2007. For example, you can control how much information is written to the trace logs as well as the Windows Event Viewer. You can choose from among several logging levels. For the Windows Event Log, the events are listed in order of fewest messages to most: None, Critical, Error, Warning, Information, and Verbose. For the trace logs you can select None, Unexpected, Monitorable, High, Medium, or Verbose. You can easily change both settings for multiple events on one screen. As you can see, altering the diagnostic levels is much easier in SharePoint 2010.
Easy alterations can be a good feature, but it can also be bad. It enables you to fine-tune the changes you need, but it can also mean changing many settings back once you’ve successfully fixed the issue you’re investigating. Fortunately, SharePoint 2010 provides improvements in that area as well. Any time you change a diagnostic level, that category appears in bold in the interface (refer to Figure 15-3).
It’s one thing to know which settings have been changed; it’s another to know what to reset them to. Have no fear; SharePoint 2010 takes care of that too. One of the event levels to which you can set a category is Reset to default, as shown in Figure 15-4.
The combination of those two improvements makes it easy to get your diagnostic levels back to their defaults after you’ve cranked them up to investigate an issue.
Trace Log Settings
A few other settings are related to the trace logs. They involve the location of the trace logs and how long to keep them. As noted earlier, by default they are written to the Logs directory of the SharePoint Root. You can, and probably should, move them to a different location. That’s because in most cases Windows is installed on the C: drive, and the SharePoint Root must be on the C: drive. Therefore, it’s a good idea to leave the C: drive with as much free space as possible. Moving the trace logs to a different drive reduces the possibility of filling up the C: drive. Figure 15-5 shows SharePoint writing the trace logs to D:SharePointLogs.
Keep in mind that this is a farm-level setting, it is not per server. Any path you put here must exist on all servers in the farm. If you try to enter a path that does not exist, SharePoint will not let you save it. This is also a concern when you add new servers to your farm; make sure they also have the trace log path available.
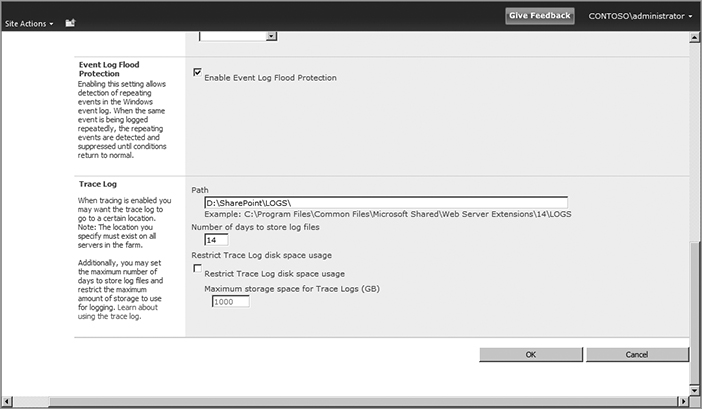
Figure 15-5 shows the other trace log settings that are available to you. They are used to restrict the storage space used for trace logs. You have two methods to control their growth. One option is to control how many days’ worth to keep. The default value is 14 days; with this value, on day 15 the logs from the first day are deleted. The other option is to absolutely restrict the amount of drive space available to the trace logs. The default, and maximum, value is 1000GB. If you choose to restrict drive space, then both settings are used to control the logs. If the logs are small and don’t hit the space restriction, then they will be pruned based on the day restriction. If the logs are very active and they reach the space restriction before the day restriction, they will be pruned.
Trace Logs Administration with Windows PowerShell
Windows PowerShell can be used for many amazing tasks. The following sections demonstrate the PowerShell cmdlets useful for working with trace logs.
Configuring Diagnostic Log Settings with Windows PowerShell
If you’re the scripting type, you can use Windows PowerShell to view and configure SharePoint’s diagnostic log settings. You can use the cmdlet Get-SPDiagnosticConfig to get a list of the farm configuration settings. If you want to change any of the settings, use the cmdlet Set-SPDiagnosticConfig to assign the values you want. The following command will change the number of days SharePoint keeps the trace logs to 30 days:
Set-SPDiagnosticConfig -DaysToKeepLogs 30
Changing Logs with Windows PowerShell
You also have the option to use Windows PowerShell to set and get the logging level for specific categories. Running the cmdlet Get-SPLogLevel with no parameters will report the logging level for all categories. If you want to change a category’s level, use Set-SPLogLevel to alter the category’s value.
PowerShell can also manipulate the trace files themselves. New-SPLogFile tells SharePoint to create a new trace file. This is a great diagnostic technique. If you create a new trace file before you start troubleshooting, you will know exactly which file contains the error. To take it another step, use Merge-SPLogFile to merge all the trace files in your farm into a single file on the local computer.
To get the entire list of trace file–related cmdlets, use the following command:
Get-command –noun splog*
Correlation IDs
There is one addition to the trace logs that does help you hone in on the information you need. SharePoint 2010 introduces correlation IDs. Correlation IDs are unique GUIDs that are assigned to each user conversation with SharePoint. They are like breadcrumbs that a SharePoint administrator can use to follow a user around and see what they were doing if there is a problem. Nothing is more frustrating when troubleshooting than when you ask a user, “What were you doing when you got the error?” and they reply, “Nothing.” Correlation IDs are like flashlights guiding us through the fog of unhelpful users.
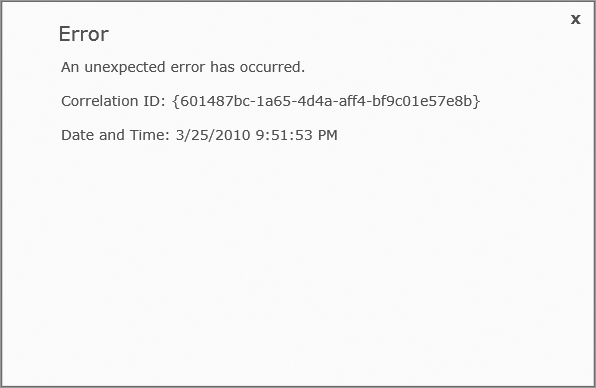
Correlation IDs will surface when SharePoint crashes in the browser. The user will still get the ever helpful “An Unexpected Error Has Occurred” message or something else equally helpful. On top of that, though, they will get a correlation ID in the form of a Globally Unique IDentifier, or GUID to its friends. GUIDs are randomly generated and in the form of “601487bc-1a65-4d4a-70dd-bf9c01e57e8b.” There will a correlation ID in this form on the error page, like you see in Figure 15-6. As a SharePoint administrator, you can take this correlation ID and search through your trace logs to follow the user’s conversation with SharePoint, as well as see exactly which lines in the trace logs deal with that failure. Figure 15-7 shows some of the corresponding trace log entries to the error shown in Figure 15-6. No more searching through trace logs trying to figure out which lines pertained to which errors. Now it is all mapped out for you, with a lighted path.

To make your troubleshooting even easier, correlations IDs are persisted across servers in your farm. So if a user initially hits SERVER1, which is running the web front end role, and that renders an Excel spreadsheet that is calculated on SERVER2, the correlation ID for the conversation will be the same on SERVER1 and SERVER2. The correlation ID is even available as a filter if you are doing SQL tracing on your SQL server. You can use the Windows PowerShell cmdlet Merge-SPLogFile to merge the trace logs from all the servers in your farm into a single file. This allows you to do one search for the correlation ID and get the activity from your whole farm.
Since a correlation ID is generated for every conversation, there doesn’t need to be an error in order for you to follow the conversation. You might use it to see why a particular web page is loading slowly, or why a certain Web Part doesn’t load correctly. To get the correlation ID without an error page you can enable the developer dashboard, as it reports the correlation ID. What’s the developer dashboard, you ask? This is what storytellers call “foreshadowing.” Read on to learn about the developer dashboard.
Developer Dashboard
While this book is squarely aimed at SharePoint administrators, we need to cover a new piece of functionality called the developer dashboard. Despite what the name may suggest, it’s not just for developers. The developer dashboard is dashboard that shows how long it took for a page to load, and which components loaded with it. A picture is worth 1000 words, so Figure 15-8 probably explains it better.

This dashboard is loaded at the bottom of your requested web page. As you can see, the dashboard is chock full of information about the page load. You can see how long the page took to load (708.77 ms) as well as who requested it, its correlation ID, and so on. This info is useful when the helpdesk gets those ever popular “SharePoint’s slow” calls from users. Now you can quantify exactly what “slow” means as well as see what led up to the page load being slow. If Web Parts were poorly designed and did a lot of database queries, you’d see it here. If they fetched large amounts of SharePoint content, you’d see it here. If you’re really curious you can click the link on the bottom left, “Show or hide additional tracing information” to get several pages worth of information about every step that was taken to render that page.
Now that you’re sold on the developer dashboard, how do you actually use it? Like we mentioned before, it is exposed as a dashboard at the bottom of the page when it renders. The user browsing the page must be a site collection administrator to see the developer dashboard, and it must be enabled in your farm. By default it is shut off, which is one of the three possible states. It can also be on, which means the dashboard is displayed on every page load. Not only is that tedious when you’re using SharePoint, but it also has a performance penalty. The third option, ondemand, is a more reasonable approach. In ondemand mode the developer dashboard is not on, but it’s warming up in the on deck circle, waiting for you to put it in the big game. When the need arises, a site collection administrator can turn it on my clicking the icon indicated in Figure 15-9. When you are finished with it, you can put it back on the bench by clicking the same icon.

How do you go about enabling the developer dashboard to make this possible? You have two options. You can use sad, old STSADM, or you can use shiny new Windows PowerShell. The following code shows both ways of enabling it.
Using STSADM:
stsadm -o setproperty -pn developer-dashboard -pv on
stsadm -o setproperty -pn developer-dashboard -pv off
stsadm -o setproperty -pn developer-dashboard -pv ondemand
Using Windows PowerShell:
$dash = [Microsoft.SharePoint.Administration.SPWebService]::
ContentService.DeveloperDashboardSettings;
$dash.DisplayLevel = 'OnDemand';
$dash.TraceEnabled = $true;
$dash.Update()
Notice that at no point do you specify a URL when you’re setting this. It is a farm-wide setting. Never fear though; only site collection administrators will see it, so hopefully it won’t scare too many users if you have to enable it for troubleshooting.
Logging Database
Microsoft has always made it pretty clear how it feels about people touching the SharePoint databases. The answer is always a very clear and concise, “Knock that off!” They didn’t support reading from or writing to SharePoint databases, period. End of story. That became a problem, however, because not all of the information administrators wanted about their farm or servers was discoverable in the interface, or with the SharePoint Object Model. This resulted in rogue administrators, in the dark of night, quietly querying their databases, hoping to never get caught.
SharePoint 2010 addresses this by introducing a logging database. This database is a repository of SharePoint events from every machine in your farm. It aggregates information from many different locations and writes them all to a single database. This database contains just about everything you could ever want to know about your farm. Even better, you can read from and write to this database if you would like, as the schema is public. Do your worst to it, Microsoft doesn’t care.
Microsoft’s reason for forbidding access to databases before was well intentioned. Obviously, writing to a SharePoint database potentially puts it in a state where SharePoint can no longer read it and render the content in it. We all agree this is bad. What is less obvious though is that reading from a database can have the same impact. A seemingly innocent but poorly written SQL query that only reads values could put a lock on a table, or the whole database. This lock would also mean that SharePoint could not render out the content of that database for the duration of the lock. That’s also a bad thing. This logging database, however, is just a copy of information gathered from other places and is not used to satisfy end user requests, so it’s safe for you to read from it or write to it. If you destroy the database completely, you can just delete it and let SharePoint re-create it. The freedom is invigorating.
Figure 15-10 shows some of the information that is copied into the logging database.

Configuring the Logging Database
How do you use this magical database and leverage all this information? By default, health data collection is enabled. This builds the logging database. To view the settings, open SharePoint Central Administration and go into the now familiar Monitoring section. Under the Reporting heading, click “Configure usage and health data collection,” as shown in Figure 15-11.

Let’s start our tour of the settings at the top. The first checkbox on the page determines whether the usage data is collected and stored in the Logging database. This is turned on by default, and here is where you would disable it, should you choose to.
The next section enables you to determine which events you want reported in the log. By default, all eight events are logged. If you want to reduce the impact logging has on your servers, you can disable events for which you don’t think you’ll want reports. You always have the option to enable events later. You may want to do this if you need to investigate a specific issue. You can turn the logging on during your investigation, and then shut it off after the investigation is finished.
The next section determines where the usage logs will be stored. By default they are stored in the Logs directory of the SharePoint Root, along with the trace logs. The usage logs follow the same naming convention as the trace logs, but have the suffix .usage. As with the trace logs, it’s a good idea to move these logs off of the C: drive if possible. You can also limit the amount of space the usage logs take, with 5GB being the default.
The next section, Health data collection, seems simple enough: just a checkbox and a link. The checkbox determines whether SharePoint will periodically collect health information about the members of the farm. The link takes you to a list of timer jobs that collect that information. When you click the Health Logging Schedule link, you’re taken to a page that lists all of the timer jobs that collect this information. You can use this page to disable the timer jobs for any information you don’t want to collect. Again, the more logging you do, the greater the impact on performance. Figure 15-12 shows the health data collection timer jobs.

Clearly, SharePoint collects a vast amount of information. Not only does it monitor SharePoint-related performance, such as the User Profile Service Application Synchronization Job, it also keeps track of the health of non-SharePoint processes, like SQL. It reports SQL blocking queries and DMV (dynamic management view) data. Not only can you disable the timer jobs for information you don’t want to collect, you can also decrease how often they run, to reduce the impact on your servers.
The next section of the Configure web analytics and health data collection page is the log collection schedule, which enables you to configure how frequently the logs are collected from the servers in the farm, and how frequently they are processed and written to the logging database. This lets you control the impact the log collection has on your servers. The default setting collects the logs every 30 minutes, but you can increase that to reduce the load placed on the servers.
The final section of the page displays the SQL instance and database name of the reporting database itself. The default settings use the same SQL instance as the default content database SQL instance, and use the database name WSS_Logging. Although the page recommends using the default settings, there are some pretty good reasons to change its location and settings. Considering the amount of information that can be written to this database, and how frequently that data can be written, it might make sense to move this database to its own SQL server. While reading from and writing to the database won’t directly impact end user performance, the amount of usage this database could see might overwhelm your SQL server, or fill up the drives that also house your other SharePoint databases. If your organization chooses to use the logging database, keep an eye on the disk space that it uses, and the amount of activity it generates. On a test environment with about one month’s worth of use by one user, the logging database grew to over 1GB. This database can get huge. If you need to alter those settings you can do so in Windows PowerShell with the Set-SPUsageApplication cmdlet. The following PowerShell code demonstrates how to change the logging database’s location:
Set-SPUsageApplication -DatabaseServer <Database server name> -DatabaseName
<Database name> [-DatabaseUsername <User name>] [-DatabasePassword <Password>]
[-Verbose]
Specify the name of the SQL server or instance where you would like to host the logging database. You must also specify the database name, even if you want to use the default name, WSS_Logging. If the user running the Set-SPUsageApplication cmdlet is not the owner of the database, provide the username and password of an account that has sufficient permissions. Because this database consists of data aggregated from other locations, you can move it without losing any data. It will simply be repopulated as the collection jobs run.
To get the full list of PowerShell cmdlets that deal with the Usage service, use Get-Command as follows:
get-command -noun spusage*
Consuming the Logging Database
We’ve talked a lot about this logging database, what’s in it, and how to configure it, but we haven’t yet covered how you can enjoy its handiwork. There are many places to consume the information in the logging database. The first place is Central Administration. Under Monitoring Reporting are three reports that use information in the logging database. The first link is View administrative reports. Clicking that link takes you to a document library in Central Administration that contains a few canned administrative reports. Out of the box there are only search reports, as shown in Figure 15-13, but any type of report could be put here. Microsoft could provide these reports, or they can be created by SharePoint administrators.
The documents in this library are simply web pages, so click any of them to see the information they contain. These particular reports are very handy for determining the source of search bottlenecks. This enables you to be proactive in scaling out your search infrastructure. You are able to see how long discrete parts of search take, and then scale out your infrastructure before end users are affected.

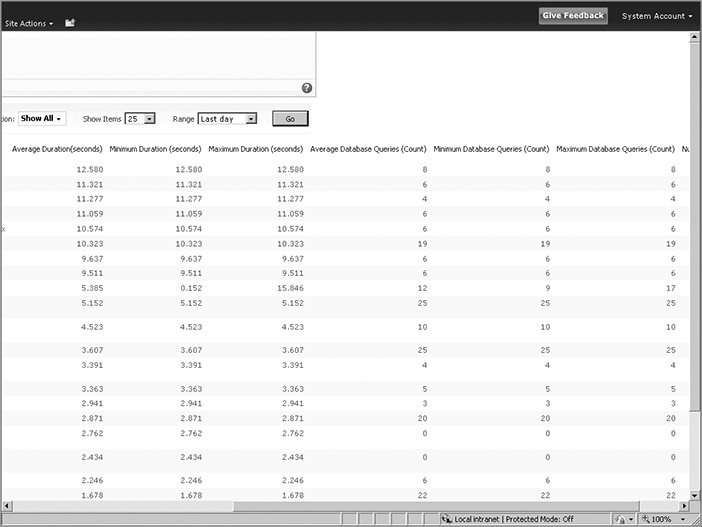
The next set of reports in Central Administration are the health reports. These reports enable you to isolate the slowest pages in your web app, and the most active users per web app. Like the search reports, these reports enable you to proactively diagnose issues in your farm. After viewing details about the slowest pages being rendered, you can take steps to improve their performance. Figure 15-14 shows part of the report. To view a report, click the Go button on the right.
The report shows how long each page takes to load, including minimums, maximums, and averages. This gives you a very convenient way to find your trouble pages. You can also see how many database queries the page makes. This is helpful, as database queries are expensive operations that can slow down a page render. You can drill down to a specific server or web app with this report as well, since the logging database aggregates information from all the servers in your farm. Pick the scope of the report you want and click the Go button. The reports are generated at runtime, so it might take a few seconds for it to appear. After the results appear, you can click a column heading to sort by those values.
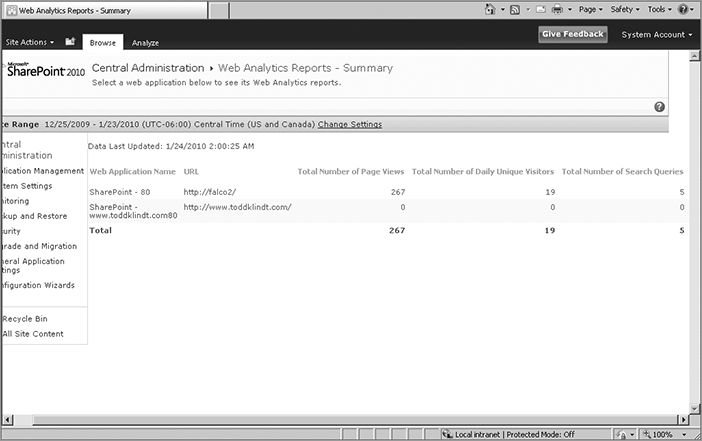
The third and final set of reports in Central Admin that are fed from the logging database are the Web Analytics reports. These reports provide usage information about each of your farm’s web applications, excluding Central Admin. Clicking the View Web Analytics reports link takes you to a summary page listing the web apps in your farm, along with some high-level metrics like total number of page views and total number of daily unique visitors. Figure 15-15 shows the Summary page.
When you click on a web application on the Summary page you’re taken to a Summary page for that web app that provides more detailed usage information. This includes additional metrics for the web app, such as referrers, total number of page views, and the trends for each, as shown in Figure 15-16.

The web app summary report also adds new links on the left. These links enable you to drill further down into each category. Each new report has a graph at the top, with more detailed information at the bottom of the screen. If you want to change the scope of a report, click Analyze in the ribbon. This shows the options you have for the report, including the date ranges included. You can choose one of the date ranges provided or, as shown in Figure 15-17, choose custom dates.

This gives you the flexibility to drill down to the exact date you want. You can also export the report out to a CSV file with the Export to Spreadsheet button. Because this is a CSV file, the graph is not included — only the dates and their values. These options are available for any of the reports after you choose a web app.
As mentioned, the web analytics reports do not include Central Administration. While it’s unlikely that you’ll need such a report, they are available to you. The Central Admin site is simply a highly specialized site collection in its own web app. Because it is a site collection, usage reports are also available for it. To view them, click Site Actions Site Settings. Under Site Administration, click Site web analytics reports. This brings up the same usage reports you just saw at the web app level. You also have the same options in the ribbon, with the exception of being able to export to CSV. Figure 15-18 shows the browser report for Central Admin.

Because these reports are site collection web analytics reports, they are available in all site collections as well as in Central Admin. This is another way to consume the information in the logging database. You can view the usage information for any site collection or web, just open Site Actions Site Settings to get the web analytics links. You have two similar links: Site Web Analytics reports and Site Collection Web Analytics reports. These are the same sets of reports, but at different scopes. The site collection–level reports are for the entire site collection. The Site-level reports provide the same information but at the site (also called web) level. You have a further option of scoping the reports at that particular site, or that site and its subsites. Figure 15-19 shows the options available at the site level.

You may also notice another option that was not available in the Central Administration web analytics reports, the capability to use workflows to schedule alerts or reports. You can use this functionality to have specific reports sent to people at specific intervals, or when specific values are met. This is another way that you can use the logging database and the information it collects to be proactive with your SharePoint farm.
There is one final way to consume the information stored in the logging database: directly from SQL. Although it might feel like you’re doing something wrong, Microsoft supports this method. There are several ways to access data in SQL Server databases, but we’re going to demonstrate how to do it in SQL Server Management Studio with regular SQL queries.
SQL Server Management Studio allows you to run queries against databases. Normally, it’s a very bad thing to touch any of the SharePoint databases; the logging database, mentioned earlier, is the only exception to that rule. Open Management Studio and find the WSS_Logging database. Go ahead and poke around; it’s fine. You’ll notice the large number of tables in the database. Each category of information has 32 tables to partition the data. It’s obvious this database was designed to accommodate a lot of growth. Because of the database partitions, it’s tough to do SELECT statements against them. Fortunately, the database also includes a Views feature that you can use to view the data. Expand the Views node of the database to see which views are defined. Figure 15-20 demonstrates getting the information from the Usage tables. Right-click on the view and click Select Top 1000 Rows.

This shows both the query that is used and the results of that query. You can use this view and the resulting query as a template for any queries you want to design. Remember that if you do happen to do any damage to the logging database, you can simply delete it and SharePoint will re-create it.
Health Analyzer
By now you’ve seen there are a lot of ways for you to keep an eye on SharePoint. What if there were some magical way for SharePoint to watch over itself? What if it could use all that fancy monitoring to see when something bad was going to happen to it and just fix it itself? Welcome to the future. SharePoint 2010 introduces a feature called the Health Analyzer that does just that. The Health Analyzer utilizes Timer Jobs to run rules periodically and check on system metrics that are based on SharePoint best practices. When a rule fails, SharePoint can alert an administrator in Central Administration, or, in some cases, just fix the problem itself. To access all this magic, just select Monitoring Health Analyzer.
Reviewing Problems
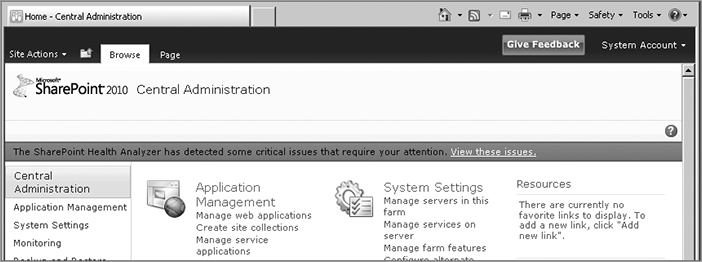
How do you know when the Health Analyzer has detected a problem? You’re probably familiar with the window shown in Figure 15-21. You fire up Central Admin and there’s a red bar running across the top. That’s the Health Analyzer alerting you that there’s a problem in the farm. To review any problems, click the View these issues link on the right.
When you click the link you’re taken to the Review problems and solutions page. (Even if there are no problems, you can get there by clicking Monitoring Review problems and solutions in Central Admin.) This page shows you all the problems that the Health Analyzer found in the farm. Figure 15-22 shows some problems common with a single-server farm.

Clicking any of the issues will bring up the definition of the rule and offer remedies for it. Figure 15-23 shows details about the first problem.

SharePoint provides a summary of the rule. This particular error indicates that one of the app pool accounts is also a local administrator. In most situations this is a security issue, so SharePoint discourages it. SharePoint categorizes this as having a severity level of 1, and therefore an Error. It also tells you this problem is in the Security category. The next section, Explanation, describes what the problem is and to which application pools and services it pertains. The following section, Remedy, points you to the Central Admin page, where you can fix the problem, and an external link to a page with more information about this rule. This is a great addition and gives SharePoint the ability to update the information dynamically. The next two sections indicate which server is affected by the issue, and which service logged the failure. The final section provides a link to view the settings for this rule. You’ll learn more about the rule definitions later in this chapter.
That’s a rather in-depth property page, and it’s packed with even more features. Across the top is a small ribbon that gives you some management options. Starting on the left is the Edit Item button. This lets you alter the values shown on the property page. You could use this to change the error level or category of the rule. It isn’t recommended that you alter these values, but if you do you can keep track of the versions with the next button, Version History. The following button enables you to set an alert if the item changes. You have these options because these rules are simply items in a list, so you have many of the same options you have with regular list items.
You may notice one more button: for each rule you have the option to Reanalyze Now. This lets you fire off any rule without waiting for its scheduled appearance, which is great for ensuring that a problem is fixed once you have addressed it. You won’t have to wait for the next time the rule runs to verify that it has been taken care of.
Some problems are not only reported, but can be fixed in the property page as well. Figure 15-22 showed another problem under the Configuration category. It noted that one or more categories were configured with Verbose trace logging. This configuration issue can contribute to unnecessary disk I/O and drive space usage. The Health Analyzer alerts you when this value is set. This problem is pretty easy to fix; simply set the trace logging level back to its default. For problems like this, SharePoint offers another option, Repair Automatically. Figure 15-24 shows this functionality in action.

Clicking the Repair Automatically button allows SharePoint to fix the problem. Then click the Reanalyze Now button, click Close on the property page, and reload the problem report page. The trace logging problem should no longer be listed. This is almost bliss for the lazy SharePoint administrator.
Rule Definitions
The real power of the Health Analyzer lies in its impressive set of rules. Out of the box, SharePoint 2010 comes with 52 rules. You can see the entire list and details about each rule by clicking Monitoring Health Analyzer Review rule definitions. You will see a screen like the one shown in Figure 15-25.

As you can see, the rules are broken down by category. Figure 15-25 shows three of the categories: Security, Performance, and Configuration. There is a fourth and final category on the second page of rules: Availability. The default view shows several pieces of information about each rule, including the Title, the Schedule of how often it runs, whether it’s Enabled to run, and whether it will Repair Automatically. Wait, Repair Automatically? You read that right; some rules can be configured to automatically repair problems when they find them.
Figure 15-25 shows several rules that by default are set to repair automatically. One example is “Databases used by SharePoint have fragmented indices.” Once a day, SharePoint checks the indices of its databases, and if their fragmentation exceeds a hardcoded threshold, SharePoint will automatically defrag the indices. If the indices are not heavily fragmented, it does nothing. This is a great use of Repair Automatically. It’s an easy task to automate, and there’s no reason it should need to be done manually by an administrator. Some rules, like “Drives are running out of free space,” don’t seem like quite as good candidates for SharePoint to fix by itself. You don’t want it deleting all those copies of your resume, or your Grandma’s secret chocolate-chip cookie recipe.
If you want to change the settings of any of the rules, including whether it Repairs Automatically or not, simply click the rule title, or click the rule’s line and select Edit Item in the ribbon. Here you can enable or disable whether a rule will run or not. In the single-server environment shown, it would make sense to disable the rule that reported databases on the SharePoint server. It’s nothing that can be fixed, so getting alerts about it does you no good. You could also choose to change how often a rule is run, but it is not a best practice to change the details of a rule other than enabling the rule and Repair Automatically.
Finally, because the rules are simply items in a list, the rules list is extensible. More rules can be added later by Microsoft or third parties.
Timer Jobs
Timer jobs are one of the great unsung heroes of SharePoint. They have been around for several versions of SharePoint, and they get better with each version. Timer jobs are the workhorses of SharePoint. Most configuration changes are pushed out to the farm members with timer jobs. Recurring tasks like Incoming E-Mail also leverage timer jobs. In SharePoint 2010, timer jobs have been given another round of improvements. A lot of the functionality covered in this chapter relies on timer jobs, so you have seen some of those improvements already. This section drills down a little deeper into how timer jobs have improved.
Timer Job Management
When you enter Central Admin it is not immediately obvious that timer jobs have gotten such a shiny new coat of paint. They have links to essentially the same two items in SharePoint 2010 that they do in SharePoint 2007: job status and job definition. In SharePoint 2010 the timer job links are under the Monitoring section, as there no longer is an Operations tab. Figure 15-26 shows their new home.

Let’s start our tour of the new timer job features by looking at the timer job definitions. Again, this page is largely unchanged from its SharePoint 2007 counterpart. You get a list of the timer jobs, the web application they will run on, and their schedule. You can also change the jobs that are shown by filtering the list with the View drop-down in the upper right-hand corner. Figure 15-27 shows the Job Definitions screen.

Again, not a huge improvement over the timer job definition management provided in SharePoint 2007. To really see what’s new, click one of the timer job definitions. Hopefully you’re sitting down, because otherwise the new timer definition page, shown in Figure 15-28, might knock you over.
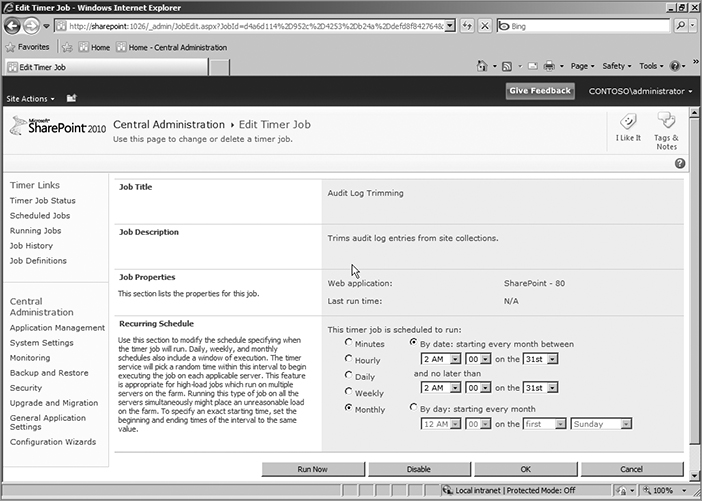
It includes all of the same information provided in SharePoint 2007, including the general information on the job definitions screen and the buttons to disable the timer job. However, there are two new, very exciting features. First, you can change the timer job schedule in this screen. In SharePoint 2007 you need to use code to do this. This gives you a lot of flexibility to move timer jobs around if your farm load requires it. That’s a great feature, but it’s not the best addition.
The best addition to this page, and arguably to timer jobs in SharePoint 2010, is the button on the lower right, Run Now. You now have the capability to run almost any timer job at will. This means no more waiting for the timer job’s scheduled interval to elapse before knowing if something you fixed is working. This is the same feature that enables the Health Monitoring discussed earlier in the chapter to fix issues and reanalyze problems. You are no longer bound by the chains of timer job schedules. You are free to run timer jobs whenever you want. That alone is worth the cost of admission.
Timer Job Status
The other link related to timer jobs in Central Admin is Check job status. This serves the same purpose as its SharePoint 2007 counterpart. However, like the timer job definitions, it has gotten a new coat of paint. Figure 15-29 shows the new Timer Job Status page. Like the SharePoint 2007 version, it shows you the timer jobs that have completed, when they ran, and whether they were successful or not.

SharePoint 2010 takes it a step further. Notice that the Succeeded status is now a hyperlink. Simply click this link to get more information. Figure 15-30 shows the full Job History page, with a job highlighted. You can also get to this page by clicking Job History in the left navigation pane.

Figure 15-30 also shows another great addition, the capability to filter and view only the failed jobs. That helps with troubleshooting, as you can see all the failures on one page, without all those pesky successes getting in the way. To take it a step further, you can click on a failure and get information about why that particular timer job failed, as shown in Figure 15-31.

In this case, the Health Statistics timer job failed because of a timeout issue. Now you have some real information to use to get to the bottom of the problem.
The Timer Job Status page serves as a dashboard. You’ve already seen how it shows the timer job history, but it also shows the timer jobs that are scheduled to run, as well as the timer jobs that are currently running. Refer back to Figures 15-29 and 15-30; Figure 15-29 shows all three sections with scheduled jobs on the top followed by running jobs and finally the timer job history. If you want more complete information on any of these sections you can click the appropriate link on the left under Timer Links. This gives you a page dedicated to each section. Figure 15-30 is an example of the history page. Figure 15-32 shows the running timer jobs in the Timer Job Status page. Along with showing the timer jobs that are running, you can also see the progress of each job, complete with a progress bar. If you have many jobs running at once, you can click Running Jobs in the left navigation pane to access a page dedicated to reporting the timer jobs that are currently running.

Here’s one final timer job improvement: SharePoint 2010 introduces the capability to assign a preferred server for the timer jobs running against a specific content database. Figure 15-33 shows how it is configured in Central Admin.

This setting is set per content database, so it is set on the Manage Content Database Settings page (go to Central Administration Application Management Manage Content Databases). Being able to set a particular server to run the database’s timer jobs serves two purposes. From a troubleshooting standpoint, you can use this to isolate failures to a single box, if you’re having trouble with a specific timer job or content database. You can also use this to move the burden of timer jobs to a specific server. This server could be one that is not used to service end user requests, so having it be responsible for timer jobs will allow another scaling option.
Again, you can take your administrative experience to the next level with Windows PowerShell. There are five cmdlets that ship with SharePoint that deal with timer jobs. To discover them use Get-Command:
PS C:> Get-Command -noun SPTimerJob
You can use PowerShell to list all of your timer jobs using Get-SPTimerJob, and then choose to run one with Start-SPTimerJob.
The monitoring capabilities in SharePoint got a serious shot in the arm with SharePoint 2010. The trace logs now take up less space, but somehow also hold more helpful information. The interface for configuring them has also been drastically improved. You also now have a database that is dedicated to logging and reports, and you can access it with Microsoft’s blessing. The software has also become more self-sufficient. Not only can it monitor itself and let you know when there are problems, it can also fix some problems on its own. A wide variety of reports keep an eye on various aspects of the server, enabling you to proactively monitor it. Finally, even timer jobs have been improved. You can now run them at will, and you have much better diagnostic tools to watch over them. In short, the monitoring experience in SharePoint 2010 is much improved over earlier versions.