
Reporting, Predictive Analytics, and Everything in Between
Business managers (or anyone) who are either contemplating or planning a data analytics initiative face a bewildering array of options. These range from deciding among different analytics platforms, to reporting systems, to determining how to deploy analytic components in streaming and embedded systems. A manager who has little technical expertise needs guidance not only in what to select, but, more important, what to consider when making data analytics decisions. Even a technically oriented manager, one with expertise in data and computer systems, needs guidance because the options are fluid and constantly being developed and expanded. Keeping abreast of analytic developments is difficult even for them.
Both groups—those with little technical expertise and those who have some—need help understanding their options. Typical questions include the following:
-
What are the features and characteristics of the different analytical options?
-
Why does the business need this capability and what will be the expected business outcomes from using it?
-
What are key considerations, requirements, and capabilities that must be addressed?
-
Are there any example use cases?
This report offers both types of business managers a nontechnical overview of the essential elements they need to consider before embarking on a data analytics initiative. That along with the five aforementioned questions form the basis for this overview.
The report is divided into three main sections covering the following topics:
-
Insights needs, to motivate the need for data analytics
-
Analytical needs, outlining key options
-
Analytical enhancers, to expand the capabilities discussed
Insights Needs: Getting the Right Information for Your Decisions
Business managers make decisions all the time that affect every aspect of their business: operations, production, personnel, marketing, and finance. Some decisions are purely day-to-day operational ones, some are tactical responses to competitive market moves, and still others are long-term strategic decisions. They all affect the returns to stakeholders for which the managers are responsible—returns that could determine whether the business is able to raise new capital in the stock market or acquire new donors and contributors to finance its operations and new product development efforts. In short, all of these decisions are critical.
The basis for these critical decisions—what the business decision makers and the management team must have—are insights. Business managers cannot make these decisions in a vacuum. But where do these insights come from? The first two sections of this report shed light on the only true source of insights: data. Data, however, must be analyzed and presented in meaningful ways in order to yield the required insights. We discuss how the data should be processed throughout this report.
The Data Analytics Pathway to Insights
Business decisions are tactical and strategic at the same time. How should management respond to a competitor’s price change, for example. Or, what should management do if during a new product’s introduction there’s a sudden break in the supply chain of a key manufacturing input? How should the business respond to a change in technology projected to have major market disruption implications in the next year? What new products and new markets should be developed? What new businesses should you explore?
The decisions are all based on information about markets, competitors, customer preferences, technology trends, and much more, and these insights come from one source, and one source only: data. As W. Deming said, “In God we trust. All others bring data.”
Businesses are awash in data that come from numerous and diverse internal and external sources, including manufacturing processes, supply chain pipelines, online and traditional transactions, sensors, social media, company and product reviews, government and trade association reports, and so on. All of this data also comes in different forms such as text, images, audio, videos and, of course, numbers. Management’s problem is how to extract from all this data the actionable, insightful, and useful information it needs (or its customers need) for their many and varied decisions—decisions that are often made in real time, on the spot when an issue arises, and that are frequently mission critical.
Businesses must ultimately compete on data, and the pathway into the data is analytics. Analytics has three components:
- Data exploration and visual analytics
-
For identifying new insights and unseen problems and issues
- Data science and machine learning
-
To model and predict potential outcomes from the business’s and the markets’ actions
- Reporting
-
For distributing information to help stakeholders so that optimal decisions can be made
While either embarking on a new data analytics endeavor or expanding or enhancing an existing one that is outdated and insufficient for changing environments, how does management maneuver through all of the issues and complexities that encompass data analytics? You need to know what to consider and understand how the pieces fit together to produce the right insights for intelligent business decisions.
Choosing Your Data Analytics
Deciding between data exploration and visual analytics, data science and machine learning, and reporting is complex enough. Combining them into a unified whole can become an overwhelming challenge. What questions should you ask and what answers will help guide you to the right choice?
The Analytics Spectrum shown in Figure 1-1 is a series of questions with guiding answers for you to consider that can help you decide what you need for your business.

Figure 1-1. The Analytics Spectrum
The next section explores the three categories of the Analytics Spectrum.
Analytics Needs: Identifying the Right Analytics for You
The three analytical components introduced in the previous section—data exploration and visual analytics, data science and machine learning, and reporting—are used to address business problems, from the simplest to the most complex. You can use each independently, but their real power for aiding decision making comes when you use them together to identify issues, predict likely outcomes from both the problem and its solution, and inform stakeholders of situations and possibilities.
The following subsections discuss these three components by addressing the following questions:
-
What are some of the problems that each one addresses?
-
What can you expect from each?
-
What are some guidelines for selecting the right component(s)?
-
What would be an example use case for each?
Discover: Data Exploration and Visual Analytics
Today, nearly all businesses collect huge amounts of data on their customers, markets, suppliers, production processes, and more. Data flows in from online and traditional transactions systems, sensors, social media, mobile devices, and other diverse sources. As a result, decision makers are drowning in data but starving for insights. Data is just “stuff” that is collected. Insights are hidden within that data, buried, waiting to become useful for making a business more efficient and profitable. Such insight discovery is the job of business data analysts who use sophisticated tools and methodologies for digging into this data.
Data exploration and visual analytics is one approach that business data analysts use to uncover and investigate hidden but potentially actionable and useful insights in data. It is a methodology, almost a philosophy, for digging into data looking for interesting relationships, trends, patterns, and anomalies requiring further exploration. Exploration and visual analytics enables the use of technology-assisted analytical and pattern recognition software for visualization and drill-downs to turn data into knowledge and understanding. This makes business users and analysts knowledge workers.
Business problems it solves
As knowledge workers, business users and analysts are tasked with discovering insights in the massive amounts of data that businesses collect. These insights can include identifying customer problems such as the following:
-
Unexpected customer churn
-
Customer relationship and management problems
-
Subtle product issues such as returns and failures
-
Price leakages due to excessive discounting
-
Promotional failures
-
Lost market share due to competitive actions such as aggressive pricing or a new product
Undetected and unaddressed, these problems can seriously undermine any business. Hence the task, the urgency, to find something—anything—in the data and take action.
Why you need it: expected business outcomes
There are two scenarios for the knowledge workers’ tasks:
- Undirected exploration
-
Analysts are given vague or no guidance: no business problem or set of business questions. They are left on their own to use their own devices, imagination, and experience to “just discover something.” Consequently, they randomly explore, looking for anything, from potential product delays to spikes in returned orders to manufacturing slowdowns. They are free to formulate a conjecture given the lack of upper-level management guidance. Their data exploration is still based on an understanding and knowledge of the business, its problems, strategies, and market climate, all of which act as guides and impose biases and limitations on what is done.
- Directed exploration
-
In this scenario, analysts have a clearly defined task given to them, such as to confirm or disprove an idea or address a specific problem. For example, the task might be to predict the effect on sales of a new promotional campaign or a competitive price action.
In either case, business users and analysts begin by becoming “data detectives” who survey existing complex, diverse, and sometimes legacy data systems (which can be siloed at different locations in the enterprise). They wrangle the data into a useful form and dig deep to locate potential trends and patterns for insight into problems, whether clearly defined or not. With the flood of data produced by modern businesses, they must do all of this in real time to avoid their data becoming stale and outdated soon after it is collected. Time pressures are high, and processes are complex.
Visual Data Discovery (VDD) plays a vital role in enabling knowledge workers, regardless of background and skill level, to be not just data detectives but knowledge seekers. They seek insight from data by visually and interactively drilling down in real time using interactive charts and images (see Figure 1-2) to examine data for insights into conjectures and problems, regardless of whether they are ill defined or well-articulated. VDD gives analysts the tools that enable them to blend datasets for the seamless and effortless exploration of data.
VDD offers knowledge workers the power of self-service discovery, finding patterns and relationships using their own ingenuity, with a deep set of diagnostic analytic capabilities freeing them to investigate potential relationships across a variety of structured and unstructured data sources. Coupled with the rise and advancement of self-service data preparation technology and technology-assisted analysis and pattern-detection platforms, VDD is now more relevant than ever for dealing with complex and disparate real-time data sources.

Figure 1-2. With Visual Data Discovery, business users are free to explore data for trends and insights to drive better decisions
The result of VDD is an agile, flexible, and scalable analytics deployment across the enterprise allowing for autonomous analytics for all knowledge workers. VDD tools are agile because of the high interactivity they provide and the resulting speed for identifying and addressing problems. Using VDD, knowledge workers can dynamically interact with visual images of their data, exploring different views for greater insight with little effort and, often, minimal technical training. Knowledge of the business and its driving problems surpass technical knowledge for analyzing data because technology-assisted analysis and pattern detection platforms will guide them to what is important.
The ability to visually interact with data in a self-service environment is fast becoming a vital element for business success. VDD is no longer an analytical convenience; it is a strategic necessity. It enables a flexible analytics deployment across the enterprise because it can handle any type of data from data warehouses, data stores, departmental data marts, and external data sources, as well as structured and unstructured data. The source and type are immaterial. The visualization tools are powerful enough to handle small as well as large quantities of data so that they can easily scale up to big data and cover the entire enterprise.
Key considerations, requirements, and capabilities
Self-service discovery must take into account the time these knowledge workers allocate to these tasks; that is, time that cannot be used on other tasks. There are, after all, only 24 hours in a day. This means that a VDD system must be very efficient and intuitive to use so that analysts can quickly, seamlessly, and effortlessly discover information and insight.
Which knowledge workers would use VDD tools? Business analysts, marketing directors, customer service managers, sales leaders and so forth with a good understanding of their domain, including business models, challenges, opportunities, risks, typical data, and processes. They are responsible for exploring data and generating insights.
All knowledge workers must be multifaceted and have an understanding of the business domain including its problems, strategies, structure, and market position. They must also understand the data collected including their source, structure, and issues.
Organizations have a greater likelihood of realizing the full benefits of VDD if they already exhibit a data-driven culture and follow best practices for technology that support the following:
-
Data analysis workflow
-
Data access, data management, data preparation, ease of use for dashboard creation, interactive visual exploration
-
-
Advanced analytics capabilities
-
Geoanalytics, predictive analytics
-
Scalability for complex analysis
-
-
Publishing, sharing, governance
Example: An Airline1
For its customers for prediction and proactive customer support, a well-known US-based airline needed a 360-degree view; a single end-to-end view of the entire customer relationship and interaction, the whole customer experience. This represents a strategic approach to customer relationship management (CRM) that emphasizes all aspects of customer interactions to derive the right level of service, at the right time, and for the right customer by proactively identifying issues and problems before they become major business handicaps.
At the airline, data silos throughout the enterprise were preventing its knowledge workers from accessing data about its customers, especially their travel experiences, and responding to needs before they become service issues. These problems could include lost reservations, delayed flights without notifications, no point-of-contact information in case of problems, inability to speak to a customer representative, and so on, cutting across all divisions of the airline’s operations—the 360-degree view it could not achieve.
By employing the practice of VDD, the airline implemented an integrated platform for intelligence and information sharing that alleviated this problem. An easy-to-use VDD analytical tool enabled more than 20,000 front-line employees and decision makers to access dashboards and visualized data across many disparate sources encompassing the entire customer experience, thus knocking down the data silos. They were able to identify and assess issues and problems by monitoring trend intelligence. They were able to make proposals, adjustments, and changes to benefit their customers’ travel experience. The airline is in the process of developing executive visual dashboards to further enhance their customers’ experience and improve their strategic market position as a leading airline carrier.
Predict: Data Science and Machine Learning
As mentioned in the previous section, VDD is one way to explore and discover insights in data. VDD gives knowledge workers free rein to try most anything, although at some point something more powerful is required. Businesses need to penetrate their data for deeper insights, such as understanding complex interactions and relationships. They need to be able to discern real and important discoveries. Real discoveries contain rich insights with strategic implications; focusing on less important matters can mislead decision makers, resulting in possible strategic blunders. This is where data science and machine learning enter the picture.
Data science and machine learning are separate yet interconnected, multidisciplinary approaches to using data to gain rich and powerful insight into business problems and their solutions. Machine learning is a combination of statistics and computer science that is used to create models by processing data with algorithms. These models can recognize trends and patterns in data that are generally deeper in sophistication than just VDD methods alone. Using data from diverse sources (for example, the Internet of Things (IoT), sensors, social media, and an array of devices), machine learning processes that data through sophisticated algorithms and builds models for identifying and solving a problem and making predictions.
A model could be as simple as describing the impact on one component of manufacturing (for example, “If material supplies delivery are delayed one hour, shipments of final products are delayed one week”). It could also be something more complex, involving multiple impacts due to multiple concurrent issues. Machine learning can wade through troves of data and take into account complex interactions to create models that human knowledge workers cannot accomplish. Machine data is therefore commonly used for images, video, and audio analysis.
Data science is a more encompassing concept, combining statistics, computer science, and application-specific domain knowledge to solve a problem.2 In a business setting, it combines machine learning methods with business data, processes, and domain expertise to solve a business problem. Basically, it provides predictive insights to decision makers.
Figure 1-3 demonstrates a data science workflow that is used to create a credit scoring model.

Figure 1-3. Data science workflow used for credit scoring
Business problems it solves
Data science and machine learning are used across industries and functional areas within businesses. Here are some examples:
-
Anomaly detection
-
IoT and engineering
-
Energy: production surveillance, drilling optimization
-
Predictive maintenance
-
Manufacturing: yield optimization
-
-
Financial services
-
Trade surveillance
-
Fraud detection
-
Identity theft
-
Account and transaction anomalies
-
-
Healthcare and pharmaceutical
-
Patient risk assessment: cardiac arrest, sepsis, surgery infection
-
Patient vital signs monitoring
-
Medication tracking
-
-
Customer analytics
-
Customer Relationship Management: churn analysis and prevention
-
Marketing: cross-sell, up-sell
-
Pricing: leakage monitoring, promotional effects tracking, competitive price responses
-
Fulfillment: management and pipeline tracking
-
Competitive monitoring
-
Figure 1-4 shows an insurance application driven by data science and machine learning under the hood.

Figure 1-4. An application using data science and machine learning to dynamically set prices within the insurance industry
Why you need it: expected business outcomes
We can embed a model to predict a likely outcome or provide an optimized solution to changes in process parameters directly within business processes. A model provides a competitive advantage because it does the following:
-
Enhances capabilities
-
Speeds decision making
-
Processes large amounts of disparate data types
-
Generally lowers the costs of operations
-
Generates new revenue streams
-
Leads to differentiated products and service offerings
This embedding of a predictive model in business processes is the joint goal of data science and machine learning.
Key considerations, requirements, and capabilities
Implementing the data science and machine learning component requires management support and organizational buy-in.
Many organizations struggle to realize the value of data science and machine learning due to many challenges. However, the #1 challenge that organizations face is operationalizing data science and machine learning workflows. All too often, data scientists are focused on the math; however, data science and machine learning is much more than the math. To realize the full value of data science, organizations need to embed data science and machine learning workflows into business processes and have a mechanism to monitor, manage, maintain, and refresh them over time. This includes activities for the following:
-
Supporting the end-to-end machine learning process including:
-
Data acquisition and preparation
-
Model build and selection
-
Model deployment
-
Embedding results in business processes
-
Model monitoring, automatic refresh, and governance
-
-
Automation of key process steps
-
Collaboration across different project teams
-
Flexibility, extensibility, and integration with open source software
Implementing a data science and machine learning function also requires the appropriate level and degree of analytical talent to appropriately use, interpret, and report the results of modeling efforts so that management can make the correct decisions. The talent must be conversant in statistical and machine learning methodologies and programming languages.
Example: University of Iowa Hospitals and Clinics3
Surgical site infections (SSIs) are a major health care issue affecting morbidity and hospital readmissions. SSIs add more than $20,000 per infection to overall health care costs in the United States. The University of Iowa Hospitals and Clinics, a comprehensive academic medical and regional referral center, needed to handle the costs and implications of SSIs but faced an issue common to most large businesses: disparate data sources, an inability of key analytical teams to access and share data to collaborate on major hospital issues, and an inability to quickly analyze the data they did have.
The hospital management team established the objective of having real-time predictions of the risk of infection prior to and during surgery to minimize the chance of SSI. To meet this objective, the hospital wanted a data science platform to streamline its analytical process, from data aggregation and preparation, predictive model development, model and results deployment, to model monitoring.
A data science platform was used to train and deploy a machine learning model (naive Bayes and support vector machines) that would predict a patient’s risk of SSI in real time while they were in the surgical theater. Training data included variables from the Electronic Medical Record, patient history (for example, age, sex, ethnicity), and surgical data (such as surgical apgar score, preoperative hemoglobin, estimated blood loss). If the risk was deemed too high, the surgical team would take action during the surgery and would apply a technique called negative wound therapy that would drastically reduce the risk of an SSI.
The hospital was able to reduce SSI by 58%, increase provider satisfaction, and increase provider engagement in quality improvement efforts. This resulted in a $2.2 million cost reduction for the hospital for every 300 surgeries.
Present: Reporting
Known facts and uncovered rich information that are real discoveries must be communicated to those in an organization, its customers, and specialized stakeholders such as the board of directors, investors, legal counselors, and regulators needing that information. Failure to communicate findings is equivalent to keeping data in silos—they do no one any good.
Reporting is the practice of collecting, formatting, and distributing rich information in a readily digestible and understandable fashion. It is the final step in an analytical process focused on presenting information to support decision making. As such, it is a “presentation layer” for data analytics designed to be consumed, not analyzed, by the target audience.
These outputs take the form of reports and dashboards. Dashboards are a combination of one or more data visualizations, text, images, and other elements used to communicate information. Reports contain the same elements but sometimes they also contain text for summaries, conclusions, and recommendations, so they are more encompassing and comprehensive. Although reports and dashboards have surprisingly few functional differences, they are often used for different purposes. Table 1-1 presents a comparison.
| Characteristics | Reports | Dashboards |
|---|---|---|
| Interactivity | Supported | Supported |
| Drill down | Supported | Supported |
| Display | Supports pagination | Single page view |
| Used for | Informational work | Visualizing and exploring Key Performance Indicators (KPIs) |
| Content often contains | Text summaries, charts, graphs, images | Charts, graphs, images |
| Real-time information | Not supported | Supported |
| Best at | Telling a story | Allowing users to form a story |
| Focus is on | What happened or what will happen (that is, predictions or forecasts) | What happened is currently happening, or what will happen (that is, predictions or forecasts) |
Although several differences exist, reports and dashboards are categorized together due to their common trait of providing information about “known knowns”; that is, information pertaining to a previously established topic or area. Reporting provides fresh information to questions needing to be answered on a regular basis by the business or its customers.
Reporting is primarily a form of centralized analytics because it is designed to distribute information from a single, central source. This model is well suited for situations in which the distributing source wants to create a narrative from the data or control how the information presented is interpreted (for example, annual financial statements). However, this centralized model does not cater very well to users with unique questions that are not answered in the regular reports and dashboards.
Self-service reporting provides a solution to this by giving business users direct access to data so that they can build reports on their own. Although this is helpful for certain scenarios, self-service reporting is often limited to gentle manipulation of data (such as filtering, sorting, and grouping). The time constraints mentioned in the section “Discover: Data Exploration and Visual Analytics” still hold, so a self-service reporting system must be intuitive, flexible, and easy to use.
Reporting is often described as representing information about “what happened.” This is a familiar and common use case, but reporting is not confined to this definition. Reporting is increasingly used to distribute insights found in more advanced analyses such as forecasts and predictions. As a simple illustration, imagine receiving a “projected spendings report,” which estimates spending for the upcoming month, instead of a “spendings report” that shows historical spending for the previous month. This is why reporting should be viewed as a means to distribute information, broadly speaking, rather than as just a mirror into the past.
Business problems it solves
Employees and customers need access to relevant, rich information to support decision making. Reporting provides a curated, consumable view of information designed to help users answer a particular question or set of questions. Common examples include the following:
-
Financial statements (annual report)
-
Invoices (credit card or cell phone bill)
-
Tickets (airplane, train, sporting/concert event)
-
KPIs
-
Regulatory and legal reports and filings
-
Logging/activity tracking (machine monitoring in a factory, operational app data)
Why you need it: expected business outcomes
Reporting is needed to drive informed decision making because without it no one would have a common base of knowledge. Reports are that base and as such, they empower employees and customers by giving them insights in readily understandable and accessible formats. This builds confidence among employees and customers because they will feel they “know” what is happening in the business and are not excluded. They can ask intelligible questions and challenge decisions, thus strengthening the business. The reports are a source of truth that leads to more consistent decision making. But they also control the conclusions the audience derives by presenting them with a curated, formatted view of information.
Key considerations, requirements, and capabilities
Implementing a reporting solution requires a deep understanding of the data architecture within an organization or application that is to support the desired business outcomes. Reporting projects are generally led by IT or product & development groups who have the technical skills to not only query data, but can also employ methods to optimize report generation speed, such as setting up caching layers, aggregating datasets, and even building a data warehouse.
Other important considerations include choosing a solution that offers the following:
-
Flexible data connectivity via out-of-the-box data connectors as well as the ability to connect to custom data sources (if you don’t need this now, you might later).
-
Support for popular visualizations, including built-in choices for modern visualizations and support for third-party charting libraries like D3.js.
-
Useable APIs with supporting clients ranging from low-powered mobile and IoT devices to high-performance workstations requiring easy-to-use APIs. Forward-thinking REST APIs also enhance data flexibility and feature synchronous and asynchronous report generation and scheduling APIs.
-
Embeddable and extensible tools available as embeddable libraries give developers the freedom to craft custom reporting solutions. An extensible architecture provides some future proofing and the ability to fill gaps. JavaScript embeddable APIs facilitate putting reports into web apps and pluggable, extensible SDKs.
-
Pricing and architecture built for scale. Just as reporting has escaped the boardroom, licensing must do likewise and scale to audiences of users from, thousands to millions, with horizontal scaling options through load balancing, but without being constrained by per user pricing.
Example: Illuminate Education4
Illuminate Education is a web-based company that provides tools to help K–12 school districts and their principals, teachers, parents/guardians, and students make data-informed decisions that positively affect student academic success.
The company had an issue common to many software companies and enterprises: how do you present data in a way that is easy to understand to a group of stakeholders who are not data-savvy people? And equally as important: how do you manage the distribution process for large groups of individuals or customers? With a massive and diverse base of customers, all requiring their own personalized reports, this was a particularly difficult task for Illuminate Education.
Types of data provided in Illuminate Education reports included attendance, behavior, health, state testing scores, skills assessment, and college and career readiness.
Educational reporting is a highly competitive industry, and Illuminate Education was concerned about losing its competitive position. Its problem was providing timely reports on test scores and daily attendance to a diverse client base that included school districts, principals, teachers, parents/guardians, and students. At the time, all of its reports were handcoded, a time-consuming and inflexible process.
Illuminate Education implemented a reporting and data visualization platform in its operations. This allowed Illuminate Education to create pixel-perfect reports that could meet specific formatting requirements. It also gave them the ability to apply the advanced query methods needed to make the data consumable to their broad audience.
To make these insights more actionable, Illuminate Education embedded its reports in its existing software applications and tools, giving users convenient access to this helpful information in the right context. Figure 1-5 presents a sample report.
The result is that Illuminate Education now supports 1,600 school districts, ranging from small to large ones and including public, private, and charter schools, covering six million students. This solution has given the company a competitive edge that differentiates it in the education market space.
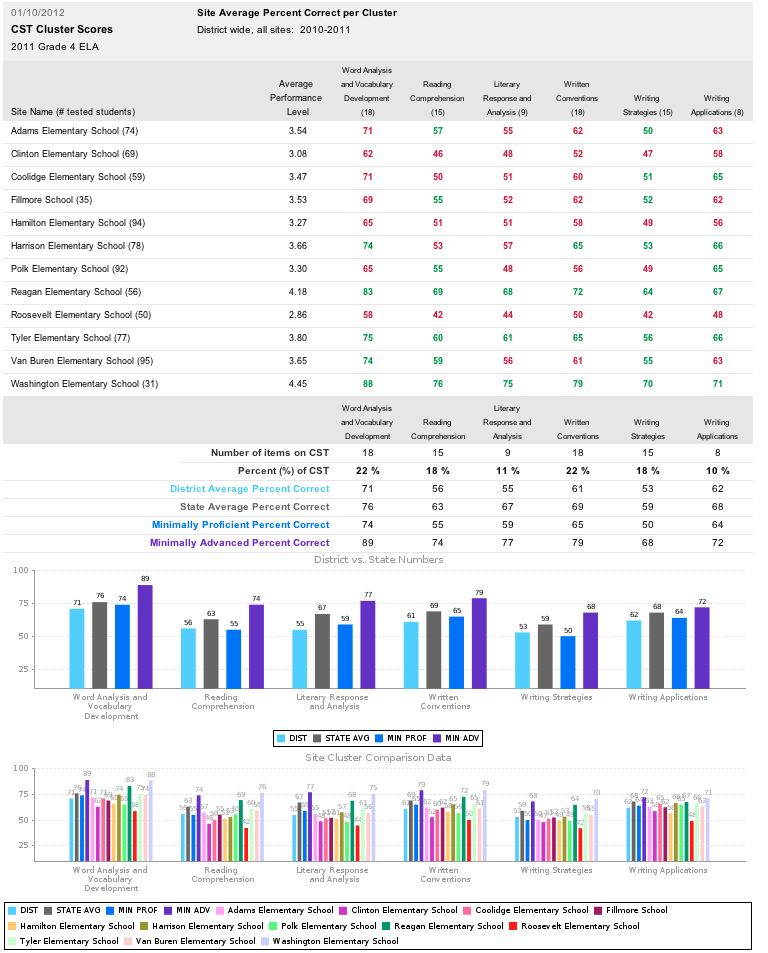
Figure 1-5. Sample Illuminate Education report
Analytics Enhancers: Extending Analytics with Context and Speed
On their own, the three analytical components discussed so far in this report—data exploration and visual analytics, data science and machine learning, and reporting—offer valuable ways to address business problems. But the real value of these analytic tools extends far beyond what is possible with each used in isolation. You can apply special enhancers to these analytic components to improve and expand what they can do. Used appropriately, these enhancers can turn a simple analytics project into a value-generating investment, becoming the “secret sauce” or edge needed to win against competition.
This section covers two such enhancers: embedded analytics and streaming analytics. The decision of which one to implement is determined by the specific business needs and situations.
Providing Insights in Context with Embedded Analytics
Rather than make analytics a new but separate destination for a business to visit, which creates a gap between insights and the ability to take action on those insights, embedding analytics into existing operational applications and processes brings insights to the user and provides them with the answers they need, in the environment where those users are already taking action.
Embedded analytics is the most effective way to bridge the “insights to action” gap. It is the incorporation of data analytical methods in business applications and systems to enable business managers, operational workers, and executives to gain more detailed and richer actionable, insightful, and useful information when they need or want it—and how they want it. It lets them delve into their data, asking their own questions and answering them as they determine is necessary. Most important, it allows them to take speedy and timely action because the analytical capabilities are embedded in their mission-critical operational systems.
You can embed each of the analytics types discussed so far to serve different use cases.
Embedded data exploration and visual analytics
Embedding data exploration and visual analytics into applications and business processes gives users the ability to seek answers to questions on their own without the need to use a separate analytics tool. It gives them an in-app self-service analysis environment for analyzing data and extracting information related to their unique or custom questions.
It is well suited for the following:
-
Adding value to applications requiring frequent ad hoc analyses and prompt diverse types of questions from users
-
Reducing the time application developers spend fulfilling custom analytics requests
-
Empowering decision makers to ask questions and seek more information
Embedded data science and machine learning
Embedding data science and machine learning into general business applications helps organizations realize the value and power of these two tools. Operationalizing them by embedding their algorithms directly into mission-critical business processes reduces costs and increases efficiency through faster on-target decision making. It gives business users the ability to “see into the future,” allowing them to take speedier and well-informed actions, thus giving the business a competitive advantage.
Embedding algorithms into business processes is particularly well suited for the following:
-
Systematic business operations involving data for repeatable decisions (for example, credit and loan decisions)
-
Augmenting human expertise (such as health care diagnosis)
-
Enabling anomalous identification in a mass of complex data (as in fraud detection)
-
Identifying and extrapolating trends
Embedded reporting
Embedding reports and dashboards into an application allows users to consume information related to the app and take data-driven action without changing context. Most business users do not want to use an “analytics tool” with yet another interface to learn and another login. They just want easily accessible answers with little time-consuming effort. Instead of offering a standalone report or dashboard, embedded reporting brings those insights into applications already used every day. Figure 1-6 depicts an embedded report.

Figure 1-6. Education application with embedded reporting used by teachers to track performance and deliver tailored coursework to students in grades K–8
Embedded reporting is particularly well suited for the following:
-
Presenting information visually and in context to application users
-
Providing information to common questions users ask
-
Improving customer satisfaction and making a product/service more competitive
-
Increasing adoption of BI/data-driven decision making
-
Reducing the time application developers spend fulfilling custom report requests
Analyzing on the Fly Using Streaming Analytics
Data is now collected at real-time rates through data collection devices such as sensors, continually adding to the sheer volume of historical data businesses already have in their data lakes, data warehouses, data stores, and data marts. The volume that must be managed and analyzed increases operating costs and stifles decision making. Examples of real-time data collected by sensors abound. They routinely do the following:
-
Collect medical diagnostic data on patients in health care facilities
-
Monitor energy consumption by electric utility, gas, and water consumers
-
Track agricultural fields and livestock
-
Monitor city traffic patterns and control traffic signals
-
Monitor production processes, especially robotic ones
-
Track stock prices
-
Monitor light-rail and long-distance rail systems
The real-time nature of this data implies that analysts and managers can now monitor systems and take corrective actions almost simultaneously with the occurrence of a problem. However, remember that they need to be able to distinguish between a problem that is real and one that is not. The historical data, which the real-time data continuously adds to, gives context and meaning to any messages from the real-time data; they work together to provide insight and so cannot be separately analyzed. The context could be in the form of trends, and the real-time message could be a sudden, unexpected increase over trend. This blending of where the system is “generally heading” (that is, the trend) with “what is happening now” could indicate a potential problem ahead that needs to be averted now.
Streaming analytics can handle real-time data coupled with historical data to provide a sense of urgency and call-to-action. The monitoring of a patient’s heart rate is a perfect example: a real-time increase in the heart rate above the patient’s normal rate could indicate a severe heart problem that must be dealt with very quickly. Adding a predictive model would assess their risk, and adding a prescriptive model would give a recommendation on what to do—call a doctor or go to the ER. In this case, decision makers do not have time to wait days or even hours for reports indicating a problem exists and that action is needed. Streaming analytics would enable them to immediately identify the problem and take action on the spot.
Business managers are increasingly expected to make their decisions using the freshest and latest insights from data. This is particularly true for the following:
-
Industries such as oil drilling where a few seconds of incorrect decision making—for example, failing to correct the path of the drill—can have immense financial and ecological consequences
-
High-volume production facilities where down-time would jeopardize down-stream operations
-
Medical diagnostic areas where a patient’s well-being and even survival might be at risk
-
Defense, security, and disaster alert organizations for which the safety of massive numbers of people might be in jeopardy
Historically, real-time streaming analytics was thought to be primarily applicable for operational decisions. However, it also can improve the quality of tactical and strategic decisions by enabling Agile decision models. Decision makers can take advantage of fine-grained transaction data rather than working on aggregates. End users can harness increasingly sophisticated analytic capabilities through packaged real-time analytics embedded into data discovery tools and applications without prohibitive processing wait times or the need for developers to intervene.
Streaming analytics is well-suited for situations requiring more precise and urgent decisions than those possible with stale data or no data. The results include the following:
-
More efficient allocation of staff time, equipment, and other resources
-
More effective capitalization of cross-selling opportunities
-
Reduced payments for materials and services
-
Reduce fraud losses
-
Improved customer service
-
Steadier operation processes
Example: Anadarko5
Anadarko, a leading hydrocarbon exploration and production company, was collecting massive amounts of real-time drilling data, often in the millions of data points, from the many drilling rigs it maintains and operates. It needed to improve its operations by lowering operating costs in order to deliver more value to its shareholders. Its Advanced Analytics and Emerging Technology group adopted a streaming analytics platform to process this real-time data. This platform provides the following:
-
A flow diagram–type user interface (visual development environment) that is easy for an engineer or a data scientist to use
-
Access to analytic engines, providing easy processing of any kind of data
-
Capabilities for writing predictive models using open source software, such as R and Python, all in one platform
The result was a faster turnaround time for analysis development and a more optimal use of internal personnel that reduced consulting fees and IT support. This gave the company an advantage against the competition because it could better understand drilling operations and lowered costs and could return more value to its shareholders. Figure 1-7 illustrates this platform.

Figure 1-7. A streaming analytics dashboard
Data Analytics Review
This report has covered the essential components of data analytics: data exploration and visual analytics, data science and machine learning, and reporting. You have learned the following:
-
Various problems addressed by each
-
What can be expected from each
-
Some guidelines for selecting the best-suited component(s)
We also looked at examples for each. This last section pulls together the key messages from each of the previous sections to summarize what you need to consider to move forward in your data analytics decision.
Working Better Together
Deciding on which data analytics component(s) you want to implement is only half the effort. You must also decide how to make them work together in your business given the resources and culture you currently have. The resources are your legacy data systems and your staff or analytic talent. The questions in Figure 1-1 are only a few of the ones you need to address, but they can guide you in deciding which components you need, and maybe you need all of them. If so, how do you make them work together?
You can view the components and your resources as LEGO bricks that you can assemble in infinite ways to create any structure you want. The best structure is one that meets your vision while being functional and able to stand on its own. It must not be allowed to collapse under its own weight. You can combine the data analytics components you select with your resources to give you the most effective and practical analytics structure for your business.
For example, you could combine the parts as follows:
- AI-augmented data discovery for fastest time to insights
-
Artificial Intelligence (AI) is rapidly becoming the analytic technology of the future. Research and development in the AI space is producing new advances on a daily basis and will affect all aspects of business operations and markets in the next few years. You can combine AI with data exploration and visual analytics to further enhance and expand the real-time understanding of data trends and patterns. Data exploration and visual analytics augmented by AI technology saves time and economizes on resource use. It passes some of the repetitive, mundane work traditionally performed by data analysts to sophisticated tools that can not only quickly and automatically detect issues, but can also make recommendations regarding the issues and their implications.
- Streaming analytics + data science and machine learning for highly adaptive machine learning use cases
-
Data science is conventionally done on historical data. However, when data changes so fast that machine learning models cannot keep up, streaming data science technology allows data science to be applied to streaming data, which prevents models from becoming outdated or obsolete. This solution enables machine learning models to be highly adaptive through real-time recalibration using data that is still streaming through business systems.
- Embedded reporting + data science and machine learning for distributing data science findings
-
It is one thing to expose incredible insights within a small group of data scientists, but how do you get those insights into the hands of the business so that users can make better decisions? Data science is about revealing unknowns in data, predicting what is going to happen in the future, and prescribing actions. Embedded reporting is about centralized, governed distribution of information through applications. Together, they offer a solution to distribute the output of your analytic and machine learning models—represented as beautiful reports and dashboards embedded in the applications that workers already use to take action.
- Dashboards + streaming analytics for operational analytics
Dashboards are great for conveying information and should definitely be part of any data analytics implementation. They are part of the reporting structure. Dashboards, however, should be dynamic, reporting in real time the trends, patterns, and changes that could, and probably will, affect the future course of the business, whether tactical or strategic. Streaming analytics provides the real-time insight which the dynamic dashboards make available to stakeholders in a readily digestible and actionable form.
Key Takeaways
This report was designed to help you decide which components of data analytics might be appropriate for you to implement in your business. We have covered a lot of territory, so let us recap.
Discover: data exploration and visual analytics
This is an approach that business data analysts use to uncover and investigate hidden but potentially actionable, insightful, and useful information in data. It is a methodology or philosophy for digging into data in order to look for interesting relationships, trends, patterns, and anomalies requiring further exploration and testing.
- Key benefit
-
Provides the ability to visually interact with data in a self-service environment enabling a flexible analytics deployment across the enterprise.
- Key consideration
-
You have business analysts with a good understanding of their domain and are responsible for exploring data and generating insights, but need more powerful tools to explore and discover.
Predict: data science and machine learning
These are jointly used to predict a likely outcome or provide an optimized solution to changes in process parameters that can be embedded in business processes.
- Key benefit
-
Provides a competitive advantage by enhancing capabilities, speeding decision making, processing large amounts of disparate data types, generally lowering costs of operations, and generating new revenue streams, all of which lead to differentiated products and service offerings.
- Key consideration
-
Requires management support and organizational buy-in. Enhanced analytical talent is also necessary.
Present: reporting
This is the practice of collecting, formatting, and distributing rich information in a readily digestible and understandable fashion. It is the final step in an analytical process focused on presenting information to support decision making.
- Key benefit
-
Provides a curated, consumable view of information designed to help users answer a particular question or set of questions.
- Key consideration
-
Reporting tools should work flexibly with data and should support both precision design control of reports and dashboards and methods of distributing them to large audiences.
Analytic enhancer: embedded analytics
This is an effective way to incorporate data analytical methods in business applications and systems to enable business managers and executives gain more detailed and richer actionable, insightful, and useful information when they need/want it and how they want it.
- Key benefit
-
Provides application developers and IT professionals the ability to surface insights in context for their customers and business. It also allows users to delve into their data, ask their own questions, and answer them as they determine is necessary. Most importantly, it allows them to take speedy and timely action because the analytics is embedded in their mission-critical operational systems.
- Key consideration
-
Which components do you want to embed? There are many options, as discussed earlier in “Analytics Enhancers: Extending Analytics with Context and Speed”.
Analytic enhancer: streaming analytics
This is the discipline that applies logic and mathematics to data to provide real-time insights for quickly making better decisions.
- Key benefit
-
It handles real-time and historical data to provide a sense of urgency and call-to-action.
- Key consideration
-
The degree of precision and urgency of your decisions; the mission-critical nature of your processes.
This report has reviewed current trends in data analytics and discussed the options available to you for handling the massive amounts of data you are collecting—often in real time. Your options might seem overwhelming, but as we hope this report has demonstrated, there are ways to reduce the stress involved in handling data and make data analytic decisions that are appropriate for your organization or business and your customers.
1 This example is powered by TIBCO Spotfire technology.
2 Based on Statistics and Machine Learning in Python by Edouard Duchesnay and Tommy Löfstedt, Release 0.2. March 14, 2019.
3 This example is powered by TIBCO Spotfire technology.
4 This example is powered by TIBCO Jaspersoft technology.
5 This example is powered by TIBCO Spotfire technology.