Chapter 5: Program Planning Challenges
In this chapter, we focus on the common problems that organizations face when planning at the program level, which is considered the sweet spot of both agile at scale and Jira Align. Agile frameworks such as scrum work well for a single product development team or a handful of teams that sync up regularly via a scrum of scrums meeting. But what if you've got 5 to 12 agile teams working together on a set of features each business quarter? The general term for a group of teams delivering in this manner is a program. Now, what if you have several programs? The effort to coordinate teams has now leveled up to coordinating teams of teams. This is where agile scaling frameworks and the tools that support them come into play. Regardless of the scaling framework you choose, Jira Align helps solve this coordination challenge.
While a team delivers stories in sprints, a program delivers features within business quarters. Features are the middle-sized work item between portfolio epics and stories. While stories are the basic building block of value delivery, features are sized appropriately for display on roadmaps and program boards, and to be associated with release vehicles and products in Jira Align. This chapter will prepare you for the next chapter, where we cover program-level execution.
In this chapter, we will cover the following topics:
- Building product roadmaps
- Planning for value delivery as a program
- Organizing around value to reduce dependencies
- Visualizing program velocity for planning and predictability
The key construct we explore in this chapter is program-level planning, that is, planning to deliver business value as a coordinated team of teams. By the end of the chapter, you will know how to build live product roadmaps of work items and objectives, utilize the program board for quarterly planning, capture planned and delivered value, measure value delivery predictability, manage risks and dependencies, and measure program velocity for better planning.
Building product roadmaps
We begin our discussion of program-level planning with Jira Align's live product roadmaps, which can run the gamut from aspirational, long-range product planning roadmaps to more definitive, feature-level roadmaps for the next PI. Unlike traditional static roadmaps, these are connected to the actual work items to provide real-time insights and statuses.
An essential tool for product managers, roadmaps provide a timeline of key milestones and delivery targets to communicate product direction and align stakeholder expectations. Roadmaps can strengthen the relationship between the organization and its customers and suppliers, enabling transparency and collaborative planning for future value delivery.
To view a roadmap, first set your context in the configuration bar and then go to the navigation menu and select Program | Manage | Roadmaps. The Jira Align roadmap module has three views: Work, Program Increment, and Release Vehicle. These are selected from the view dropdown in the upper-left corner of the workspace, as shown in the following screenshot:

Figure 5.1 – Jira Align roadmap views
We will first explore the functionality of the work view before learning how to configure three particular work view roadmaps suggested by SAFe. In the next chapter, we will explore the program increment and release vehicle views.
Work view roadmap
The work view roadmap is a timeline that displays a list of planned and/or unplanned work items. There are two options for the timescale: sprints by program increment and month by quarter. Click on the cube button to select the former or the calendar button for the latter:

Figure 5.2 – Jira Align roadmap timescale options
The work items displayed are features, portfolio epics, or themes. Work items can be rolled up under their parent by selecting either feature by portfolio epic or portfolio epic by theme from the context dropdown. In the following screenshot, we've selected feature by portfolio epic and set the timescale to show sprints by program increment:
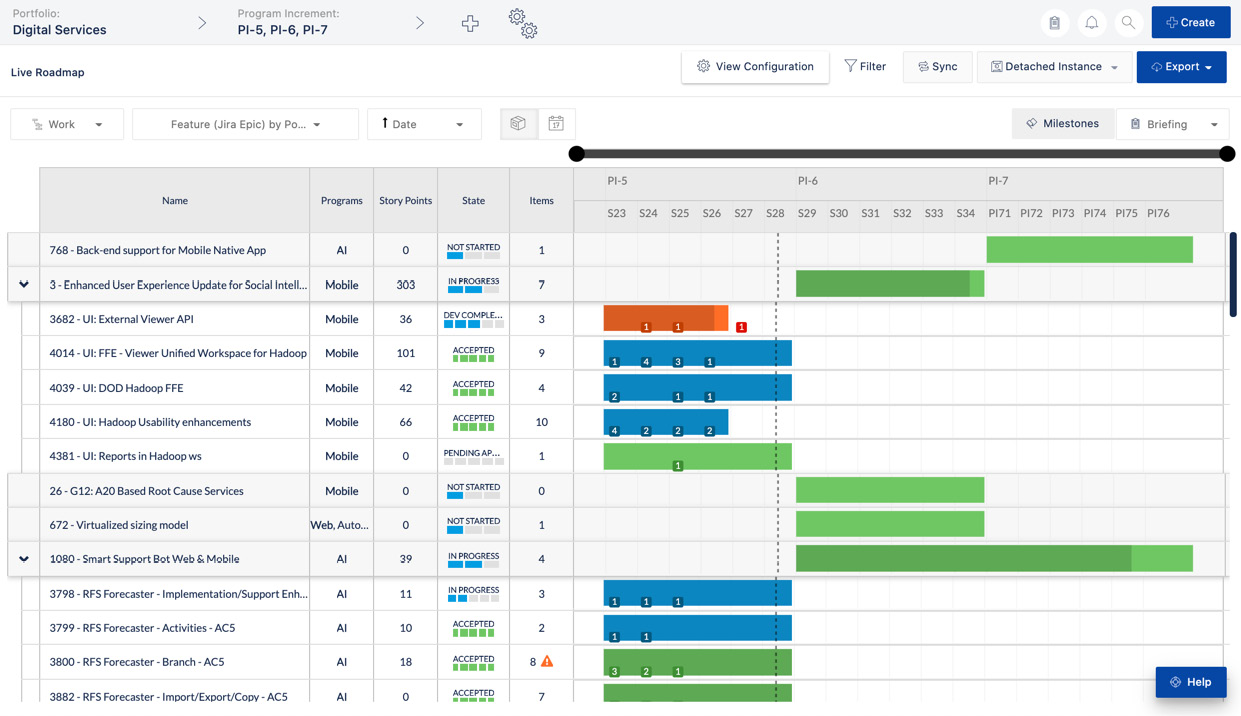
Figure 5.3 – Jira Align roadmap work view
Note that the feature rows are shown under the portfolio epic rows. A downward-pointing arrow symbol at the far left of each portfolio epic row indicates that it is expanded to show child work items. Click on the arrow symbol to collapse the child rows and show only portfolio epics.
Next, we note that the list of work items can be ordered by the earliest or latest start dates, best or worst health, or program rank. To select one of these options, click on the dropdown to the left of the timescale options to see the list shown in the following screenshot:

Figure 5.4 – Jira Align roadmap order by options
Simply click on one of the options to order the work items accordingly.
The next option we will explore is how to include unplanned work items, which are not associated with a PI. By default, the roadmap shows all planned work items assigned to a PI. To show unplanned work items alongside the planned, click on the View Configuration button near the top of the workspace to the right of center to open the window shown in the following screenshot:

Figure 5.5 – Jira Align roadmap unplanned work
Here, on the Unplanned Work Items tab, click on the Both Planned and Unplanned button and then on the Apply button. Note that unplanned work items, by definition, will not have progress bars on the timeline. You can set target dates for an unplanned work item by clicking and dragging on the timeline to set a progress bar for the item.
Next, let's add up to six columns to be displayed on the roadmap by clicking on the View Configuration button, and then on the Custom Columns tab. Displaying additional columns on the roadmap can enable faster decision making without the need to drill down into an item. It is recommended to start with the defaults and then add or remove columns as needed. For example, the Story Points default column displays the sum of all story LOE points rolled up under parent work items. Select the checkboxes for the additional columns you'd like to add to your roadmap and then click on the Apply button, as shown in the following screenshot:

Figure 5.6 – Jira Align roadmap custom columns
Next, let's add additional display options to the roadmap by clicking on the Other Options tab. Here you will find toggles that allow you to display the percentage complete on progress bars and group work items by owner, parent, theme, business driver, primary program, product, state, objective, team, and strategic driver. These are shown in the following screenshot:

Figure 5.7 – Jira Align roadmap other options
Note that the Group By option only works for a single-level roadmap, not for a two-level one such as the feature by portfolio epic roadmap shown in Figure 5.3. It is a popular option for grouping features or portfolio epics by their associated objectives or OKRs (objectives and key results). Lastly, there's an option to color the roadmap items by health, state, owner, product, primary program, parent, theme, or business driver.
Now that we've modified the roadmap's columns and appearance, let's further refine the scope of items shown on the roadmap. To do so, click on the Filter button near the top right of the workspace to open the window shown in the following screenshot:

Figure 5.8 – Jira Align roadmap filter
Here we can select attributes to add and specify values to refine the roadmap scope. For example, we can narrow the roadmap scope to a specific product and product owner. In order to remove the filter, click on the Clear filters link in the lower-left corner of the window.
Jira Align makes it easy to create a customer-centric roadmap by setting the scope to a specific customer. To do so, click on the Briefing button located in the top-right corner of the workspace, as shown in the following screenshot:

Figure 5.9 – Jira Align roadmap briefing
Next, select a customer from the list to generate the roadmap. This is a quick and easy way to generate roadmap view of the functionality to be delivered for a specific customer that includes a real-time work item status.
Tips and tricks
As a prerequisite to using the Briefing option, customers must be associated with features and/or portfolio epics in the customer field on the work items' details panel.
Note that the customer list is managed under Administration | Setup | Customers. There, the Jira Align administrator can add a new customer by clicking on the Add Customer button, typing the customer name, and then clicking on the Save & Close button.
Now that we have learned how to set the scope and display options for a roadmap, it's important to discuss the fact that a work view roadmap is essentially a sandbox where you can safely make adjustments without worrying about changing the underlying data. This enables you to review and commit the changes you wish to reflect in the underlying data by clicking on the Sync button near the top right of the workspace. This will open a window displaying any changes made to the roadmap, as shown in the following screenshot:

Figure 5.10 – Jira Align sync roadmap changes
Here you can review the list of changes to your roadmap data and then click on the Sync button to push the changes down to the underlying objects permanently. If there are changes you wish to remove, click on the X to the right of the particular object before you sync changes. The Health checkbox enables you to sync the object health you set on the progress bar. The Program Increment/Anchor Dates radio button allows you to sync the PI and sprint data, while the Target Start/Target Completion Dates radio button allows you to sync those dates. These sync options will populate the respective values down to the actual objects in the database, thus setting the status according to the specified parameters.
Jira Align does not require that you push changes down to the underlying objects in the database. In fact, you can create various what if analysis roadmaps and save them for consideration. To do so, create a detached instance of the possible roadmap changes that can be saved and shared with other Jira Align users using a unique URL. This allows product managers and product owners to experiment with different scenarios and versions of the roadmap. Simply select the View My Instances menu near the top right of the workspace and then click on the Create New Instance option, as shown in the following screenshot:

Figure 5.11 – Jira Align roadmap instances
Next, add a meaningful snapshot name to the new detached instance of your roadmap and then click on the Create Instance button. You can access the saved detached instances by clicking on the View My Instances option, as shown in the preceding screenshot.
At this point, there are other important attributes to consider. Namely, you can display key events on your roadmap by clicking on the Milestones button near the top right of the workspace, as shown in the following screenshot:
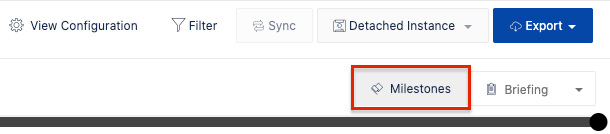
Figure 5.12 – Jira Align roadmap milestones button
This opens the Work-View Milestones window shown in the following screenshot:

Figure 5.13 – Jira Align roadmap milestone settings
Here you can slide the Fixed Date Milestones toggle on to show key dates associated with portfolio epics. Note that these dates are added to the Time/Skills tab of a portfolio epic's details panel. The dates are color-coded and displayed using stars on the progress bar, as shown in the following screenshot: Start / Initiation is displayed in cyan, Portfolio Ask is displayed in purple, and Target Completion is displayed in yellow:

Figure 5.14 – Jira Align roadmap milestones
Next, you can slide on the Objective Milestones toggle to show objective dates for features and portfolio epics. Note that you must click on the View button next to each listed objective in order to display the objective milestones on your roadmap. Any objectives with missing target completion dates are shown here as incomplete. After clicking on the Apply button, the selected objective milestones are displayed as flags on the roadmap timeline. These can be seen in Figure 5.16.
There are a few other important aspects of the roadmap to point out:
- The dotted line on the timeline indicates today's date.
- The count of stories associated with each feature is displayed along the progress bars. Story counts are positioned in the columns corresponding to their scheduled delivery sprints, enabling you to monitor the flow of stories for each feature.
- If you hover over the story count, a popup displays the story IDs and names. Click on the ID or name to open a story's details panel.
Once you've gathered information in this manner, you can set a feature's health by right-clicking on its progress bar and selecting one of the options shown in the following screenshot:

Figure 5.15 – Jira Align roadmap object health
Note that the health of the work item is subjective and set manually. Now that you've updated your roadmap, you can export and share it with external stakeholders who don't have access to Jira Align. Simply click on the Export button in the top-right corner of the workspace and choose a PNG image or CSV file. At this point, we are ready to learn how to create roadmaps defined by SAFe.
SAFe defines three types of roadmaps: the near-term PI roadmap, long-term solution roadmap, and portfolio roadmap. We will explore them in that order.
Near-term PI roadmap
The near-term PI roadmap displays commitments for a program ART or solution train for the planned and upcoming PIs. As shown in the following screenshot, the near-term PI roadmap offers a forecast into the fixed date and objective milestones for the next two to three PIs:

Figure 5.16 – Jira Align near-term PI roadmap
To create a near-term PI roadmap, we will use what we've already learned about the work view roadmap and configure it as follows:
- Set the configuration bar context: Select a program and choose the planned and two upcoming PIs for the context. Here we have chosen the Mobile program and the following three PIs: PI-5, PI-6, and PI-7.
- Set the roadmap objects context: Select Features or Features by Portfolio Epics to display the work items.
- Set the order of the objects: Select Program Rank: Ascending or Date: Earliest Start - Latest Start to order the work items accordingly.
- Set timescale view: Click on the cube symbol button to set the timescale to display Sprint by Program Increment.
- Set the view configuration: Click on the View Configuration button to add the default or other columns to the roadmap.
- Set the milestones: Click on the Milestones button, toggle on the Fixed Date and Objective Milestones options, and select objectives to show on the roadmap by clicking the View button.
Now that we know how to configure a roadmap of near-term PIs, let's see how to configure a long-term solution roadmap.
Long-term solution roadmap
The long-term solution roadmap displays commitments for a solution train over the course of multiple program increments and often multiple years. As shown in the following screenshot, it displays the key fixed date and objective milestones needed to achieve the solution vision over time:

Figure 5.17 – Jira Align long-term solution roadmap
To create a long-term solution roadmap, configure the work view roadmap as follows:
- Set the configuration bar context: Select the portfolio and choose the past, planned, and two upcoming PIs from the configuration bar. Here we have chosen the Digital Services portfolio and the following PIs: PI-4, PI-5, PI-6, and PI-7.
- Set the roadmap objects context: Select Features by Portfolio Epics to display these work items.
- Set the order of the objects: Select Date: Earliest Start - Latest Start to order the work items accordingly.
- Set timescale view: Click on the calendar button to set the timescale to display Month by Quarter.
- Set the view configuration: Click on the View Configuration button to add the default columns to the roadmap. In addition, you can add the Program Increment column to see the PIs for the work items and the Blocked column to identify any blocked work items. Note that if a child feature is blocked, meaning the Blocked field is set to Yes on its details panel, then the parent portfolio epic will also be blocked.
- Set the milestones: Click on the Milestones button, toggle on the Fixed Date and Objective Milestones options, and select objectives to show on the roadmap by clicking the View button.
Now that we've configured a long-term solution roadmap, we're ready to explore the third and final roadmap recommended by SAFe, the portfolio roadmap.
Portfolio roadmap
The portfolio roadmap displays commitments for a portfolio over the course of multiple PIs and often multiple years. As shown in the following screenshot, it displays the key fixed date and objective milestones needed to achieve the portfolio vision across the portfolio's value streams over time:

Figure 5.18 – Jira Align portfolio roadmap
To create a portfolio roadmap, configure the work view roadmap as follows:
- Set the configuration bar context: Select the portfolio from the configuration bar. You can choose one or more portfolios as the context. Here we have chosen the Digital Services portfolio and the following PIs: PI-5, PI-6, and PI-7.
- Set the roadmap objects context: Select Portfolio Epics to display these work items.
- Set timescale view: Click on the calendar button to set the timescale to display Month by Quarter.
- Set the view configuration: Click on the View Configuration button to add columns to the roadmap. For example, add the Theme column to display the linked parent theme work item, the Status column to display the portfolio epic status, and optionally the Owner column to display the epic owner.
- Set the group by property: Go to View Configuration | Other Options, toggle on the Group By option, and choose Strategic Driver as the Group By property.
- Set the milestones: Click on the Milestones button, toggle on the Fixed Date and Objective Milestones options, and select the objectives to show on the roadmap by clicking the View button.
Note that the portfolio epics are grouped by their strategic drivers, such as Expand, Innovate, and Sustain in Figure 5.18. The portfolio roadmap provides a strategic and long-term directional view of epic delivery over multiple business quarters. While this is a valuable long-term view, it must be balanced with the goal of enterprise agility and flexibility to respond quickly to market rhythms and events. Therefore, it is important for product managers, epic owners, and C-level execs to meet regularly to update the portfolio roadmap based on continuous learning and market changes.
Now that we have learned how to build work item roadmaps, including those recommended by SAFe, let's examine how to quantify the planned and actual value that those work items deliver to customers.
Planning for value delivery as a program
A best practice for delivering business value as a coordinated team of teams is to capture the planned and actual business value at the program level. Programs typically select a dozen or so of the highest-ranking features from the product backlog to deliver each business quarter. Teams will then break features down into stories, load the stories into sprints, and determine target sprints for feature completion.
Teams also take note of, discuss, and agree upon dependencies, for example, when one team needs to deliver a story for a feature primarily developed by another team. Note that while the program itself owns the features, it is common for a particular team to take the lead and be the primary team for feature delivery. Jira Align supports these standard dependencies among teams in the program as well as external dependencies, for example, when a feature relies on a component being delivered by an outside vendor.
Each team then decides on their objectives for the quarterly program increment, and ideally, these objectives are SMART: specific, measurable, achievable, realistic, and time-bound.
There are several key outputs of quarterly planning that Jira Align helps to facilitate. Here we will discuss the program board, the centerpiece of program-level delivery, followed by objectives, program predictability, risks, and dependencies.
Program board
The program board serves as a single source of truth for what the program commits to delivering throughout the PI. It's a living document that is critical for both planning and execution. It has columns for the sprints in the PI and rows for teams in the program. It shows critical information, such as when features and objectives are targeted for completion and dependencies across teams. To access the program board, go to the navigation menu and select Program | Manage | Program Board. Be sure to set your context in the configuration bar. In the following screenshot, we've set the Mobile program and PI-5 as our context:
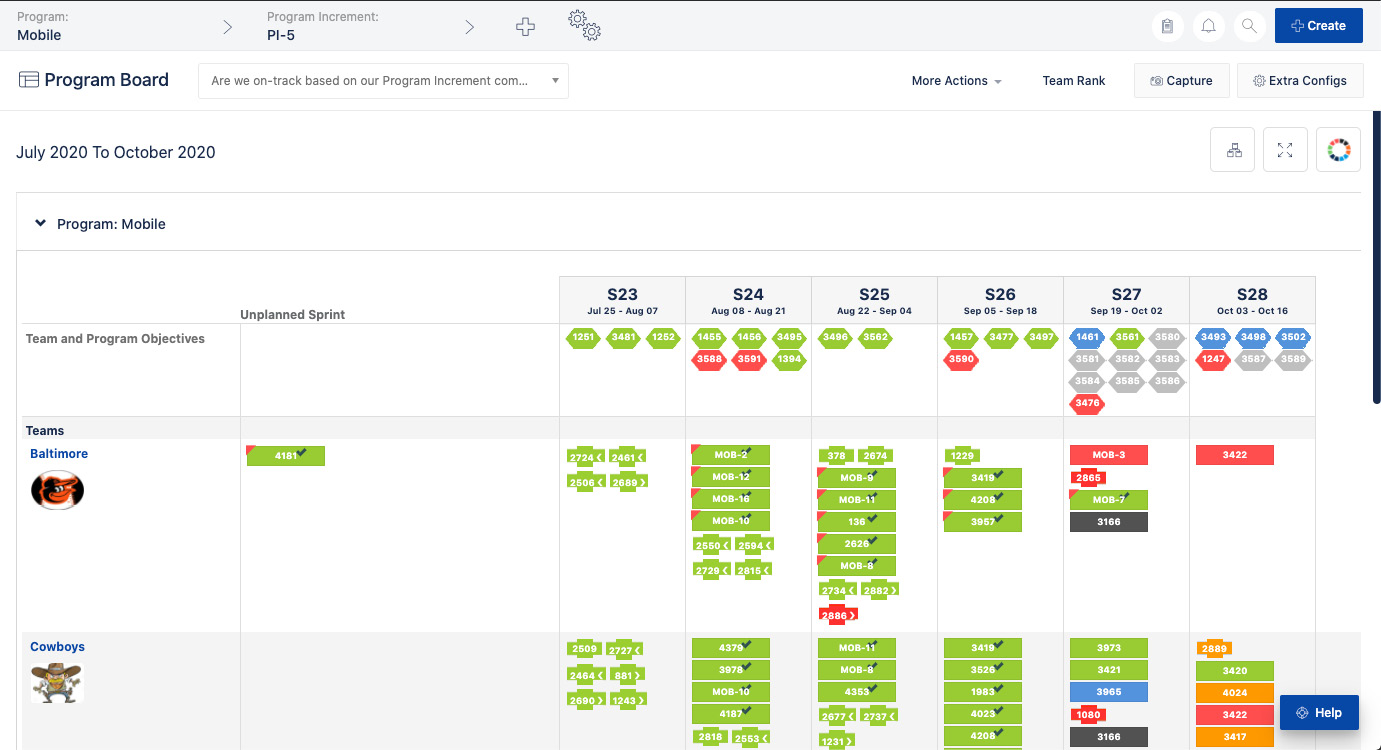
Figure 5.19 – Jira Align program board
Notice how the program board visualizes the target delivery sprints of features, shown as rectangles, and objectives, shown as hexagons. Unlike a physical board with red strings for dependencies, which can get cluttered, Jira Align represents dependencies by showing bowtie symbols in the swim lanes of teams upon which others (including teams from other ARTs) depend.
The colors are important indicators used throughout the PI to track status. For example, red means that an item is blocked, and orange signifies scheduling issues, as shown in the report legend. To access the legend, click on the color wheel button near the top-right corner of the workspace, as shown in the following screenshot:

Figure 5.20 – Jira Align program board legend
While the colors provide quick visualizations of status, you can hover over an item on the board to see more details displayed in the bottom-left corner of the screen. If applicable, any planning issues will be indicated by the presence of red or orange color blocks, as shown in the following screenshot:

Figure 5.21 – Jira Align program board item details
You can click on any item on the board to open a quick view panel with key information such as its child work items and associated risks. Clicking on the IDs for those items in the quick view will open their details panels, allowing you to drill down for more information. For full details of the item on the board, click on its ID and title at the top of its quick view panel to open its details panel for the complete set of information.
You can change the program board view by clicking on the card tree button, the second button to the left of the color wheel. This will present three options for displaying items on the program board with varying levels of detail:
- Normal View: Items are displayed on the board as cards containing their IDs, titles, and report legend symbols, including the rectangle, hexagon, and bowtie.
- Small View: Items are displayed on the board in the shape of their report legend symbols with their IDs. This is the most popular view used by most organizations.
- Heat Map View: Items are displayed on the board as scaled-down versions of their report legend symbols with IDs.
You can present the program board in full screen by clicking on the Expand button next to the color wheel. The full-screen presenter view hides the configuration bar and navigation menu to maximize the information displayed when presented on the big screen during planning.
Tips and tricks
When displaying the program board during planning events, we recommended using a browser-based add-on or extension to auto-refresh the board at 30-second intervals. This ensures that up-to-date information is displayed. The add-on or extension you choose may vary based on the operating system and/or web browser used. You can speak with your Atlassian solution partner for recommendations.
The next set of display options is found by clicking on the Extra Configs button in the top-right corner of the workspace. This will present a series of option toggles, as shown in the following screenshot:

Figure 5.22 – Jira Align program board extra configs
Here you can slide the toggles on to display specific types of features, unassigned features, objectives, dependencies, and further filter the program board according to a selected list of themes, portfolio epics, strategic driver categories, and/or customers. After setting the toggles to your liking, click on the Apply button to see the configured options displayed on the program board.
During planning, as product owners write stories for features, those features will land in their teams' swim lanes. However, features with no associated stories can still be shown in teams' swim lanes on the program board. To do so, click on the More Actions button near the top right of the workspace and select the Orphans option to open the window shown in the following screenshot. Note that Jira Align uses the term orphans to apply both to parent items without children (as is the case here) and children without parents:

Figure 5.23 – Jira Align program orphans
Next, select a team or teams to associate with a given feature and it will display in gray in the unassigned column to the left of the sprint columns on the program board. In the preceding screenshot, we have selected team Baltimore to associate with feature ID 3971. Associating an orphan feature in this manner allows the team to target a delivery sprint for the feature even if stories aren't written yet. This can provide a window for advance planning so that teams can start thinking about interdependencies while stories are being written.
Tips and tricks
If the Orphans menu option is not available under the More Actions menu, be sure to toggle off the Unassigned Features option from the Extra Configs menu. Note that the Unassigned Features option is toggled off by default, as shown in Figure 5.22.
Now that we've seen how orphan features can be displayed on the program board, let's see how to generate a history report showing all scheduling edits made to features on the board. Simply click on the More Actions button and select the History option to open the report shown in the following screenshot:
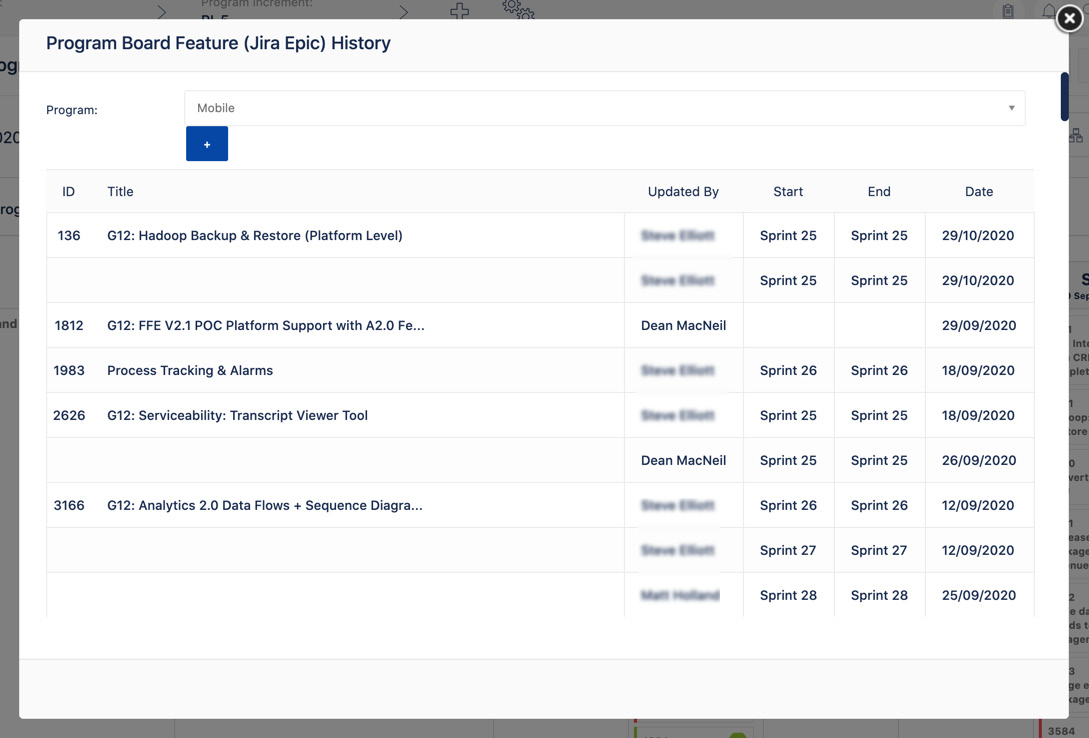
Figure 5.24 – Jira Align program board history
When a feature's schedule is modified, the report indicates the user who made the update, the start sprint, end sprint, and timestamp when the modification was made. Any unplanned features will show the start and end sprints as empty. You can filter the report by clicking on the blue plus + icon to display all available filters, including programs, date ranges, program increments, portfolio epics, and tags.
Programs typically have up to 12 teams. You can change the order in which teams are displayed on the program board by clicking on the Team Rank button near the top-right corner of the workspace, as shown in the following screenshot:
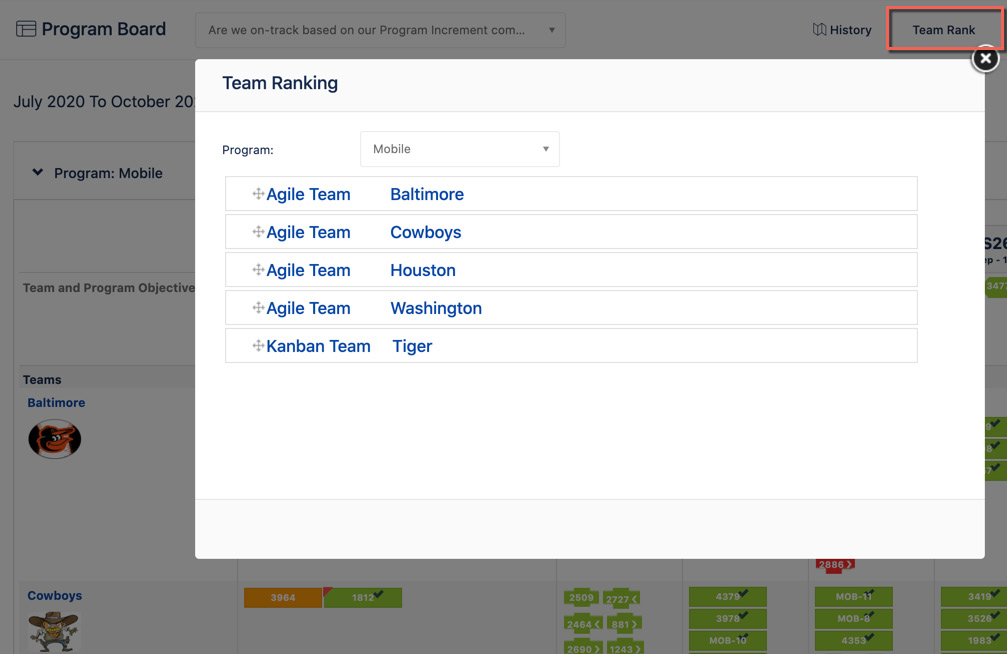
Figure 5.25 – Jira Align program team rank
Here you can select a program to list its teams and then drag and drop to adjust the teams' display order on the board. Lastly, you can export the program board by clicking on the Capture button to generate an image.
The Jira Align program board may require some getting used to for those accustomed to a physical board where sticky notes and string make features and dependencies tangible. Yet companies, especially larger ones, have long been using Jira Align's program board, even during in-person PI planning. One reason is that it saves time entering physical board data into the tool. Another is that Jira Align's dependency functionality enforces a contract between teams that is documented, trackable to resolution, and provides visualizations that can serve as inputs to the management review and problem solving session. For example, a plethora of dependencies upon a single team may warrant the redistribution of team members to reduce knowledge silos. Dependencies are so important that we'll discuss them in their own section later in this chapter.
Objectives
Another key output of quarterly planning is a list of several agreed-upon PI objectives per team. These are often linked to one or more features because they represent the business outcomes achieved as a result of delivering the features. If you are following SAFe, PI objectives receive special attention. Business owners, who are the stakeholders of what is to be delivered in the quarterly increment, assign a business value score to the teams' PI objectives on a scale of 1 to 10, with 10 being the highest level of value.
The release train engineer or program-level scrum master then summarizes the team objectives into the program's PI objectives in a format suitable for management communication. According to SAFe, PI objectives help shift the program's focus from output to outcomes, from delivering work to delivering value. If not following SAFe, you may associate key results with these objectives, thus turning them into quarterly OKRs for the program.
In Jira Align, you can add objectives at the team, program, solution, and portfolio levels. Here, let's see how the RTE can view team objectives for the PI and create higher-level program objectives for management reporting purposes. To see the program's team objectives for the PI, set the program and PI in the configuration bar, and then go to the navigation menu and select Team | Manage | Team Objectives.
To see the planned and actual business value, click on the Columns Shown button at the top of the workspace to the right of center and then select the Planned Value and Delivered Value columns. In the following screenshot, we see the Mobile program's team objectives for PI-5, sorted by planned value:

Figure 5.26 – Jira Align team PI objectives
To create an objective, click on the Add Objective button in the top-right corner of the workspace and enter the following details:
- Tier: Select one of the objective levels: Team, Program, Solution, or Portfolio.
- Name: Add a meaningful objective name.
- Description: Add additional details to describe the objective.
- Program: Select an applicable program.
- Program Increment: Select a program increment.
- Owner: Select an objective owner.
- Primary Team: Select a primary team from the program that will be responsible for the objective.
- Target Sync Sprint: Select the target delivery sprint for the objective.
- Find Parent Objective: Select a parent objective if applicable. For example, select a program objective as the parent when creating a team objective.
- Dates: Select dates for the following, if applicable: Portfolio Ask, Start / Initiation, and Target Completion.
- Status: Select a status for the objective: Not Started, In Progress, Deferred, Cancelled, Missed, or Done.
- Health: Select a color to indicate the health of the objective: Red, Orange, Green, Yellow, Gray, or Blue.
- Blocked: Select No or Yes to indicate whether the objective is blocked.
- Category: Select Critical Path or Stretch Goal if applicable. Note that in SAFe, stretch objectives are planned, but not committed to, by the team because of too many unknowns or risks.
- Type: Select a type, if applicable: Feature Finisher, Incremental Delivery, Non-Code, or Roadmap Milestone.
- Planned Value: Select a value from low (1) to high (10), as scored by the business owners during the PI planning event.
- Delivered Value: Select a value from low (1) to high (10), as scored by business owners following the PI system demo.
- Notes: Add additional notes.
At the end of the program increment, usually during the Inspect and Adapt event if you are following SAFe, business owners apply the actual business value delivered to the objectives created during PI planning. Note that this is a list of PI objectives per team, not the summarized view created by the RTE, which will often roll up many similar objectives into a single one. The comparison of actual to planned value serves as a predictability metric, which is the percentage of planned value points delivered. SAFe advises that this metric be captured at the team level and then rolled up to determine predictability at the program level. Predictability is a common challenge for teams that is only compounded at the program level, so it's an important metric to consider.
While Jira Align supports the earlier-described SAFe practice, you have the option to apply business value to both team and program objectives. To see the list of program-level objectives for the PI, go to the navigation menu and select Program | Manage | Program Objectives.
Jira Align also makes it easy for the RTE to group team objectives into program objectives by assigning a parent objective in a team objective's details panel. The relationship between the objectives can then be viewed by going to the navigation menu and selecting Enterprise | Objective Tree. This module provides a visual representation of the hierarchy between related objectives and their higher-level strategic goals. In the following screenshot, we've clicked on the first button to the right of the blue oval Jira Align Labs icon to display the popular list view. There is also a tree hierarchy view available by clicking on the other button:

Figure 5.27 – Jira Align objectives tree list view
Note that we've set the Mobile program and PI-5 as our context in the configuration bar and then selected the Program Objectives tab to show that objective level. We've also clicked on the pointing angle symbol to the left of the first objective in the list to expand and display its child objectives. The columns in this view display the following objective and goal information:
- Name and description, shows the objective details.
- Key Results, shows scores and percent of target achieved.
- Owner, the person responsible for the objective.
- Number of aligned objectives or goals, meaning the number of child items.
- Key Result Progress: Color-coded bar displaying the percentage of completed key results.
- Work Progress: Color-coded bar displaying the percentage of completed stories related to the objective or goal.
- Score: Displays the score for the objective or goal. Objectives that haven't had a baseline value set or progress recorded on key results will display a score of N/S (not scored).
Note that progress and scores are applied at each level, so higher-level objectives don't roll up the metrics below them. Click on the name of an objective, goal, or key result to view and edit details. By displaying the relationship between objectives and goals at different levels of your organization, this report helps RTEs and others ensure that the child items align with and properly inform the next level up. The progress bars at each level provide quick status indicators, useful for program/portfolio leadership and enterprise executives to get a read on value delivery.
Tips and tricks
At present, the Objectives Tree is a Jira Align Labs module. If you don't see it, speak with your Jira Align administrator to enable it for your role.
The Jira Align REST API 2.0 supports the creation, reading, and updating of objectives and key results. Speak to your Atlassian solution partner to enable the REST API in your instance. You can read more about the REST API by going to the user menu and selecting Support | Documentation | Knowledge Base | Integrations.
Now that we've learned how to capture planned and delivered values for PI objectives, let's take a look at one of the reports that help visualize value delivery.
Program predictability
Examining the percentage of completed objectives achieved during a selected time period can help provide a better understanding of the program's ability to deliver business value. The program predictability report makes this easy. To access it, go to the navigation menu and select Program | Transform | Program Predictability Report. As shown in the following screenshot, it displays a line chart by team/program with an average for all selected teams/programs:

Figure 5.28 – Program predictability report
Here we are looking at team objectives, so teams appear on the x axis. You can run the report for other objective levels by clicking on the Extra Configs button in the top-right corner of the workspace. For all other levels, programs appear on the x axis.
This report is useful during PI planning to enable teams to compare committed objectives with their historical average of completed objectives to help ensure delivery capability. The report can be displayed in fullscreen or downloaded by clicking on the three bars at the top of the chart to the right of the title.
Now that we've explored how to create, measure, and visualize objectives and their value metrics, let's learn how to record risks that could impact the delivery of work items and outcomes.
Risks
Tracking and reporting risks are important activities irrespective of whether you are following SAFe or not. In SAFe, program risks are key outputs of PI planning. During breakouts, teams identify program-level risks and impediments that could impact their ability to meet objectives. These are reviewed openly and honestly together as an ART, facilitated by the RTE, and categorized as follows onto a ROAM board, available in Jira Align:
- Resolved: The teams agree that the issue is no longer a concern.
- Owned: Someone on the Program ART takes ownership of the item since it cannot be resolved at the meeting.
- Accepted: Some risks are just facts or potential problems that must be understood and accepted.
- Mitigated: Teams can identify a plan to reduce the impact of an item.
The following screenshot is an example ROAM board in Jira Align:

Figure 5.29 – Jira Align ROAM board
Note that risks appear under their given ROAM category, and pie charts provide summarized risk data.
To add a risk, go to the navigation menu and select Program | Manage | Risks to open the risk grid. To filter risks for your context, select the program and PI in the configuration bar. Next, click on the Add Risk button in the top-right corner of the workspace to open the risk details panel, as seen on the right in the following screenshot:

Figure 5.30 – Jira Align risks details panel
Use this panel to enter and track the following risk details:
- Name: Add a risk summary.
- Description: Add additional details to describe the risk.
- Status: Select a status to identify whether the risk is Open or Closed.
- Occurrence: Select a probability of the risk occurring using the following scale: Critical, High, Medium, or Low.
- Impact: Select an impact of the risk using the following scale: Critical, High, Medium, or Low.
- Critical Path: Select Yes or No for whether the risk affects the critical path of program increment execution.
- Program and Program Increment: Select the affected program and PI for the risk.
- Owner: Assign an owner to the risk to set responsibility.
- Relationship: Select how the risk relates to the program. You can choose the program increment or a work item (feature, portfolio epic, or theme). Selecting a work item will enable an additional attribute to link the impacted work item.
- Resolution Method: Select a resolution method by applying ROAM: Resolved, Owned, Accepted, or Mitigated.
- Consequence: Add details related to the consequence of the risk if it were to occur.
- Contingency: Add details related to the risk contingency plan on how to handle the risk if it were to occur.
- Mitigation: Add details related to risk mitigation steps to reduce the risk impact.
- Resolution Status: Add details on how the risk was resolved at the time of risk closure.
Now that all details are captured, the risk will appear on the ROAM board. To access this board, click on the More Actions button near the top right of the risk grid workspace and select Risk ROAM Report. As shown in Figure 5.29, it displays risks by ROAM category, and you can click and drag risks across the board from one category to another. The board also displays pie charts showing open versus closed, the risk of occurrence, and the impact of occurrence.
You can further filter the ROAM board by clicking on the Extra Configs button in the top-right corner of the workspace. This allows you to filter by work item type (feature, portfolio epic, or theme) or a specific item within a type. Lastly, to share it with external users, you can export the report by clicking on the Capture button to generate an image.
To see how risks impact PI execution, refer to the program board by going to the navigation menu and selecting Program | Manage | Program Board. Any item with an associated risk will appear in yellow, as indicated in the report legend. Click on the item to open its quick view panel, where you can then click on the associated risk for full details.
Note that while risks are usually associated with work items, you can also associate risks with objectives. To do so, open an objective's details panel, scroll down to the Risks section, and either use the search box to select an existing risk or click on the Add button to add a new risk.
Now that we've captured features, objectives, and risks on the program board, let's return to the important concept of dependencies. Paying attention to dependencies during planning can help set the program up for successful execution.
Organizing around value to reduce dependencies
Programs or ARTs are virtual teams of teams, organized around value delivery. It's therefore important to identify your value streams upfront in order to set these teams up for efficient and effective value delivery. That's why the SAFe Implementation Roadmap has the Identify Value Streams and ARTs step soon after the decision to Go SAFe.
Each ART should be able to deliver features independently with minimal dependencies on other ARTs. This may take a few PIs to get right, so hold off on making any organizational changes around ARTs. In fact, the traditional hierarchy can remain intact while the ARTs are a virtual overlay. While the traditional hierarchy is geared toward stability, the virtual team of teams overlay is meant for nimble pivoting and agility. The two can work hand in hand in achieving your business' sought-after outcomes.
A common pitfall is to structure ARTs along functional lines – this will create numerous dependencies that impede the effective flow of value delivery. Luckily, Jira Align visualizes team and program dependencies as a matrix or wheel that allows you to click on them to take action. The wheel view, in particular, has helped organizations adjust their ART structures to reduce dependencies and improve delivery flow. If the wheel view resembles a spider web, it may be time to reevaluate team structure. We will explore dependency visualizations in the next chapter.
In Jira Align, you can create dependencies between teams and programs, either within a portfolio or across portfolios. You can also create dependencies on external entities. To begin, access the dependencies grid by going to the navigation menu and selecting Program | Manage | Dependencies. Be sure to set your context in the configuration bar. In the following screenshot, we have selected the Mobile program and PI-5:

Figure 5.31 – Jira Align dependencies grid
Note that the dependency grid is split, displaying dependencies that require action from you at the top and all others at the bottom. At the top left of the workspace is a search box where you can search for dependencies by ID or keywords. You can also click on the following quick filter buttons to refine the list of dependencies shown in the grid:
- Your Requests: Displays dependencies that were raised by you and are awaiting a commitment
- To Do: Displays dependencies that require attention and action to be taken by you or your team
- All: Displays all dependencies that are relevant to you and your team
You can customize the dependency grid by clicking on the Columns Shown button to add or remove columns and then clicking on the Save button. Click on the Apply Filters button to refine the dependency list based on several selectable parameters. Once the dependency grid is configured and filtered to your liking, you can share a link by clicking on the Share button.
You can further explore dependencies by clicking on the More Actions button at the top of the workspace to open the menu shown in the following screenshot:
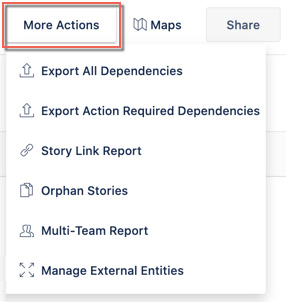
Figure 5.32 – Jira Align dependency grid, more actions menu
Here you can select from the following options:
- Export All Dependencies: Export all of your dependencies to an Excel file, allowing you to email or review the data.
- Export Action Required Dependencies: Export only the dependencies requiring action to an Excel file, allowing you to email or review the data.
- Story Link Report: Generate a report of all story links in Jira Software for the purpose of converting them to dependencies in Jira Align. Note that this requires configuration by your Jira Align administrator under Administration | Jira Settings | Manage Projects | Manage Custom Fields. Furthermore, we recommend that team-level dependencies remain in Jira Software where teams manage them locally using Jira's issue linking functionality, while Jira Align is reserved for the program level on up.
- Orphan Stories: Generate a report of all stories from multi-product features with no related dependency.
- Multi-Team Report: Generate a report showing the status of dependencies that horizontally affect multiple teams.
- Manage External Entities: Manage the list of external stakeholders and internal contact responsible.
We now know how to view, customize, and share information from the dependency grid. We will explore Jira Align's sophisticated dependency workflow in the next chapter. Now, let's examine how to visualize velocity for better planning as a program.
Visualizing program velocity for planning and predictability
Velocity is key for team level predictability. Let's say that a feature is sized at 80 points and the team's average velocity is 40 points per 2-week sprint. We can then predict that the feature can be delivered in 2 sprints or 1 month. Just as it's important for a team to know its velocity in order to predict when a work item can be delivered, so too is it important for a team of teams to know its program velocity. Jira Align has several visualizations for this. Here we highlight three of them: the Program Increments Velocity, Program Increments Burnup, and Velocity Trend reports.
Program Increments Velocity
This report shows the overall velocity for the teams participating in the selected program and PI. The format is a bar graph with sprints on the horizontal axis and story points on the vertical axis. The report provides portfolio managers, RTEs, and others with a high-level understanding of whether the work relating to a PI is on track.
It is beneficial to review the report during pre- and post-PI planning meetings and retrospectives. The report is based on the program and PI selected in the configuration bar. In the following screenshot, we have selected the Mobile program and the PI-5 program increment:

Figure 5.33 – Jira Align program increments velocity report
You can access the report by going to the navigation menu, clicking on the search icon (magnifying glass), and then searching for Program Increments Velocity. It is a common misconception that velocity should continually increase. The sign of a healthy, stable development organization is that velocity, and thus predictability, remains consistent. If you see many peaks and troughs, this may point to team instability, a high interrupt environment, inaccurate work estimation, or the early stages of agile maturity. Note that you can quickly export the data by clicking on the Capture button in the top right of the workspace.
Program Increments Burnup
The Program Increments Burnup report shows the burnup of story points for the PI. Additionally, for teams that size defects in story points, it displays a defect burnup. Depending on the context, environment, industry, company size, and other variables, teams may or may not treat their defects like user stories.
This report is especially useful for portfolio managers and RTEs to gain insight into the teams' ability to deliver stories as planned. As shown in the following screenshot, the format is a combined chart, including the plotting elements of a line graph with a bar chart displaying sprints on the horizontal axis and story points on the vertical axis:

Figure 5.34 – Jira Align program increments burnup report
You can access the report by clicking on the search icon (magnifying glass), and then searching for Program Increments Burnup. The display can be filtered by PI, release vehicle, and team by clicking on the Extra Configs button.
This report is useful for assessing the maturity and stability of product development teams. Organizations new to agile will have fluctuations in sprint velocity that will even out over time as program teams shift from doing agile to being agile aided by coaching, inspecting, and adapting. Lastly, note that you can quickly export the data by clicking on the Capture button at the top right of the workspace.
Velocity Trend
The Velocity Trend (planned versus actual velocity variation by team) report highlights the planned and actual velocity by team over a specified period. As shown in the following screenshot, the format is a bar chart grouped by team and time period on the horizontal axis, with story points on the vertical axis:

Figure 5.35 – Jira Align velocity trend by team report
Note the dots that show committed or planned velocity and bars that show actual velocity per team for the program and PI selected in the configuration bar. To access the report, go to the navigation menu and select Program | Transform | Velocity Trend. Click on the Extra Configs button to configure the report view for years, quarters, or program increments. It's beneficial to review the report regularly to identify highly predictable teams, help make realistic work commitments, and spot any negative trends early. Lastly, you can quickly export the data by clicking on the Capture button at the top right of the workspace.
Now that we've learned how to leverage Jira Align's reporting for better planning and predictability, let's see how it can help with other key concerns of the program in the next chapter.
Summary
In this chapter, we learned how to overcome planning and coordination challenges at the program level. We began by learning how to build product roadmaps for the near-term, long-term, and portfolio. We then explored how to effectively plan and deliver as a program, including the use of the program board, objectives and OKRs, and risk management. Next, we introduced Jira Align's rich dependency functionality and how it can help programs align toward value delivery. Lastly, we covered various program velocity views to assist with planning and predictability.
In the next chapter, we will focus on execution challenges at the program level. We will introduce the program room, the control center for program execution. We'll then continue the discussion on dependencies, including workflow and visualizations, and then explore ways to reduce unnecessary work, manage scope, and communicate PI and release progress.
Questions
- What are the three roadmap types recommended by SAFe?
- Which report allows you to predict the ability to deliver business value?
- Which risk model do SAFe and Jira Align use for managing risks?
Further reading
- Scaling Scrum across Modern Enterprises, by Cecil Rupp (Packt, 2020)