
Chapter 7
Smart Technologies and Vehicle-to-X (V2X) Infrastructures for Smart Mobility Cities
Bernard Fong1, Lixin Situ1 and Alvis C. M. Fong2
1Faculty of Health and Environmental Sciences, Auckland University of Technology, Auckland
2Department of Computer Science, Western Michigan University, Kalamazoo, MI, USA
Chapter Menu
Introduction
Data Communications in Smart City Infrastructure
Deployment: An Economic Point of View
Connected Cars
Concluding Remarks
Objectives
- • To outline the key elements of intelligent transportation in a smart city.
- • To understand how various subsystems are connected within the smart city infrastructure.
- • To investigate the economic aspect on smart mobility solutions.
- • To elaborate on data processing optimization techniques for enhanced resource utilization.
7.1 Introduction
Smart and assistive technologies interoperate practically in urban infrastructure such that many cities across the world strive to promote technological advances in urbanization and integrate technology to create smart cities through infrastructural enhancement. While this opens up numerous opportunities in smart city infrastructure development, it also entails smooth integration of a wide range of technologies associated with something within the smart city locality as well as connecting with the outside world where foundation still heavily depends on legacy systems. An interoperable and sustainable infrastructure is therefore needed for smooth integration.
Advanced infotainment technology together with a fast data connection to the vehicle-to-infrastructure (V2I) network provides elementary features that shape the underlying platform for smart walkability and mobility [1]. To carry a person from one point to another point, namely, an original to an intended destination, a personalized micromobility vehicle can connect individuals to a nearby public transport hub that brings people from a local area together [2]. The broad technological scope that a smart city entails involves almost all aspects of information and communications technology (ICT) in both individual vehicles and the supporting infrastructure. For example, signal processing provides contextual voice controls to help create a safer driving experience and to analyze data traffic flow; wireless communications are necessary for big data delivery in a reliable and secure manner. Social networks and Internet of Things (IoT) support acquisition as well as integration of both structured and unstructured datasets from various sources for city planning and administration. Smart traffic routing and advising services are both essential components of a smart traffic system [3].
To study the technological challenges of integrating these into an efficient smart city infrastructure, this chapter is organized as follows: various aspects of data communications within a smart city are presented followed by the economic aspects of infrastructural deployment. We then take a closer look at the issues as well as the benefits of connecting each and every vehicle in a smart city environment.
7.2 Data Communications in Smart City Infrastructure
The basic building block of a sustainable smart city infrastructure entails utilizing a vast amount of data from a wide variety of sources for different purposes. As such, making good use of the collected data for the enhancement of efficiency and profitability becomes a challenging task for businesses as well as government authorities and agencies. While this opens up numerous opportunities in smart city infrastructure development, it also entails smooth integration of a wide range of technologies associated with something within the smart city locality as well as connecting with the outside world where foundation still heavily depends on legacy systems.
Data from different sources within a smart city proximity can be used for enhancement in many areas. Taking transportation as an example, supports for the day-to-day operation of the city include various pieces of connected infrastructural equipment, fleet management system, and critical automotive components that may have a substantial impact on traffic flow and road utilization efficiency. Further, generalized extensions to public transport systems that carry a significant proportion of commuters during peak hours would require data analysis of travel pattern. The analysis of a huge amount of data collected enables better resource planning and utilization that enhances profitability and energy efficiency.
In this simple example of supporting intelligent transportation in a smart city, it can be seen that data processing entails many different types of data collected from many sources of varying nature. Data analytics therefore entails different types, like images that show the condition of real-time traffic (the overall picture entails analysis of video footage from an array of cameras that show vehicle movement in the area), pure numerical data about public transport usage, predefined routing of each and every bus operating in the area, and the most unpredictable movement of pedestrians that exhibits a high degree of randomness. To process such diverse types of data, a communication system must be able to carry data efficiently and securely irrespective of the type and intended destination. A simplified version of the intelligent transportation system is shown in Figure 7.1 that illustrates the basic operation in a smart city context. The overall system within a smart city would involve integration and coordination of various transportation modes that make up the entire city's transport system. The V2X communication network that covers the left half of Figure 7.1 as well as the micromobility subsystem form a vital part of the overall smart city infrastructure in that it provides the vital link to each and every entity that forms the fundamental building blocks in controlling the efficient allocation of various resources within the city.

Figure 7.1 Intelligent transport system block diagram.
7.2.1 Data Acquisition
For any communication network, the fundamental part is the data that is transmitted from the source to its intended destination. Data from different sources serve different target audiences and each can take a very different form. Figure 7.1 shows, for example, a case where traffic flow data is collected within the road management subsystem; such data can drive adaptive lighting control to save electricity when street lights can power on and off automatically as vehicles or pedestrians pass by. The same set of data that controls traffic lights can ease congestion at junctions by alerting drivers to traffic jams so that they can either be suggested to take alternative routes or the traffic lights can be made adaptive to enhance traffic flow efficiency.
Traffic flow theory is a traditional methodology widely used by transportation engineers to apprehend the properties of traffic flow at any given time [4]. Early travel demand forecasting processes used in the 1970s [5] relied heavily on manual data analysis due to the limitations of computational power during that time. More recent models such as speed–flow–density relationships, queuing theory, shock waves, and continuum flow models are adopted to enhance traffic flow modeling under nonstationary conditions [6]. Past traffic flow analysis relied on two-dimensional spatial–temporal diagram that shows the trajectory of a specific vehicle through time as it moves from its origin to a destination that may or may not be known [7]. Acquisition of datasets heavily depends on parameters such as mean speeds of individual vehicles, flow, and density.
Moving into the smart city era, intelligent transportation systems entail far more than monitoring traffic flow on certain roads within a close proximity. Automation tasks such as electronic billing of road usage, collection of car parking fees, and electricity consumption of charging an electric vehicle (EV) should all be handled by a single payment platform. This platform then becomes a subsystem. So, intelligent transportation systems must integrate separate subsystems that each perform very important societal functions in such diverse areas as telecommunications, transportation, energy networks, and financial transactions.
One of the key challenges is to assess data flow across the overall system, which has become a key part of smart transportation infrastructure development. The major concerns are the ability to detect and identify events that are early warnings of traffic disruption, which could lead to eventual congestions. The ability to carry out an advance traffic assessment, data collection from multiple streams, integration and prognostication of multiple data streams for knowledge discovery, and decision-making will require a very sophisticated big data analysis platform. All of these outputs will ensure the reliability of the performance of the complex traffic analysis system.
In this simple example of big data analysis in an intelligent transport system, data set that represent traffic flow entails not only the number of vehicles in the region of interest but also parameters such as speed and direction of each vehicle, and any vehicles in nearby regions that may soon enter the region all need to be considered in order to derive a routing map that shows the approximate travel time as shown in Figure 7.2. The accuracy of this system depends on reliable collection of real-time traffic data from many monitoring stations and roadside cameras. The vast amount of data, from different sources of different forms, are transmitted across the city's communication infrastructure for subsequent centralized processing followed by distribution of information throughout the city

Figure 7.2 Map showing motorists' approximate travel times.
The traffic model is even more complicated in the real world since factors such as road works and change in road conditions due to rain or snow can cause significant delays. The dissimilar types of information that are gathered from different sources at the same time pose significant challenges to the communication system for generating such map with real-time instantaneous update.
While the Global Positioning System (GPS) provides important real-time traffic information, it can show the geographical location of every vehicle in the region. The GPS makes traffic flow analysis more predictable when drivers enter their intended destination, giving a certain degree of knowledge on the routing. Additional information such as vehicle type also provides important information on traffic analysis. For example, a motorcycle has a far less contribution to congestion than a 40-ft container truck. More detailed information on how each individual road user, both vehicle drivers and pedestrians, would provide a better overall picture on the actual traffic condition [8].
7.2.2 Traffic Surveillance
Given the diverse types of data that need to be analyzed, a key challenge is to identify and extract essential performance features as described above. Features of data provide crucial means of accurately identifying the onset of any anomalous or changing behavior that might affect traffic flow in parts of the city. This traffic surveillance approach will apply to two-class classification (i.e., smooth vs. congested), extend to multi-class classification where flow reduction occurs while traffic still flows reasonably smoothly at slower speeds, and perform prognostic analysis to quantify the congestion over time.
For dimensional reduction, which is important for discriminating intermittent speed reduction from traffic jams in real time, data analysis would involve exploiting mutual information (MI)-based methods [9]. MI-based feature selection methods can effectively eliminate the difficulties posed by nonlinear high-dimensional datasets by considering higher-order statistics to recognize salient features that are easily masked by noise and data transformations [10]. Traffic analysis taking a prognostic approach [11] can be accomplished by computing the MIIO, that is, MI between the selected input variables and output class labels in computer systems as a method to gradually increase the MI, in order to extract all relevant features for subsequent processing. The salient features necessary for carrying out prognostic analysis can then be computed using the MIIO method with a window estimator, which can determine the most prominent attributes or features that cause congestion.
Intelligent transport systems are special in that they contain unlabeled and partially labeled data. Labeled datasets in transportation systems are complex in nature due to the vast range of data types continuously flowing in from many independent sources. However, using datasets without labels makes diagnostic and prognostic analysis impossible for real-time self-cognizance. An adaptive algorithm for prognostic analysis may therefore become necessary when simultaneously analyzing incoming data from different sources. An adaptive approach can be taken from the hypothesis that if the learning algorithm is allowed to choose the data from which it learns, it will provide more accurate estimation with less training effort.
Since congestion is often not simply binary (stop or go) in traffic flow analysis, it may be necessary to utilize a two-pronged method in order to obtain multi-class probabilities by deconstructing the multi-class problem to yield a series of binary problems [12]. In theory, the data can be collected from both GPS information and roadsides. More than often, traffic control relies on video cameras showing real-time traffic flow at various preselected points. Moving into a smart city environment, route planning with GPS provides prognostic significance of specific traffic patterns, allowing early prediction of where congestions are likely to occur.
7.3 Deployment: An Economic Point of View
The development of an underlying infrastructure that forms a smart city heavily relies on the potential profitability that can be generated directly or indirectly from the vast amount of data that flows across the smart city. This involves making appropriate use of data to maximize business incentives of smart systems and optimization of return on investment (ROI). Keeping up with technological advances while maximizing profitability is particularly important in the fast-changing environment when serving consumers through analyzing market information as an integral part of a smart city infrastructure. There is also a special need to address technological changes as everything associated with public transport becomes smarter. In this section, we will take a brief look at selected case studies in telemedicine, green city, intelligent transportation, and autonomous vehicles. We observe how they are linked to the overall smart city infrastructure through a reliable and efficient communication system and what economic considerations are there when different entities with different economic interests share the bulk of collected data.
There are different implications when dealing with cross-platform data analytics as data takes different forms and types. Car parks can improve utilization efficiency through sensors that track when a vehicle leaves and alert nearby drivers to nearby empty spots. Stores in shopping malls can use BI technology to send shoppers promotional coupons to their smartphones based on certain demographic parameters.
7.3.1 Detecting Abnormal Events
The worst-case scenario from the business point of view is to deal with the unexpected. It is therefore highly desirable to carry out anomaly detection so that the chance of having to deal with awkward situations can be minimized, be it a car park that has highly fluctuating utilization rates or bus operators that have long queues for certain routes while empty buses run on other routes. Using statistical process control (SPC) to monitor multivariate and auto-correlated data can provide a big data analytics solution in such situation [13]. SPC can also be used for business activity monitoring and traffic surveillance. However, most traditional SPC detection methods depend on distributional assumptions on incoming data and therefore impose certain limitations on anomaly detection [14]. In intelligent transportation systems, similar to problems in business activity monitoring and traffic surveillance, data is more likely to be auto-correlated and multivariate with mixed continuous and discrete measurements [15].
To address such issues in data analytics, an integrated approach for modeling and monitoring of complex multivariate data should entail:
- • Baseline characterization and correlation analysis of traffic and environmental conditions
- • Followed by classification-based flow monitoring methods for SPC monitoring of forecasting residuals.
In many cases, there may be a loss of data in the system, for example, the failure of a set of traffic lights that no longer provides real-time traffic information, yet this may or may not have a substantial impact on traffic around the city. The nature or type of missing data can provide clues to identify the underlying problems that are often discovered when the reasons for the absence of the data are probed.
Data integrity issues may also arise from masking events, measurement errors, and reporting errors resulting from various types of uncertainty, aggregation, structural changes in data generation mechanisms [16], and possibly technical limitations such as insufficient bandwidth or computational power to handle the amount of incoming data. Issues of merging disparate data structures, which are created under varying traffic conditions, are a common problem with many routine operational and administrative datasets in most public transport systems. Such data can be evaluated by adapting data imputation methods and through the formulation of spatial and temporal interpolation techniques related to traffic monitoring systems [17].
7.3.2 Network Failure
The communication network backbone system plays a vital role in smart city infrastructure maintenance. More specifically, many component or system failures can be made predictable through analysis of certain critical components to detect any deviation from normality that eventually leads to an impending failure [18]. Fusion prognostic approach combining physics-of-failure (PoF) and data-driven prognostics facilitates the assessment and prediction of reliability of individual subsystems that form the overall smart city infrastructure under their specific actual operating conditions. This leads to the possibility of assessing the actual degradation of different components that can provide useful information on remaining useful life (RUL) estimation.
The PoF approach uses knowledge of a hardware failure mechanisms and life cycle loadings. Summarized in the flowchart in Figure 7.3 that takes a diagnostics and prognostic approach, the first step for the PoF-based prognostics is to identify the hardware architecture of a subsystem. Physical connections and the functional relationship between system components will be identified. Next, application loads during the life cycle can be evaluated. The system may experience various loading conditions, including thermal, chemical, electrical, and mechanical loads, and even radiation from the environment. The final step is to conduct failure modes, mechanisms, and effect analysis (FMMEA) with the primary objective of identifying and prioritizing potential failure mechanisms. FMMEA is normally performed in conjunction with stress analysis to acquire knowledge of stress levels at a specific location for a given application load. These analyses yield the statistically likely time to failure for a dominant failure mechanism at failure sites based on PoF models.
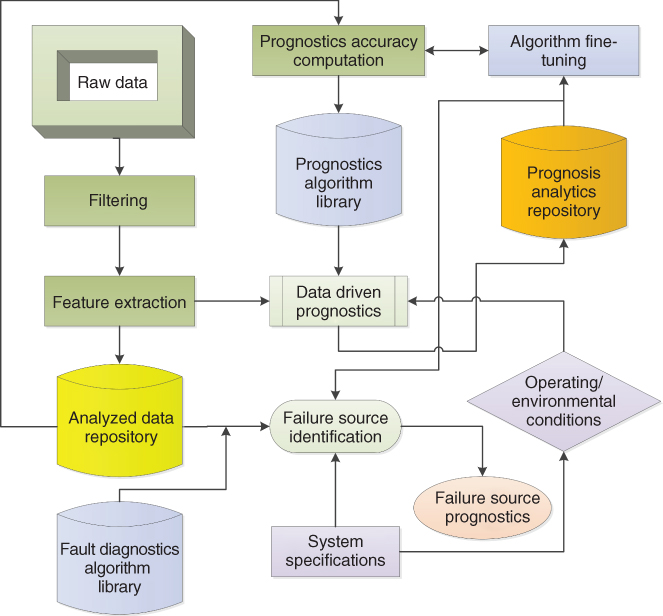
Figure 7.3 Network failure analysis.
To illustrate how data analytics is applied to the derivation of maintenance schedule, we take a look at an example where roadside light-emitting diode (LED) display signboard is subjected to continuous use in an outdoor environment.
The data-driven technology will be implemented to carry out a precursor parameter monitoring for the detection of LED degradation [19]. A precursor parameter is defined as a parameter that indicates incipient faults or damages before a failure occurs. As shown in Figure 7.3, the first step is to identify the correlation between precursor parameters and potential failure modes. This is followed by accelerated testing procedures and loading conditions that reflect the environmental and operating loads in the field. The last step is to develop algorithms that enable the assessment of the reliability of LEDs. All these steps require a precursor parameter monitoring system that enables precursor parameter sensing, data acquisition, and signal processing.
7.3.3 Micromobility Data Communications
The concept of micromobility provides flexibility that occupies less space on the road. These vehicles have common features such as low power consumption, short-range, and short time battery recharge, making them particularly suited for commuters in a confined area of locality. As illustrated in Figure 7.4, a smart mobility vehicle has a small size that facilitates ease of driving and parking whose maneuverability is almost as malleable as a motorcycle.

Figure 7.4 Micromobility vehicle. (a) Personalized flexibility. (b) Assistive disability access.
The network serves many purposes in micromobility management, not only serving the vehicle user but processing information that is necessary for overall planning of various resources to optimize utilization. In Figure 7.5, micromobility management is accomplished by combining both the PoF (riding on the same PoF approach as described in the previous section on infrastructure reliability analysis) and the data-driven methodology such that data analysis benefits from the merits of each. The advantage of the PoF method is its ability to isolate the root cause of congestion that contributes to slower traffic. The data-driven approach is advantageous as it is capable of detecting intermittent flow behavior that can address the complexity of the analysis by extracting relevant information of environmental and traffic data. The first step in the process is to determine the set of parameters that can be monitored in situ. Identification of the parameters for monitoring can be aided by anomaly detection. It is carried out by comparing the monitored data with a baseline of free flow, that is, when every vehicle can travel at the speed limit while binding to the two-second rule. This baseline is effectively the ideal driving condition that consists of a set of parameter data that best represents the possible variations of the normal operation of the entire traffic control system. When an anomaly is detected, the parameters that contribute significantly to the observed anomaly are isolated. The isolated parameters help determine the PoF models most relevant to slower traffic, which in turn provide information such as maximum number of vehicles that can pass through a given road junction. Assessment of the remaining capacity of that road junction can then be computed using data-driven techniques such as neural network, multistep-ahead prediction, and support vector regression.

Figure 7.5 Micromobility management network through fusion prognostic operation.
The data-driven estimate is obtained by trending the critical parameters to calculate the time until the junction reaches saturation so that other vehicles can be advised to take alternative routes, while the PoF estimate is obtained using the relevant PoF models identified in the above paragraph. By the fusion methodology, a number of advantages can be obtained, such as the determination of root cause of speed reduction, detection of intermittent congestion, and reassignment of traffic signal sequence.
Vehicles that are parked are not being utilized. They can therefore be made more efficient through a sharing scheme. An efficient smart city should facilitate a service that allows registered users to share a vehicle and parking space to alleviate traffic congestion and improve the utilization efficiency of resources. The system allows users to pick up and return a rental vehicle at different service locations throughout the smart city.
Figure 7.6 shows a trial implementation of an electrically assisted bicycle-sharing service system that allows subscribed members to rent and return the bicycles at different locations. The operation of such system relies on a communications network that supports optimal usage of vehicles and parking space. The most challenging part of making the system effective is managing the automated booking system through big data analytics processing. Since advance booking is not required, the system allows instant booking as a user is ready to pick up a bicycle and go. There is no way of forecasting bicycle demands prior to receiving a booking. Demand estimation modeling is necessary to make prediction based on past history [20]. Data analytics based on computational modeling of known events of occurrence can be applied to the prediction and modeling of demands. Through collection of relevant data, model-driven prognostics can assist with forecasting the possible implications of the rate of demand change and the concentration of available bicycles across different service stations. Prognostic prediction can also reduce the impact of demand change due to different times of the day. To address this challenge, efficient prediction and early warning of an availability shortage in certain service stations of the system through real-time booking data collection, usage monitoring, and management through prognostic analysis during peak hours are necessary. The most common existing methods for availability shortage detection include spatial and temporal surveillance [21].

Figure 7.6 Vehicle sharing for enhanced resource utilization efficiency. (a) Electric bicycle service location. (b) Automated booking system.
In reality, the booking data are likely to be heterogeneous and correlated and often exhibit seasonal patterns over time. Efficient detection and prognostic methods under these situations are necessary for system management. Effective mitigation strategies and bicycle management entail diagnostics, prognostics, and forecasting methods. Efficient spatiotemporal surveillance algorithms will be part of the key infrastructural elements for monitoring multiple streams of data, including booking and actual bicycle return statistics and the planned route of each bicycle in the system. The effectiveness of bicycle monitoring system encounters multiple testing issues at several levels. There are multiple data sources and within each data source there are usually multiple series, and many of the series are further broken down into subseries, for example, by age-group of users. All data series are monitored in a univariate fashion, and finally, multiple detection algorithms are applied to each series. Each of the mainstream methods for handling multiple data streams has its limitations [22]. For instance, the commonly used Bonferroni method is considered overconservative, false discovery rate (FDR) corrections depend on the number of hypotheses and are problematic with too few hypotheses, and Bayesian methods are sensitive to the choice of prior and it is unclear how to choose a prior. As mentioned, the booking data are likely to be heterogeneous and correlated and often exhibit seasonal patterns over time. Surveillance approaches should be developed toward faster detection by monitoring real-time booking such as sudden increase in utilization of the automated booking terminals. Other correlated indicators from special events and internet search of bicycle availability in addition to monitoring confirmed that bookings should also be considered. It is needed to well recognize and handle the multiplicity problems as their effects are very visible in bicycle usage surveillance.
7.3.4 V2X Network Integration and Interoperability
In the context of the smart city, interoperability with legacy networks and infrastructures is perhaps the greatest challenge that network planning has to deal with. This is significant as it entails more than full compliance with various networking standards. The legacy networks are not an issue by themselves, yet linking them with the smart city network backbone may entail validation of technology prior to network integration, and this may pose problems.
When dealing with integration and interoperability, there is even more than integrating harmoniously between a smart city and the outside world. Smart city infrastructure should be designed such that vehicles ranging from the smallest personal mobility vehicle, being a slow single-person transportation mode as shown in Figure 7.7 that enables a user to ride safely alongside the pedestrians, share the same space with all other types of vehicles. These personal mobility vehicles are literally designed and customized for personal usage. They are optimized for efficient usage in a smart city environment. Such transportation system has to allow safe passage for the right vehicle type in the right place.

Figure 7.7 Personal mobility vehicles.
7.4 Connected Cars
Similar to the case of public transport, road safety and utilization efficiency heavily depend on collecting and analyzing data of traffic flow. Autonomous driving vehicles offer an effective solution for intelligent traffic control as pre-programming routing allows smoother traffic flow control. Ambulance traveling across metropolitan cities has long been held up by traffic congestion [23]. Optimizing the travel route for mission critical emergency support vehicles has to be thoroughly addressed in a smart city.
7.4.1 Multi-Hop Communication in V2X
With the widespread adoption of V2X communication, smart cities are surrounded by various highly localized vehicular networks such as vehicle to vehicle (V2V), vehicle to home (V2H), and V2I. The proliferation of these communication-capable motor vehicles forms a broader V2X communication system, in that each vehicle as a node with its unique IDs constructs a network across diverse platforms and shares data for each intended purpose [24]. In the V2X context, the most important attribute of managing a network (or subnetwork) is constructing and maintaining network resources. Since momentous computational power is necessary to transmit and receive communication packets simultaneously, each vehicle in the V2X system may have certain limitations to share their resources by relaying packets destined for other nodes. However, if the majority of nodes in a network are unable to relay packets, as in the case of inter-vehicular communication, multi-hop communication may not be feasible and vehicular system be rendered ineffective. This problem needs to be thoroughly addressed in rural areas where cellular coverage may not be available.
In the case of Figure 7.8, only the front red car is under cellular coverage. The other two cars further back are too far away from the cellular base station and therefore unable to send any callout signal unless a signal extension path is made possible by relaying through nearby vehicles traveling in the same direction.

Figure 7.8 Data coverage extension with multi-hop V2X.
To model such situation, the multi-hop network illustrated in Figure 7.8 is supported by a compensation scheme for each vehicle participating in multi-hop forwarding. Data packets are relayed from V2V through short-range V2V direct communication so that communication is made possible even when a vehicle is out of cellular coverage. Awarding compensation for participating in forwarding packets implies that participants contribute their resource to all other vehicles in the V2V subnetwork. This is equivalent to a structure in which nodes within the network regulate the amount of resources made available for the forwarding service by a given node based on a free and fair policy. To illustrate a case, consider an emergency vehicle initiating an emergency request within a multi-hop V2V network such that each vehicle v that participates in providing resources announces its participation p(v) for the data packet forwarding service. A network management system (NMS) then communicates with vehicles that want to use multi-hop communication and decides whose resources will be used. In the example shown in Figure 7.9, vehicle v1 decides to use the path P = {(v1, v2), (v2, v3), (v3, v4)} to send data to v4; p(v2) and p(v3) are assigned to v2 and v3, respectively. The prices of the nodes are renewed during the beginning of each round, and the paths are valid until the end of the round.

Figure 7.9 Multi-hop network management.
The main challenge here is to find the best routing for a data packet v∈V, p(v) when v is outside cellular coverage, being assigned with full network resources f(v) to each v∈V when all requests r∈R use the shortest paths to reach the nearest base station. This problem is addressed in two stages: (i) to find the optimal data transmission path and (ii) to compute the required network resources for successful transmission of all data packets to the nearest base station.
To reduce the impact of mobility on topology control, Dijkstra's algorithm [25] and ad hoc on-demand distance vector routing [26] are used. The objective is to overflow the subnetwork with packets and trace return packets to find the shortest routing paths [27]. Since each node within the same subnetwork may have its own objective function, it is quite possible that the result will yield multiple optimal paths. In the simplest case, the path that maximizes the hops of v1 may minimize the hops of v2 and vice versa. So, to address multi-objective optimization such as in the case of computing the maximum available bandwidth above, a Pareto-optimal solution, which is a solution in which there is no feasible solution that improves one objective while the other objectives suffer degradation, can be deployed [28].
To validate NMS effectiveness in its most primitive form, a uniform fixed resource allocation policy is set as the baseline. The Pareto-optimal solution of the centralized prognostics and network health management (PHM) scheme [29] uses multiple iterations such that crossover and mutation are evaluated with the mean values of 10 different random connected vehicles. Angular similarity against the number of rounds of packets as a performance evaluation metric is shown in Figure 7.10. It compares the efficiency of an NMS to a predetermined baseline for network optimization. A baseline is drawn at 0.707 (1/√2) [30]. Figure 7.10 shows that the network management scheme becomes significantly more efficient as the number of rounds of packets exceeds 100.

Figure 7.10 Angular similarity performance evaluation of prognostics and network health management.
7.4.2 Green V2X Communications in Smart Cities
Smart technologies and V2X together provide a green environment through efficient use of energy. Optimizing energy consumption cannot be made possible without the support of a reliable green communication infrastructure [31]. In a smart city infrastructure, the two most relevant topics of interests are grid-integrated vehicle (GIV) and V2H communications for optimal energy utilization [32].
GIVs integrate into the smart city infrastructure by connecting each vehicle into the city's energy management network so that data can be gathered for efficiency and capacity planning of the grid. The network connects each vehicle to entities such as fleet management/operation companies, power utilities, and manufacturers of both EVs and charging stations. All these are the elementary building blocks of the grid management system. Data related to individual EV's use profile and battery's RUL are of particular interest for evaluating load management.
Load management is a particularly important topic in a green smart city environment since it optimizes electricity optimization in managing a collective type of EV chargers that comply different charging standards. Table 7.1 shows a number of different charging standards for 220 V (mainly Europe and Austrasia). These chargers utilize both single-phase and three-phase power supplies.
Table 7.1 Mainstream EV charging specifications (220 V market)
| Model | Single phase | Three phase | |
| IEC model | GB model | IEC model | |
| Input power | 220 VAC, 32 A | 220 VAC, 32 A | 380 VAC, 32 A |
| Output voltage and currents | Mode 1: 220 V 10 A | Mode 1: 220 V 10 A | Mode 1: 220 V 10 A |
| Mode 2: 220 V 32 A | Mode 2: 220 V 32 A | Mode 2: 220 V 32 A | |
| Mode 3: 380 V 32 A | |||
| Output sockets | BS 1363 | CPCS-CCC | BS 1363 |
| IEC Type 1 | GB 20234 | IEC Type 1 | |
| Charging protocol | PWM ready to support IEC 61851 | PWM ready to support GB 18487 | PWM ready to support IEC 61851 |
| Safety compliance | IEC 61851-1, IEC 61851-22 | GB 18487.1, GB 18487.2 | IEC 61851-1, IEC 61851-22 |
| Environment rating | IP54 | ||
| Internal control | Modular PCBA system with pilot duty communication and networking capabilities using embedded system CPU | ||
| Cable/socket lock | Interlock of IEC/GB type | ||
Integrated vehicle-to-grid (V2G) systems facilitate the reduction of peak-power demands. One of the key features of V2G is the ability to balance load such that a plug-in EV can charge overnight when electricity demand is at the lowest of the day and releases its remaining charge back to the grid for redistribution during the day [33]. Connected cars can also be initiated to dynamically return electricity to meet sudden demands for power [34]. The vehicle communicates with the load management system for energy optimization through the following daily cycle:
- 1. Plug-in connected car charges its battery at night.
- 2. Battery fully charged by the time the driver awakes.
- 3. Driver receives information about optimal routing as journey commences.
- 4. Preassigned route brings the vehicle to the nearest motorway with planned charging capacity.
- 5. Inductive road lane markers and electrified strips allow battery recharges via electrified motorways to compensate for depletion when the vehicle was driven from origin to the motorway.
- 6. Vehicle leaves motorway with fully charged battery.
- 7. Vehicle parked during the day can return electricity to the grid on-demand upon receiving request.
- 8. Driver returns home by repeating (2)–(6).
To facilitate Step (7), it is necessary to determine the amount of remaining charge necessary for completing the journey. A data-driven model can be constructed by analyzing either past routes, such as in the case of a commuter whose route between home and workplace is almost the same throughout all workdays or from user preprogrammed route through in-vehicle GPS. The main objective is to gather information about anticipated power consumption before the vehicle reaches the next charging point within supported range so that a good understanding about the usage profile of a particular vehicle can be computed.
7.4.3 Vehicular Communications Infrastructure Reliability
The challenges associated with reliable data communication with vehicles are mainly due to outdoor environmental conditions [35] and traveling speed [36]. Although the latter is a controllable parameter, it is practically infeasible to adjust the vehicle's traveling speed to trade off for better communications. For this reason, any wireless communication system that supports vehicular communications should allow continuous connection as the vehicle travels at a realistic speed, which may be in excess of 100 mph (160 km/h) in many countries. This is in fact one of the main advantages of advancing from HSDPA (3G) to LTE (4G) networks since LTE utilizes orthogonal frequency division multiplexing (OFDM) transmission scheme with better robustness to frequency-selective fading [37]. Generally, 4G is said to be able to maintain connection at normal vehicle traveling speeds with adequately fast handover from nearby base stations. LTE infrastructure is designed for deployment in a wide variety of frequency bands around 700 MHz to 2.6 GHz. LTE offers scalable bandwidths, from less than 5 MHz up to 20 MHz, together with support for both frequency division duplex (FDD) paired and time division duplex (TDD) unpaired spectrum.
In rural areas where base stations are far apart and users are widely scattered, there is generally no obstruction to wireless propagation so long as the terrain is flat, that is, signal undergoes free-space attenuation. However, issues such as scattering and multipath can be significant degradation factors to consider [38]. Furthermore, in vast metropolitan cities, IP addressing and user mobility across various network segments will become increasingly important. To make best use of the available wireless spectrum, systems can utilize both sector and frequency reuse to decrease adjacent and co-channel interference [39].
In the process of shaping a new smart city infrastructure, a brand new LTE network can be installed under the assumption that no existing legacy 2G/3G network needs to be considered for the purpose of network planning. Nonetheless, it is important to be looking forward to future planning where 5G is on the horizon. Utilizing a far higher carrier frequency than the current 4G LTE system would imply a very different set of signal propagation characteristics to be considered [40]. Most notable is the effect of rain-induced attenuation and depolarization when the vehicle is located several miles away from the base station [41]. The extent of radio link performance degradation is measured by cross polarization diversity (XPD) that is determined by the degree of coupling between signals of orthogonal polarization. XPD typically results in a 10% reduction in coverage due to cell-to-cell interference. The use of carrier frequencies way above 10 GHz has an effective trade-off for higher frequency reuse and capacity being offered due to higher spectral efficiency versus signal degradation due to rain.
To deal with a number of factors that influence various transmission reliability-related parameters, an adequate system operating or often known as the fade margin should be set to maintain communication link availability [42]. The fade margin, which measures the difference between the received signal strength and the signal minimum level, is maximized to provide maximum link reliability without increasing the transmission power.
7.4.4 Business Intelligence in Connected Cars
Navigation, telematics, and infotainment are the major applications of the connected car market [43]. The growth trend seen in the navigation segment is majorly due to the vast potential of realizing profit generation through integrating business intelligence (BI) technology into connected cars. As mentioned in the beginning of this chapter, BI opens up vast opportunities for businesses. We conclude this chapter by taking a brief look at what roles connected cars play in the context of BI, which relies on a secure communication network that strikes an acceptable balance between privacy and the type/amount of information that can be used [44]. The system relies heavily on both secured information communication and subsequent data analytics to extract relevant information. Associative classification technique applied to BI provides a new horizon for better matching between service providers and consumers in the fast-changing technology-driven market place [45].
Telematics for connected cars took off two decades ago when GM piloted the OnStar program in 1995 [46]. This market segment will certainly undergo a significant boost when the EU adopts compulsory installation of Automatic Emergency Call System (eCalls) (PE-COS 77/14) in 2017, while the US NHTSA also announced its intention to mandate V2V technology in new cars to induce collective action. Such regulations across the EU and USA drive a rapid expansion in both business opportunities and feature enhancements in the telematics and connected cars market. To enhance profitability, there are many complex steps requiring various inputs, algorithms, analysis strategies, and implementation decisions [47]. Modeling and drawing inference from a continuous flow of incoming data stream requires extraction of meaningful information from a set of observations. As there are practical problems with handling a large amount of data points collected from each vehicle, using data reduction methods as preprocessing is essential. Currently, sophisticated data reduction techniques are usually classification-based approaches [48]. These approaches work with a specified classification model and the reduced dataset is obtained according to classification accuracy. However, these data reduction methods often distort the original data distribution, making them inept for other classification models and other pattern recognition tasks. These methods are both computationally and memory intensive for feature extraction. The purpose of feature extraction is to yield representation that makes the classifier and data analysis effective and accurate.
Data received from each vehicle will be free to collect as many features as possible. The collected data will generally be in the form of ordinal data, also mixed with some nominal data, that is, the connector surface is “smooth” or “rough” and the residual is “clean,” “dark,” or “corroded.” One way to handle nominal data is based on mapping the nominal data into a continuous domain [49].
7.5 Concluding Remarks
This chapter describes various types of wireless communication systems interconnected to form an overall intelligent transportation infrastructure for smart city development. The vital role of the intelligent transportation system in the V2X communication network is to support smoother traffic flow. Data acquisition is another key part of the smart city framework as a series of information is required for efficient planning and resource allocation. We also studied the economic aspect on mainstream IoT solutions by focusing on network failure management and to analyze data coverage extension with multi-hop V2X. Finally, the chapter ends with a discussion on vehicular communications infrastructure interoperability and reliability such that the network can be made scalable to cater for future expansion in terms of both increased traffic volume and area of coverage.
Final Thoughts
In this chapter we discussed various aspects of smart mobility technology that form the basic building blocks of a smart city. The V2X infrastructure plays a vital role in connecting individual vehicles that travel across the smart city. Each vehicle may have different information set to transmit and take different routes from its origin to intended destination. All they exhibit in common is that they share essentially the same resources with the aim of reaching the destination safely in the shortest time with the least amount of energy consumption. All these can only be optimized by maintaining a reliable wireless communication link across the V2X network. At the same time, the diverse range of data collected from these vehicles contributes to the more efficient utilization of resources like car parking and traffic signal timing. These also lead to vast business opportunities through efficient deployment of BI technology in related business sectors, making the initial investment of building a comprehensive smart city network infrastructure economically worthwhile.
Questions
Although V2X technology provides an effective means for connecting individual vehicles to the broader smart city infrastructure, a number of major challenges still need to be addressed:
-
1 How to adopt surveillance methods to monitor real-time traffic condition in a dynamic smart city environment while striking a balance between privacy and data availability?
-
2 How to utilize data acquired from various sources such as in-vehicle cameras, road sensors, and other traffic-related indicators to improve efficiency of traffic flow?
-
3 How to grasp a better understanding about the behavioral properties of drivers in a dynamic environment?
-
4 How to structure a more realistic and accurate stochastic simulation model to facilitate connection between different modes of transport?
-
5 How to ensure infrastructure scalability to cope with future expansion and feature enhancement when keeping up with technological advances?
-
6 How to synergize the isolated research areas in road surveillance anonymously, simulation modeling, seasonal traffic pattern behavior, and traffic modeling?
-
7 How to enhance road safety within a smart city through critical risk analysis that effectively supports driving suitability evaluation of medical and nonmedical intervention strategies?
-
8 How to evaluate the sensitivity and robustness of different surveillance methods from the data generated from different parts of the smart city?
-
9 How to implement and validate the developed traffic analysis algorithms, models, and approaches through big data analytics knowledge, field experiments, and test-bed simulator systems?
-
10 How to optimize reliable continuous data communication for every vehicle throughout the smart city with the minimum number of base stations and access points?
References
- 1 Baccarelli, E., Cordeschi, N., Mei, A. et al. (2016) Energy-efficient dynamic traffic offloading and reconfiguration of networked data centers for big data stream mobile computing: review, challenges, and a case study. IEEE Network, 30 (2), 54–61.
- 2 Tracy, A.J., Su, P., Sadek, A.W. et al. (2011) Assessing the impact of the built environment on travel behavior: A case study of Buffalo, New York. Transportation, 38 (4), 663–678.
- 3 Djahel, S., Doolan, R., Muntean, G.M. et al. (2015) A communications-oriented perspective on traffic management systems for smart cities: Challenges and innovative approaches. IEEE Communications Surveys and Tutorials, 17 (1), 125–151.
- 4 Hall, F.L. and Motgomery, F.O. (1993) Investigation of an alternative interpretation of the speed-flow relationship for UK motorways. Traffic Engineering and Control, 34 (9), 420–425.
- 5 McFadden, D. (1974) The measurement of urban travel demand. Journal of Public Economics, 3 (4), 303–328.
- 6 Van Woensel, T. and Vandaele, N. (2007) Modeling traffic flows with queueing models: A review. Asia Pacific Journal of Operational Research, 24 (04), 435–461.
- 7 Levinson, D., Liu, H., Garrison, W. et al. (2011) Fundamentals of Transportation, CreateSpace Independent Publishing Platform.
- 8 Schäfer, R.P., Thiessenhusen, K.U., Brockfeld, E., et al. (2002) A traffic information system by means of real-time floating-car data. ITS World Congress Jan 2002.
- 9 Park, B., Won, Y.J., Choi, M.J. et al. (2008) Empirical analysis of application-level traffic classification using supervised machine learning, in Challenges for Next Generation Network Operations and Service Management (eds Y. Ma, D. Choi, and S. Ata), Springer, Berlin Heidelberg.
- 10 Fayyad, U., Piatetsky-Shapiro, G., and Smyth, P. (1996) From data mining to knowledge discovery in databases. AI Magazine, 17 (3), 37.
- 11 Lau, D.K. and Fong, B. (2011) Prognostics and health management. Microelectronics Reliability, 51 (2), 253–254.
- 12 Klijnsma, T. (2013) Preventing line congestion at Aebi Schmidt Nederland.
- 13 Montgomery, D.C. and Woodall, W.H. (1999) Research issues and ideas in statistical process control. Journal of Quality Technology, 31 (4), 376–387.
- 14 Shyu, M.L., Chen, S.C., Sarinnapakorn, K. et al. (2003) A novel anomaly detection scheme based on principal component classifier, University of Miami Coral Gables.
- 15 Steele, F. (2008) Multilevel models for longitudinal data. Journal of the Royal Statistical Society, Series A, 171 (1), 5–19.
- 16 Carroll, R.J., Ruppert, D., Stefanski, L.A. et al. (2006) Measurement error in nonlinear models: a modern perspective, CRC Press.
- 17 Fong, B., Rapajic, P.B., Hong, G.Y. et al. (2003a) On performance of an equalization algorithm based on space and time diversity for wireless multimedia services to home users. IEEE Transactions on Consumer Electronics, 49 (3), 597–601.
- 18 Fong, B. and Li, C.K. (2012) Methods for assessing product reliability: Looking for enhancements by adopting condition-based monitoring. IEEE Consumer Electronics Magazine, 1 (1), 43–48.
- 19 Fong, B., Ansari, N., and Fong, A.C.M. (2012a) Prognostics and health management for wireless telemedicine networks. IEEE Wireless Communications, 19 (5), 83–89.
- 20 Zhou, X. and Mahmassani, H.S. (2007) A structural state space model for real-time traffic origin–destination demand estimation and prediction in a day-to-day learning framework. Transportation Research Part B: Methodological, 41 (8), 823–840.
- 21 Dollár, P., Rabaud, V., Cottrell, G., et al. (2005) Behavior Recognition via Sparse Spatio-Temporal Features. Conf. Proc. 2nd Joint IEEE International Workshop on Visual Surveillance and Performance Evaluation of Tracking and Surveillance, October 2005, 65–72.
- 22 Huang, L., Guo, T., Zalkikar, J.N. et al. (2014) A review of statistical methods for safety surveillance. Therapeutic Innovation and Regulatory Science, 48 (1), 98–108.
- 23 Budge, S., Ingolfsson, A., and Zerom, D. (2010) Empirical analysis of ambulance travel times: The case of Calgary emergency medical services. Management Science, 56 (4), 716–723.
- 24 Han, T. and Ansari, N. (2014) Offloading mobile traffic via green content broker. IEEE Internet of Things Journal, 1 (2), 161–170.
- 25 Nishiyama, H., Ngo, T., Ansari, N. et al. (2012) On minimizing the impact of mobility on topology control in mobile ad hoc networks. IEEE Transactions on Wireless Communications, 11 (3), 1158–1166.
- 26 Liu, W., Nishiyama, H., Ansari, N. et al. (2013) Cluster-based certificate revocation with vindication capability for mobile ad hoc networks. IEEE Transactions on Parallel and Distributed Systems, 24 (2), 239–249.
- 27 Fong, B., Fong, A.C.M., and Li, C.K. (2011) Telemedicine Technologies: Information Technologies in Medicine and Telehealth, Wiley.
- 28 Zitzler, E. and Thiele, L. (1999) Multi-objective evolutionary algorithms: a comparative case study and the strength Prato approach. IEEE Transactions on Evolutionary Computation, 3 (3), 257–271.
- 29 Fong, B., Ansari, N., and Fong, A.C.M. (2012b) Prognostics and health management for wireless telemedicine networks. IEEE Wireless Communications, 19 (5), 83–89.
- 30 Apaydin, T. and Ferhatosmanoglu, H. (2006) Access structures for angular similarity queries. IEEE Transactions on Knowledge and Data Engineering, 18 (11), 1512–1525.
- 31 Khaleel, H.R. (2015) Telemedicine: Emerging Technologies, Applications and Impact on Health Care Outcomes, Nova Science Publishers, NY.
- 32 Higuchi, S. (2014) World movement on development and diffusion for next-generation vehicles. Journal of Automotive Safety and Energy, 5 (2), 107–120.
- 33 Sousa, T., Morais, H., Vale, Z. et al. (2012) Intelligent energy resource management considering vehicle-to-grid: A simulated annealing approach. IEEE Transactions on Smart Grid, 3 (1), 535–542.
- 34 Lund, H. and Kempton, W. (2008) Integration of renewable energy into the transport and electricity sectors through V2G. Energy Policy, 36 (9), 3578–3587.
- 35 Fong, B., Rapajic, P.B., Hong, G.Y. et al. (2003b) Factors causing uncertainties in outdoor wireless wearable communications. IEEE Pervasive Computing, 2 (2), 16–19.
- 36 Wang, Z., Liu, L., Zhou, M. et al. (2008) A position-based clustering technique for ad hoc intervehicle communication. IEEE Transactions on Systems, Man, and Cybernetics Part C: Applications and Reviews, 38 (2), 201–208.
- 37 Han, T. and Ansari, N. (2015) RADIATE: Radio over fiber as an antenna extender for high-speed train communications. IEEE Wireless Communications, 22 (1), 130–137.
- 38 Fong, B., Fong, A.C.M., and Hong, G.Y. (2005) On the performance of telemedicine system using 17-GHz orthogonally polarized microwave links under the influence of heavy rainfall. IEEE Transactions on Information Technology in Biomedicine, 9 (3), 424–429.
- 39 Fong, B., Ansari, N., Fong, A.C.M. et al. (2004) On the scalability of fixed broadband wireless access network deployment. IEEE Communications Magazine, 42 (9), 12–18.
- 40 Hong, W., Baek, K.H., Lee, Y. et al. (2014) Study and prototyping of practically large-scale mmWave antenna systems for 5G cellular devices. IEEE Communications Magazine, 52 (9), 63–69.
- 41 Fong, B., Rapajic, P.B., Hong, G.Y. et al. (2003c) The effect of rain attenuation on orthogonally polarized LMDS systems in tropical rain regions. IEEE Antennas and Wireless Propagation Letters, 2 (1), 66–67.
- 42 Fong, B., Rapajic, P.B., Fong, A.C.M. et al. (2003d) Polarization of received signals for wideband wireless communications in a heavy rainfall region. IEEE Communications Letters, 7 (1), 13–14.
- 43 Fong B, Wong ECC, Situ L, et al. (2016). Interoperability Optimization and Service Enhancement in Vehicle Onboard Infotainment Systems. Conf. Proc. 34th IEEE International Conference on Consumer Electronics, January 2016.
- 44 Hong, J., Shin, J., and Lee, D. (2016) Strategic management of next-generation connected life: Focusing on smart key and car–home connectivity. Technological Forecasting and Social Change, 103, 11–20.
- 45 Do, T.D., Hui, S.C., and Fong, A.C. (2005) Artificial immune system for associative classification Advances in Natural Computation, Springer, Berlin, Heidelberg, pp. 849–858.
- 46 Barabba, V., Huber, C., Cooke, F. et al. (2002) A multimethod approach for creating new business models: The General Motors OnStar project. Interfaces, 32 (1), 20–34.
- 47 Kamburugamuve, S., Fox, G., Leake, D., et al. (2013) Survey of Distributed Stream Processing for Large Stream Sources. Technical report.
- 48 Tsai, C.F., Eberle, W., and Chu, C.Y. (2013) Genetic algorithms in feature and instance selection. Knowledge-Based Systems, 39, 240–247.
- 49 Tominski, C., Abello, J., and Schumann, H. (2004) Axes-Based Visualizations with Radial Layouts. Conf. Proc. ACM Symposium on Applied Computing, pp. 1242–1247.