There are bunch of different types of knowledge object and different ways to use them in Splunk to make searching easier:
|
Knowledge Object |
Description |
|
Reports |
Saved searches of specific data and visualizations |
|
Alerts |
Saved searches of specific data set to email an alert or commit an action when triggered |
|
Events |
A log string that is saved and given a name for later reference during a search query |
|
Field extractions |
Very specific values within a log event that can be extracted with regex; often things such as |
|
Tag |
An ancillary category market for disparate yet similar event types/hosts/systems |
|
Field alias |
A second name given to a field within a sourcetype - for instance, user can be aliased to |
|
Lookups |
Usually a |
|
Workflow actions |
Usually a link to a URL or a |
|
Macro |
A referenced series of functions of query syntax that can process arguments |
Within these there are two or three fundamental knowledge objects that usually require constant attention from a Splunk administrator. They are as follows:
- Event type: Finds log strings that represent an action or a portion of a transaction. Often finds the string in the log that represents user login or user logoff.
- Field Extraction: Uses Regex to extract the appropriate values that are desired by the users, such as user or src_addr.
- Lookups: This is usually a
.csvfile created by a subject matter expert to enhance the data that is already in Splunk. For instance, IIS status code descriptions or Cisco error code descriptions. - Tags: A flag you can add to any knowledge object. Usually a categorization of different knowledge objects.
Event types are one of the fundamental building blocks within Splunk, and without them administration can become increasingly cumbersome and people won't be able to familiarize themselves with the events within a system. There are two different ways to create an event type within Splunk.
We can create an event type by leveraging the Splunk UI and simply saving the relevant events as an event type we create.
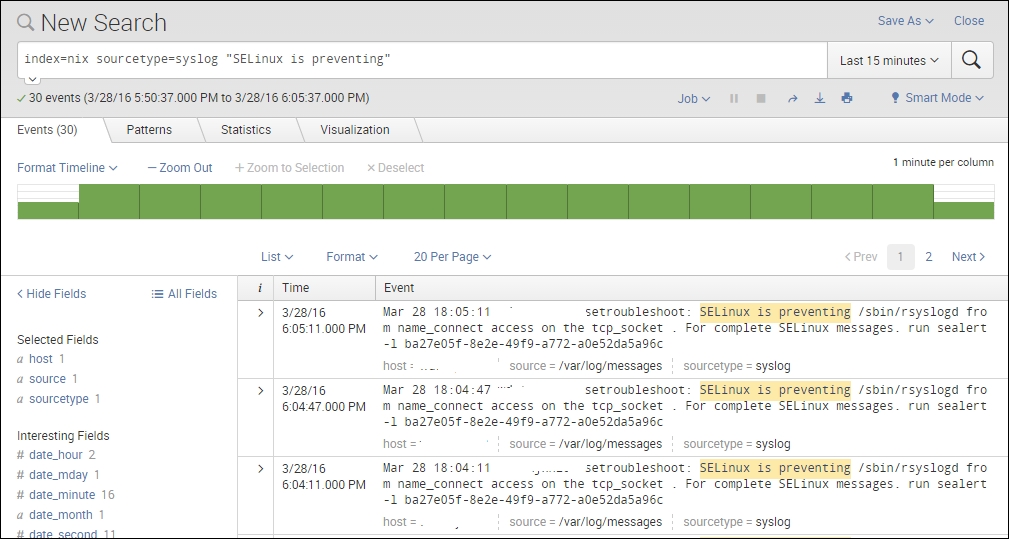
To do this, we must first have a root search for the event types we want to see. In this example, we will use Linux syslog data.
In our root search, you can see that we have started focusing on the data that we really want and that we have received all of the events that show Linux is preventing access to a device.

The next thing we can do, once we have the root search, is click on the Save As button in the top-right corner and click Event Type:

Now, when we do that, it will ask us how we want to name our event. With knowledge objects it is recommended to have a naming convention in order to find knowledge objects in the future with ease.

After you have named your event, click Save. The other options are there if you care to tag, color-code, or adjust the priority of your event type.
When creating an event type through the shell, we still need to understand what the search is to narrow our results to only the events we want.
In this case, we will use the same search as before:
Once we have the search results, we use PuTTY to log in to the backend Linux host and add the event.
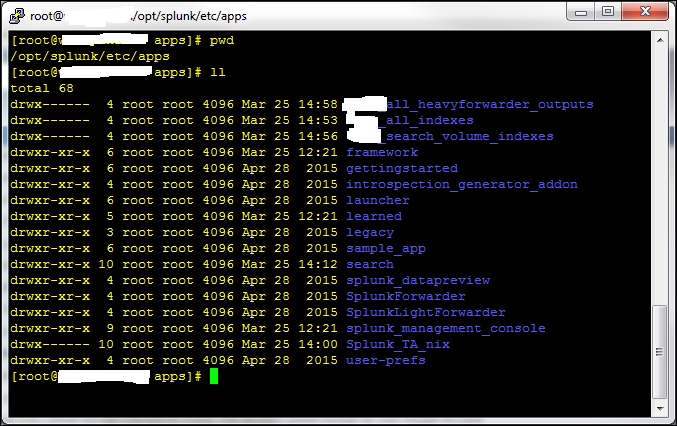
When we log in, we go to the /opt/splunk/etc/apps folder.
We then add the setting:
[myEventtype]
search = index=nix sourcetype=syslog "SELinux is preventing"
Once there, we can decide which app we want to put this in. In most cases, the default search app is adequate.
So, in /opt/splunk/etc/apps/search/eventtypes.conf, we place the following entry:
[myEventtype]
search = index=nix sourcetype=syslog "SELinux is preventing"
This looks like the following screenshot:

We then run the command in the browser to debug/refresh and wait for Splunk to reload its configurations; then, we are ready to use our event type in our search query.
Before going on to field extractions, would this be a good place to reference the capability of leveraging Splunk as a development platform? After pointing out the ability to run searches via the command line, it might be good to at least include a link to Splunk's SDK materials:
http://dev.splunk.com/view/get-started/SP-CAAAESB

Field extractions are values within a log event that we wish to see as part of our results when we search. The most common fields are usually things such as user or src_ip, but as long as we can use RegEx well, we can extract pretty much anything.
There are many ways to create a field extraction within Splunk; however I am only going to focus on two different ways to extract fields and two examples of when to do so.
There are two occasions where we can perform field extractions for Splunk, and there are pros and cons for both.
Pre-indexed field extractions are when we extract fields from our desired data set before we write the data to disk. This is usually done on either a heavy forwarder or an indexer before data is sent to the Indexers to write:
- Pros:
- Increases performance at search time
- Cons:
- Destructive write to disk
- Consumes resources on device (Indexer/Heavy Forwarder)
- High administrator overhead
It is recommended that this type of extraction is only used if the search heads are over-utilized in their running state. If this type of extraction must be done, then make sure that you are extracting the data from every event type you want before you write it to disk. There is no going back once you write this data to disk, unless you clean the index itself.
Search time field extractions are the most common way to extract value from your data. This type of extraction can be done in the query bar with a rex command or in props.conf and transforms.conf. Splunk also has an easy interface that can be used when performing this type of operation called the Interactive Field Extraction (IFX) tool. This tool is pretty easy to use, although there are things that it will miss no matter how hard you try. It's better to simply learn RegEx itself and make your own extractions.
- Pros:
- Ease of use
- Flexibility of operation
- Low administrative overhead
- Non-destructive
- Cons:
- Can affect search performance negatively for users when the volume of extractions reaches thousands of fields
It's highly recommended that you use search time field extractions not only due to their flexibility, but also their non-destructive nature. If you mess up your RegEx, you can simply change it and Splunk will just pull out the new value while reading data from the indexers.
We cannot use the UI to create an index time field extraction. We must use a series of props.conf and transforms.conf settings in order to enable this type of extraction.
Let's take a syslog event and try it out.
Here's our data:
Mar 31 17:56:59 myHost postgres[13011]: [178005-1] postgres postgres localhost 13011 2016-03-31 17:56:59 EDT SELECTLOG: duration: 0.435 ms
We want to extract the duration field from this data. There's a key question to ask before we extract this data.
Is the duration only measured in MS or does ms change values to minutes and hours dependant on actual duration?
The answer to that question will adjust your RegEx considerably and may make the extraction itself next to impossible. For our case, let's say that this field is always measured in ms.
First, we need to make sure that our extraction works, so we would use the RegExr tool to confirm that it matches what we want:

So, now that we have our extraction, we need to go to our indexer (or cluster master or heavy forwarder, depending on your architecture) and add that RegEx to our Transforms.conf under a new stanza:
Transforms.conf
[syslog_duration]
REGEX = duration:s(?<duration>[^ ]+)
FORMAT = duration::"$1"
WRITE_META = true
After we have created this entry, we then need to call that transform from our Props.conf in the same folder, under the appropriate sourcetype stanza.
Props.conf
[syslog]
TRANFORMS-duration = syslog_duration
And finally, when we have set our Props.conf appropriately, we need to enable the indexer to actually write this field to disk itself. We do this with a setting in fields.conf, which will live in the same folder as the rest of these files. (Usually, that is /opt/splunk/etc/apps/<appname>/local.)
Fields.conf
[duration]
INDEXED = true
We will need to repeat these steps for all fields that require index time extractions.
We can create search time field extractions in a few different ways. We can use RegEx in the query bar, via a | Rex command, we can use the interactive field extractor (IFX), or lastly we can adjust props.conf / transforms.conf ourselves manually. There are likely more methods available, which other fellow Splunkers will remind me of, but here I will only focus on two ways of performing search time field extractions.
For this example, we are going to use syslog data and see if we can extract a field from it.
Here is a string from our data:
Mar 29 17:14:58 myHostName rsyslogd-2177: imuxsock begins to drop messages from pid 31881 due to rate-limiting
In the previous example data , we want to extract the pid field using the UI. To do this, we click on the little arrow next to the event in Splunk and then select Extract Fields from the Event Actions menu:

When we do that, Splunk takes us to the IFX tool that Splunk developed.
Here, we can highlight our desired field value, and Splunk will write a RegEx to match and extract that field for us:

When you've highlighted the appropriate field value and named your field, you can click through the Validate fields and then finally to the Save part of the extraction process:

Here, you can see the long Regular Expression part of this section. This is the actual RegEx code you are using to extract the field.
It would be a good idea to point out where field extractions performed via the IFX are stored in Splunk. I often use the IFX as a first attempt at field extraction, which I then refine. It can be helpful to know where that original props is sitting in order to use it as a template, or make sure that I remember to delete it.
While sometimes Splunk's IFX works well, in some instances it is necessary to manually generate the field extractions, which takes someone who is highly proficient with RegEx.
If you are a Splunk admin and you're not familiar with RegEx, familiarize yourself as quickly as you can - you will need it.
Creating these through the CLI is a bit different, but often much more effective in extracting just the fields that you want. We will use the same previous example data, and instead of using the IFX we will copy this out to a web-based RegEx pattern matcher to extract our field.
We copy this data out:
Mar 29 17:14:58 myHostName rsyslogd-2177: imuxsock begins to drop messages from pid 31881 due to rate-limiting
And paste it into the content box at http://www.regexr.com/ .

We begin writing our RegEx to match our desired field value and extract only the values we want. In this case, we will use the RegEx pids(?<pid>d+):

And we will then place that in the props.conf file in /opt/splunk/etc/apps/search/ under the appropriate source type:

When we have placed that setting, we then do a soft refresh of the search head, like before; when it's done we will have our new field.
