Chapter 3
Transport
Tim Chatterton1, Mark Fisher2, Miles Keeping3 and David Shiers4
1University of the West of England, Bristol, BS16 1QY, UK
2Arup Associates, London, W1T 4BQ, UK
3Hillbreak Ltd., Buckinghamshire, HP18 9TH, UK
4School of the Built Environment,, Oxford Brookes University, Oxford, OX3 0BP, UK
The environmental impact of transport is highly significant. In the United Kingdom for example, 23% of greenhouse gas emissions (117.9 MtCO2e in 2014) was attributed to transport, the second largest sector after energy supply from the burning of fossil fuels; gas, coal and oil (31%). Over 98% of this is emitted directly as CO2, rather than other greenhouse gas species (DECC, 2016). Across Europe, overall greenhouse gas emissions decreased 15% between 1990 and 2007, whilst emissions from transport increased by 36% (DG-CLIMA, 2016). Declines since 2008 are largely attributable to the global recession. Despite some optimism that this might have started a permanent downward trend (e.g. discussions about having reached ‘peak car’ (POST, 2013)), there are signs that emissions from this sector are on the increase again (DECC, 2016; Figure 3.1).
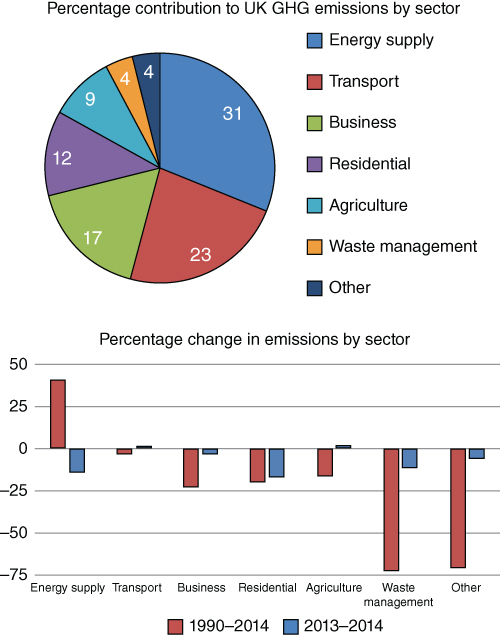
Figure 3.1 Greenhouse gas emissions in United Kingdom.
Source: Government of Japan; http://www.mlit.go.jp/kokusai/MEET/data_en.html.
Emissions from transport are primarily caused by the combustion of fossil fuels to provide energy for generating motion, either directly, as with internal combustion engines (ICEs) in road vehicles or jet engines, or indirectly in power stations to generate electricity for plug-in vehicles or electric trains. It is not just emissions of greenhouse gases that are of concern. Transport emits a wide range of ‘conventional’ air pollutants (including nitrogen oxides (NOx), particulate matter (PM), Sulphur dioxide (SO2), volatile organic compounds (VOCs) and carbon monoxide (CO)). These pose a wide range of health risks, both in urban areas where transport sources are concentrated and emission levels become very high, or outside urban areas where they contribute to levels of regional pollution (especially particulate matter and ozone (O3)).
In the United Kingdom, over 96% of over 700 declared Air Quality Management Areas are related to transport (and predominantly road transport) (Defra, 2016). Whilst air pollution has historically been associated with respiratory problems, increasingly it has become linked to cardiovascular problems (e.g. heart attacks) as efforts to clean up more visible pollutants like soot and smoke have resulted in a greater number of very fine particles that are so small that they can pass through the lung wall into the blood stream. Currently, the annual estimate for deaths related to air pollution in United Kingdom is around 50,000 (Holder, 2014, Environmental Audit Committee, 2010), and around 600,000 across Europe (WHO, 2015). This is compared to between 1713 and 3450 deaths annually between 2000 and 2013 from road traffic accidents (RTAs). Transport-related air pollution in United Kingdom is estimated to reduce also the average life span by seven to eight months, though this is very unevenly distributed and some sections of the society are likely to be exposed to greater amounts and lose more (Barnes and Chatterton, 2017; Chatterton et al., 2016).
Emissions and RTAs are not, however, the only health and environmental risks from transport. Noise is perhaps the next greatest concern, with recent indication that 55% of those living in urban areas in the EU-27, almost 67 million people, endure daily road noise levels defined as excessive (EEA, 2009). It is estimated that noise from rail and road transport is linked to 50,000 fatal heart attacks every year and 200,000 cases of cardiovascular disease in the EU (Transport and Environment, 2008). These health effects are caused by the body’s stress reaction to persistent noise leading to increased hormone levels of adrenaline and cortisol leading to increased risks of hypertension, stroke, heart failure, and immune problems (Mead, 2007; Figure 3.2).

Figure 3.2 Growth of road traffic in United Kingdom.
Transport can also have crucial social as well as physical health impacts (though these often intersect with each other). Transport corridors can significantly impact on the quality of public space, both in urban and rural areas. This can have impacts on both the general well-being of local residents, and their physical health, through marring their mood to take physical activity. In his seminal book, Livable Streets,1 Donald Appleyard () presented evidence from San Francisco on the extent to which the amount of traffic on residential streets leads to the breakdown (or failure to establish) of social relations, affecting people’s entire sense of place.
See a video on this work by Streetfilms:
This work was revisited in Bristol, United Kingdom, in 2009 and the findings were found to be just as valid (Hart and Parkhurst, 2011).
Whilst the impacts described earlier have been outlined mainly in terms of road transport, this is because it hurts significantly far more people due to its pervasive nature. Many of the same effects are just as applicable to other forms of transport such as rail, aviation and shipping (Figure 3.3).

Figure 3.3 Conversion factors used to estimate carbon emissions from various forms of transport, including air freight (2011).
Alternative Fuelled Vehicles
As discussed earlier, the impacts of most concern regarding transport are normally those associated with fossil fuel use (e.g. air pollution, carbon emissions and to some extent noise). There can often be conflicts between the management of air pollution and greenhouse gas emissions from transport (Defra, 2010, Tiwary et al., 2014), with methods to reduce one type of emission sometimes leading to greater emissions of the other (unless the option is to reduce transport activity levels overall). Despite evidence that predictions of transport growth appear to have been unreliable for some time, forecasts for road traffic growth, in United Kingdom at least, are for significant expansion, and therefore much effort is being put into trying to address these problems through technical means rather than through demand management (which at best is seen only as a way of slowing this growth) (Figure 3.4).

Figure 3.4 UK Government Department of Transport car traffic growth forecast.
Source: DfT & Goodwin 2012.
One of the main ways for addressing these issues is through the replacement, fully or partly, of fossil fuels with ‘alternative fuels’. These might consist of fuels which are cleaner in terms of air pollution (e.g. liquid petroleum gas (LPG), or compressed natural gas (CNG) instead of petrol or diesel), fuels which, theoretically, might have a lower climate impact over their lifecycle (e.g. bio-diesel, bio-ethanol or bio-gas as replacements for conventional diesel, petrol and CNG), or fuels that emit no pollutants at point-of-use (e.g. electricity – though this may lead to emissions overall depending on how it is generated).
The infrastructure necessary for fuelling the 35 million vehicles registered for use on the roads in United Kingdom has developed over more than a century. Along with the fact that the average life of a vehicle is over 10 years and thus fleet turnover is very slow (though not as slow as with building stock) this means that efforts to decarbonise the vehicle fleet entirely (Committee on Climate Change Fourth Carbon Budget) will happen quite slowly.
Alternative Fuels
The term ‘alternative fuel’ is generally used to describe any means of powering transport that is not conventional petrol or diesel. This generally covers gas, biofuels and electricity. It is worth noting, however, that diesel has been considered to be a low carbon alternative to petrol and has been pushed heavily in United Kingdom for over a decade. This started in the early 2000s with the Blair government’s changes to Vehicle Excise Duty to make it based on CO2 emissions, which favoured diesel vehicles. Between 1994 and 2012 the percentage of diesel cars in the UK fleet increased from 7.4% to 32.7%.
Despite concerns raised early on about potential air pollution impacts due to the higher emissions of nitrogen oxides and particulate matter from diesels compared to petrol vehicles, these were largely ignored and have led in part to the widespread exceeding of the European air quality values that we experience today.
Various forms of gas are the next most common alternative fuels, predominantly CNG and LPG. These are generally used on converted spark ignition petrol engines, although CNG which is most common on larger vehicles can be used on converted diesel engines either by introducing a spark ignition system or running a bio-fuel system using diesel as an ignition source.
The term bio-fuels covers a range of fuels, primarily bio-ethanol, bio-diesel and bio-gas, that replace petrol, diesel and natural gas respectively. These can be used as a 100% replacement, but due to variability in fuel quality and issues with engine design, these are most commonly used as a blend with conventional fuels. Current road fuel standards (since 2013) in United Kingdom allow for up to 10% of petrol sold at the pump to contain bio-ethanol, though this must be labelled ‘E10’ and a lower mix of 5% ethanol sold alongside it for vehicles which have compatibility problems with high levels of bio-fuel.
Bio-fuels are being increasingly used in trains,2 shipping3 and aviation4 although levels of uptake are still very low. Significant carbon savings were initially anticipated from bio-fuels due to the theory that they would be ‘carbon neutral’ because of the CO2 released on combustion having been recently absorbed from the atmosphere by the plants it was made from. However, emissions associated with the manufacturing process, delivery of fuels and the conversion of land to grow fuel crops mean that a complex life-cycle assessment needs to be undertaken to ensure they are actually more sustainable than conventional fuels (and in many cases it is not clear that they are). Similarly, with conventional air pollutants, they do not always provide a clear-cut improvement on conventional fuels. Bio-fuels can be divided into first- and second-generation bio-fuels. First-generation bio-fuels are made from sugars and vegetable oils in arable crops grown for the purpose. Second-generation bio-fuels, which tend to be more sustainable, can be made from woody crops, agricultural residues and waste.
Electricity has a long history as a transport fuel. It has been used to power trains, buses and trams through overhead wires or third rails since the 19th century. Also, many trains that we might consider to be diesel powered are actually diesel-electric trains used as diesel engine to turn a generator to send power to an electric motor (similar to some hybrid vehicles – see below). Electric cars were also quite common in the late 19th and early 20th Centuries until decreasing costs of petrol production pushed them out of the market. Electric vehicles (EVs) come in two main categories, pure EVs, which operate on a battery which needs to be charged from an external source, and hybrids, which operate on a combination of an electric motor and a conventional (usually petrol or diesel) ICE.
There are a wide variety of ways in which hybrid vehicles can operate. Primarily these are using the ICE as the main source of power and the electric motor to increase torque, using theelectric to drive the vehicle and an ICE to generate electricity for it, and thirdly, switching between using the ICE and electric motor to drive the transmission depending on both driving conditions (e.g. urban or motorway) and available battery charge. There are also Plug-In Hybrids which can charge from the mains allowing them to operate mainly as a pure EV. Whilst EVs are of great benefit to air pollution (being largely zero-emission at point-of-use) their carbon benefits are very dependent on two key factors. Firstly, for plug-in vehicles, how the electricity used to charge them is generated5 as emissions varies hugely in respect of coal-fired Power Station’s gas generation and renewables. Secondly, the more complex manufacturing required for electric motors and batteries. Recent studies have suggested that in United States, battery electric cars generate half the CO2 emissions of the average comparable petrol car. Better – but still some way off ‘zero-emissions’.
Currently, the UK government is aspiring that every new vehicle sold be electric by 2040. However, even with a recent surge in purchases, in 2014/2015 sales still only reached 1% of all vehicle sales for the first time. It is not just the desirability of EVs that might affect the levels of uptake, however; there are concerns about both the quantities of lithium required for batteries and about the amount of electricity necessary to power them.
Ultimately, it is hard to see how current predictions for transport growth can be achieved sustainably, and demand management will need to play a much greater role in transport policy, through changes to land-use policies, re-thinking how we currently engage with transport intensive activities (including going to work) and replacing travel with virtual mobility that is through the use of Internet conferencing and so on.
The 1990s saw a significant change in Europe in approaches to reducing air pollution. Previously, ‘pollution control’ measures were used to focus efforts on reducing the amount of emissions that came out of individual chimneys (both industrial and domestic). Due to the increasing success of this approach in controlling problems associated with these point sources, and because of the increasing pollution problems caused by growth in road transport, a new approach to ‘Air Quality Management’ was introduced. This came about in United Kingdom through Part IV of the 1995 Environment Act and across Europe through the 1996 European Air Quality Framework Directive (96/62/EC) and related Daughter Directives (now replaced by the 2008 Air Quality Directive (2008/50/EC)). This change consisted of supplementing existing emission controls, with a set of health-based targets for the concentration of pollutants in ambient air (see Longhurst et al., 2009 for a full discussion). Moving to a system based on ambient concentrations of pollutants had two main drivers. First, it allowed the management of problems arising from ‘diffuse’ sources of pollution such as traffic, where large numbers of low-emitting sources lead to a significant cumulative problem. Secondly, it more directly links air pollution problems to health risks, meaning that high levels of pollution within built-up areas with poor dispersion and high numbers of people exposed, are considered a more important problem than similar levels of emissions, for example, on a motorway passing through a sparsely populated area. But, as highlighted above, this puts it at odds with the management of greenhouse gas emissions, where location of emissions is irrelevant.
The UK legislation, and the national air quality strategies that followed from it, established a two-tier framework for action. At a national level, responsibility for air pollution resides with the Department for Environment, Farming and Rural Affairs (Defra). Two main criticisms have been targeted at national policy. Firstly, there is little evidence of ‘joined-up government’ and although Defra have responsibility for assessing and improving air quality, there has been poor integration with other relevant departments (such as Department for Transport, Department for Health and Department for Communities and Local Government (planning)). Arguably, it is these departments that have much greater scope for implementing policies and interventions to improve air quality. Secondly, national policy has relied almost entirely on improvements to engine emissions through European policy on ‘Euro emission standards.’ These regulations have not been as successful as anticipated at reducing vehicle emissions under real world driving conditions (as opposed to laboratory tests c.f. the Volkswagen ‘emissions scandal’6). This problem is worst in diesel vehicles, which, as described earlier, enjoy high incentives in United Kingdom. In the absence of a real push to reduce road transport from the government over the last two decades, this has largely led to a flat lining in pollution after initial significant gains were made in the early 1990s through the introduction of three-way catalytic convertors under the ‘Euro 1’ standards.7 It is national government that is tasked with reporting on air pollution to the European Commission and complying with air quality ‘Limit Values’ under the various EU Directives.
At a local level in the United Kingdom, action on assessing and improving air quality is undertaken under the ‘Local Air Quality Management’ process established by the 1995 Environment Act. The specific requirements of the Act are elaborated in Technical and Policy Guidance for local authorities, and the task of environmental health officers at the level of District or Unitary authority. As with national government, this means that air quality policy ends up poorly integrated with transport policy generally, resulting in considerable knowledge about the extent and nature of air pollution problems, but little in the way of successful action (see Olowoporoku et al., 2009). This lack of integration is further compounded by air quality being given little political attention and receiving little in the way of resources from national government to match responsibilities. Also, although there is a legal requirement to undertake regular reviews of air quality, there has been no clear legal need for LAs to actually achieve AQ targets (although the 2011 Localism Act has now, controversially, enabled EU fines for non-compliance to be passed down to local authorities).
In the Brazilian city of Curitiba, the benefits of an integrated low environmental impact transport system and thoughtful urban growth policies can be clearly seen. Dedicated rapid transit bus lanes and tram services provide an efficient transport system which is used by 80% of travellers in the cityhttp://www.bbc.co.uk/schools/gcsebitesize/geography/sustainability/sustainable_living_rev4.shtmlhttps://www.youtube.com/watch?v=r4sumpEqnlYhttps://en.wikipedia.org/wiki/Rede_Integrada_de_Transportehttp://www.reimaginerpe.org/node/344
Although new transport infrastructure is sometimes seen as a ‘necessary evil’ which results in significant negative environmental and community impacts, public transport is necessary to provide social and economic sustainability and growth. The challenge, as always, is to minimise harmful effects whilst providing ‘enabling infrastructure’ which will bring the desired economic and social benefits (Figure 3.5).

Figure 3.5 Trends in transport CO2 emissions: 1980–2030.
For example, in the construction of the new Road and Rail transport route through the Kösching forest, near Ingolstadt, Germany, a potentially large environmental impact was reduced through the use of a Road-Rail Parallel Layout. This approach was also adopted in the 1984Paris-Lyon high-speed rail route project which achieved a 14% parallel layout with the highway. In 2002, the Cologne-Frankfurt high-speed rail link delivered a 70% parallel development, drastically reducing the scheme’s environmental footprint (https://en.wikipedia.org/wiki/Environmental_impact_of_transport; https://en.wikipedia.org/wiki/K%C3%B6ln%E2%80%93Frankfurt_high-speed_rail_line).
The development of CTRL Stratford/Stratford International in London and at Ebbsfleet International, Kent are both projects which demonstrate the transformative power of transport hubs when used as enabling infrastructure.
The High Speed 1 rail link project and the design of the Stratford and Ebbsfleet stations was devised within the wider context of the Master Planning proposals for East London and the North Kent area of southern England. In 1991, then Secretary of State for the Environment, Michael Heseltine, identified the East Thames area as being in urgent need of large scale regeneration and had called for the creation of a ‘linear city’ of 575,000 new homes (http://www.building.co.uk/news/the-wasteland/1020280.article).
Subsequent initiatives by both central and local governments failed to generate the necessary funding for the large-scale regeneration of East London or the transport links originally envisaged until the proposals for a High Speed rail link to the Channel Tunnel. Even at that time, when still in its very early stages of development, the new route was seen mainly as a means of improving transport links to the Channel Tunnel. However, Arup saw the regeneration potential of a new train track and stations in East London and its possible role in the Thames Gateway project. Arup developed the concept of a commuter rail capability interspersed with international trains, involving the regeneration of three areas: Ebbsfleet in north Kent, Stratford in East London and St Pancras in central London. The introduction of wider private sector interests and the Government contribution of political support essentially shaped the project’s feasibility. The new transport hub of Stratford was later to be key to the successful bid for the London 2012 Olympic Games.
Commencing in 1996, work on the track, the tunnel, the stations and some of the associated regeneration workwas already well advanced when the Olympic Committee came to United Kingdom in 2005 to review the London bid.
The weakness of the bid had always been seen as the perceived poor transport links between East London and the centre of the city, but when the International Olympic Committee came to visit in February 2005, they were driven in Land Rovers through the almost completed tunnel from Stratford to central London (http://www.futurevents.com/projects/london2012.html).
The event showed how near East London was to the city centre and how fast the future transport link would be between St Pancras and Stratford. The 4.7 mile/7.5 km journey took about half an hour by Land Rover but would take just 7 min on the specially purchased Japanese bullet trains to be known as the ‘Javelin Shuttle’. The drive through the tunnel would prove to be a memorable event and the IOC was, it seems, won over; London was awarded the Games in July 2005. Subsequently, the transport planning for the London 2012 Olympics was deemed to have been a success (http://www.theguardian.com/uk/2005/feb/17/transport.Olympics2012).
Arup worked together with fellow shareholders Bechtel, Halcrow and Systra to set up Rail Link Engineering (RLE) in 1994 to design and project manage the 109 km high-speed railway.
Arup's involvement with High Speed 1 dates back to 1989, when it developed an alternative route for a link between London and the Channel Tunnel to that proposed by British Rail. The 'Arup Alignment' – approaching London from the east via Stratford – embraced the need for the link to connect with the Europe-wide high-speed rail network and help to regenerate areas of north Kent and east London.

The railways we are putting in now will last for centuries to come, so we need to get them right.
http://video.arup.com/?v=1_ym5hvs7z Rail and Arup, presented by Colin Stewart.
Source: Image courtesy of Arup Associates.
High Speed 1:
- Involvement of over 1600 Arup staff.
- Required tunnelling beneath 2600 properties, 67 bridges, 12 km of surface railway, 600 pipelines and 4 London Underground stations.
- Rejuvenated the Grade 1 listed St Pancras station
- Crossed the River Medway on the longest-span, high-speed rail viaduct in Europe.
- Soil from the excavations was used to help the link to sit unobtrusively low in the landscape.
- Created 250 ha of new native woodland around the line.
- Completed on time and within budget.
- Helped to bring in over £10 billion of regeneration investment to create new development in Stratford, King’s Cross/St Pancras and Ebbsfleet.
Ebbsfleet International
- Created 420 ha of urban regeneration
- Led to the building of 10,000 new homes/5.5 m sq. ft. of commercial space
- GBP £300 million infrastructure project
Stratford International
- Created 132 ha of urban regeneration
- Acted as a catalyst for 3,200,000 m2 of mixed-use development
- GBP £1.4 billion infrastructure project
- 4.5k new homes and 45k jobs predicted over 20 years.
The principal challenges:
- Designing two stations whilst working within a political context and managing the systemic challenges of collaboration in large-scale infrastructure projects.
- The revitalisation and regeneration of an urban area through improved infrastructure.
- Making transport more sustainable including enhancing accessibility to the existing transport system and improving links to two major new transport hubs.
- The High Speed 1 project was to involve not only many technical challenges, but also changes in ownership and investor interests throughout the development process. The costs of the project were to come under particular scrutiny and required the designers to ensure that their proposals met often very exacting cost targets.
The station projects were undertaken using a form of contract which meant that the consortium was required to complete the work within a fixed budget. Under the terms of such contracts, the financial risk of overruns and/or additional costs are normally borne by the consortium contractors.
Although Arup had already prepared costed detailed design proposals for Stratford and Ebbsfleet, once the project was given the final go-ahead, very challenging new financial constraints were introduced by the project management team. If the project was to retain its design-led approach, the design team would have to incorporate a new, higher level of design discipline. At one stage in the project, the cost of the original Arup design proposals had to be reduced by some 20% of their original budget. This stricter approach to project costs led to greater functionality being achieved and elements of the building simultaneously acting in different ways in order to create better value.
The layouts for both Ebbsfleet and Stratford were designed around an atrium where light floods in and spaces can be naturally ventilated, reducing energy capital and running costs and allowing smoke out in the event of a fire. These atria also provide orientation and legibility as the stations are not then relying on signage to direct people; passengers are naturally drawn to the train by the ‘intuitive wayfinding’ of the phototropic emphasis of the light pools. All of these features are achieved primarily by the architecture of the scheme, thus minimising reliance on expensive artificial lighting, signage and environmental control systems.

Sketch section through Stratford station: atrium light pools.
Source: Image courtesy of Arup Associates.
The project also illustrates the importance of architects fully understanding the technical challenges and cost implications of their ideas. Being able to justify designs as cost effective enables the architect to control the quality of the project and to retain the trust and confidence of contractors and clients, thus ensuring that the approach remains ‘design led’. This is particularly important in the case of transport engineering projects where the specialist nature of the technical elements often takes the project down the Design and Build pathway.
As part of the ‘value engineering’ process, the two stations; Stratford and Ebbsfleet, were designed as a pair to give greater economy of scale. Whilst having dissimilar demand profiles, the stations share similar peak passenger flows and key functionality common denominators. They were therefore conceived as ‘twin’ stations based on a prototypical design, maximising efficiencies in design development and procurement. Architecturally, each station is composed of horizontal and vertical planes wrapped around a central atrium, which draws light and passengers down to platform level.

Sketch sections: circulation & legibility.
Source: Image courtesy of Arup Associates.
In the design of stations, there are two basic typologies, the first being to have trackside core concourses and the second, to position the core concourse above the tracks.

Sketch plans of station typologies: bridge (central) core/concourse versus trackside (edge) core/concourse.
Source: Image courtesy of Arup Associates.
In the case of Stratford, it was felt that as a regeneration project, the concourse should be located on a bridge above the tracks, as this better linked the community together. However, this ‘bridge solution’ carried a cost premium of around £5 m. Fortunately, not all aspects of value engineering are about arriving at the cheapest solution but rather as Ove Arup himself said, obtaining best value; ‘…the ratio between what is obtained, and what is expended’. The argument that the new station at Stratford had an important role to play as a community thoroughfare, linking the two sides of the railway, was therefore to eventually win the day and the bridge solution was adopted, facilitating easier pedestrian flows into the heart of Stratford town centre.
The tunnel boring machines dumped spoil to form the landscaping for the new development of the Westfield shopping centre and the Olympic Park. This meant no massive transportation of spoil away from site which would have been a huge transport environmental impact. Instead, the spoil became regeneration enabling works.

Sketch plan: circulation pattern.
Source: Image courtesy of Arup Associates.

Section through Stratford station. The station was conceived as a bridge structure connecting the two sides of the box and uniting the two halves of the growing community, continuing as a pedestrian spine into the heart of Stratford town centre and the Lea Valley beyond.
Source: Image courtesy of Arup Associates.
A lot of High Speed 1 is underground in London; so a large, open zone was needed for emergency evacuation and in order to provide for the removal of smoke in the event of a fire and general fumes on a day-to-day basis.

Sketch section: natural ventilation and smoke extraction.
Source: Image courtesy of Arup Associates.
Stratford International sits centrally over a deep concrete box structure connecting the tunnel sections at either end. The box is 1 km long, 26 m deep and up to 55 m wide with access provided down to platform level via escalators.

Model of Stratford station.
Source: Image courtesy of Arup Associates.
The track layouts were a ‘given’ (as designed by Systra and the rail companies) but were different at Stratford from those at Ebbsfleet, resulting in different-sized platforms, structural spans and column grids and so on. Arup, therefore, had to design a structural system which could be adapted to both stations.

Ebbsfleet: concourse slab support.
Source: Image courtesy of Arup Associates.

Stratford: top-down structural sequence.
Source: Image courtesy of Arup Associates.
At Ebbsfleet, the atrium provides visual connectivity unifying the different stages of the journey and enhancing the ability to navigate intuitively around the station. Glazed walls offer spectacular views over the track level and trains rushing through at high speed.
Primary points of circulation and decision-making are emphasised by natural daylight.
Ebbsfleet International sits over a rail cutting with escalator access provided down to platforms within a central atrium.


Sections through Ebbsfleet station.
One of the project’s main objectives was to stimulate the regeneration of the Thames Gateway region including a planned mixed development of light commercial, office and residential around Ebbsfleet station. The new station comprises both high-speed domestic commuter and high-speed international services with interchange to fast-track buses, taxis and up to 9000 car parking spaces providing an extensive park-and-ride facility.

Ebbsfleet station and its new park-and-ride provision.

Ebbsfleet station entrance.
High-quality, durable materials have been used to provide a calm and legible visual environment as a neutral backdrop to the dynamic of people and train movements.
Glass, steel and natural stone are used to define the horizontal and vertical planes of the enclosure.

Inside Ebbsfleet station.
Source: Image courtesy of Arup Associates.
A low-energy environmental control strategy has been adopted for both stations. Protected from the weather by an inflated ETFE roof, the atrium divides the station into shallow floor plates which can be naturally ventilated.
Natural ventilation devices are integrated into the fabric of the building with the external glazed walls extending up beyond the flat roof to form a ventilated parapet. With no requirement for mechanical ventilation, the overall building envelope was reduced in height by 2 m.
As catalysts for regeneration, the stations had to create a strong presence within the surrounding areas. The stations have large expanses of glass to maximise visual permeability by day and announce themselves as illuminated boxes as seen at night. Simple geometric forms have been adopted for the enclosures so as to make the stations clearly legible from a distance. A strong horizontal plane roof extends to either end to form welcoming porte-cochere entrances.

Concourse at Ebbsfleet.
Source: Image courtesy of Arup Associates.
Designs are flexible and intended to be able to absorb future increases in passengers. Predictive programme software is used to estimate future space requirements taking into account local population growth, increased demand from expanding businesses and so on and Arup, Halcrow, Raillink all had input into the design of these modelling tools.
Such software can provide estimates as far forward as 2026. In the next 15 years, passenger demand is expected to grow 20%.
At present, both stations are primarily meeting local demand, as there is not much international traffic. However, Crossrail is coming and so may increase the population of these areas and, therefore, the demand for international transport.
HS1 has received many awards as a major project in a range of categories including engineering, construction, architecture, environment, safety, transport, property, planning and retail, including the following:
- 2007 British Construction Industry Awards Highly Commended Major Project
- 2008 National Transport Awards – Outstanding Project of the Year
- 2008 Sustainable Communities Awards – highly commended in the sustainable development category
- 2008 Institute of Civil Engineering Brassey Award for Ebbsfleet International – Structural Project Category
Bibliography
- AA (2017) Helping cut carbon and reduce greenhouse gas emissions from transport, The Automobile Association 22nd May 2017 http://www.theaa.com/motoring_advice/news/biofuels.html (accessed 12th June 2017).
- Appleyard, D. , Gerson, M. S. , and Lintell, M. (1981). Livable Streets, Protected Neighborhoods . University of California Press. https://books.google.co.uk/books?id=pfreUQKD_4QC&redir_esc=y (accessed 12 June 2017).
- ATAG (2017) Passenger Biofuel Flights, Air Transport Action Group. http://aviationbenefits.org/environmental-efficiency/sustainable-fuels/passenger-biofuel-flights/ (accessed 12th June 2017).
- Barnes, J. and Chatterton, T. (2017) An environmental justice analysis of exposure to traffic-related pollutants in England and Wales. WIT Transactions on Ecology and the Environment , 210 (12), 431–442. ISSN 1743-3541. Available from: http://eprints.uwe.ac.uk/28882 (accessed 16 June 2017).
- Berkley Biodiesel (2017) Usage of Bio-diesel Fuel http://www.berkeleybiodiesel.org/usage-of-biodiesel-fuel-a.html (accessed 12th June 2017).
- Brook Lyndhurst (2015) Uptake of Ultra Low Emission Vehicles in the UK: A Rapid Evidence Assessment for the Department for Transport, August 2015 https://www.gov.uk/government/uploads/system/uploads/attachment_data/file/464763/uptake-of-ulev-uk.pdf (accessed 12th June 2017).
- CCC (2013) The Fourth Carbon Budget Review – part 2: the cost effective path to the 2050 target, UK Committee on Climate Change 11th December 2013, https://www.theccc.org.uk/publication/fourth-carbon-budget-review/ (accessed 12th June 2017).
- Chatterton, T. and Barnes, J. (2016) A social and spatial analysis of emissions from private vehicle use in Great Britain. WIT Transactions on Ecology and the Environment , 207, 99–110. ISSN 1743-3541. Available from: http://eprints.uwe.ac.uk/28883 (accessed 16 June 2017).
- Chatterton, T.J. , Anable, J. , Barnes, J. and Yeboah, G. (2016b) Mapping household direct energy consumption in the United Kingdom to provide a new perspective on energy justice. Energy Research & Social Science , 18, 71–87. doi: 10.1016/j.erss.2016.04.013
- Chatterton, T. , Longhurst, J. , Leksmono, N. et al. (2007) Ten years of local air quality management experience in the UK: an analysis of the process. Clean Air and Environmental Quality , 41 (4), 26–31. ISSN 1444–2841 Available from: http://eprints.uwe.ac.uk/8109 (accessed 16 June 2017).
- Chatterton, T.J. et al. (2016a) Mapping household direct energy consumption in the United Kingdom to provide a new perspective on energy justice. Energy Research & Social Science , 18, 71–87. doi: 10.1016/j.erss.2016.04.013
- Clark, A. (2005) Decision makers go underground to ride the route of new rail link. Guardian Newspaper article, Thursday 17 February 2005.
- DECC (2016) 2014 UK Greenhouse Gas Emissions, Final Figures, Statistical Release, UK Department of Energy and Climate Change, February 2016 https://www.gov.uk/government/uploads/system/uploads/attachment_data/file/496942/2014_Final_Emissions_Statistics_Release.pdf (accessed 8 June 2017)
- Defra (2010) Air Pollution: Action in a Changing Climate, Department of Environment, Food and Rural Affairs, March 2010 https://www.gov.uk/government/uploads/system/uploads/attachment_data/file/69340/pb13378-air-pollution.pdf (accessed 12th June 2017).
- Defra (2016) Summary Air Quality Management Area Data, Department for Environment, Food and Rural Affairs. https://uk-air.defra.gov.uk/aqma/summary (accessed 12 June 2017).
- DfT (2013) Vehicle Licensing Statistics: 2012, Department for Transport Statistical Release, 11th April 2013 https://www.gov.uk/government/uploads/system/uploads/attachment_data/file/198753/vls-2012.pdf (accessed 12th June 2017).
- DG Clima (2016) & EC (2017) A European Strategy for low-emission mobility, European Commission http://ec.europa.eu/clima/policies/transport/index_en.htm (accessed 12 June 2017).
- EAC (2010) Environmental Audit Committee Air Quality Fifth Report of Session 2009–10 Volume I, HC 229-I, House of Commons, 22nd March 2010 http://www.publications.parliament.uk/pa/cm200910/cmselect/cmenvaud/229/229i.pdf (accessed 12th June 2017).
- EEA (2009) Turn Down the Noise - Softening the Impact of Excess Transport Noise , European Environment Agency, 25th May 2009 http://www.eea.europa.eu/articles/turn-down-the-noise-2013-67-million-europeans-endure-high-transport-noise-exposure (accessed 12 June 2017).
- ETIP (2017) Use of Biofuels in Shipping, European Technology and Innovation Platform: Bioenergy. http://biofuelstp.eu/shipping-biofuels.html (accessed 12th June 2017).
- Goodwin (2012) ‘Peak Car’ Where did the idea come from? And Where is it going?, Presentation for Centre for Transport and Society Winter Conference 2012 http://www2.uwe.ac.uk/faculties/FET/Research/cts/projects/reports/WC2012_goodwin_peak_car.pdf (accessed 12th June 2017).
- Hart, J. and Parkhurst, G. (2011) Driven to excess: impacts of motor vehicles on the quality of life of residents of three streets in Bristol UK. World Transport Policy & Practice , 17 (2), 12–30. ISSN 1352–7614 Available from: http://eprints.uwe.ac.uk/15513 (accessed 16 June 2017).
- Holder in Air Quality News (2014) UK nitrogen dioxide mortality figures due next year 5th December 2014 http://www.airqualitynews.com/2014/12/05/uk-nitrogen-dioxide-mortality-figures-due-next-year/ (accessed 12 June 2017).
- http://ec.europa.eu/environment/air/quality/legislation/existing_leg.htm (accessed 16 June 2017).
- http://ec.europa.eu/environment/air/transport/road.htm (accessed 16 June 2017).
- http://laqm.defra.gov.uk/supporting-guidance.html (accessed 16 June 2017).
- http://www.airqualitynews.com/2014/06/23/passing-on-eu-fines-to-councils-unfair/ (accessed 16 June 2017).
- http://www.arup.com/_assets/_download/download228.pdf (accessed 16 June 2017).
- http://www.arup.com/_assets/_download/download234.pdf (accessed 16 June 2017).
- http://www.legislation.gov.uk/ukpga/1995/25/part/IV (accessed 16 June 2017).
- http://www.railwaysarchive.co.uk/documents/HS2_RouteEngineeringStudyAppendices_2010.pdf (accessed 16 June 2017).
- https://www.gov.uk/government/publications/the-air-quality-strategy-for-england-scotland-wales-and-northern-ireland-volume-1 (accessed 16 June 2017).
- Hunt, T. (2015) Is There Enough Lithium to Maintain the Growth of the Lithium-Ion Battery Market?, Greentech Media http://www.greentechmedia.com/articles/read/Is-There-Enough-Lithium-to-Maintain-the-Growth-of-the-Lithium-Ion-Battery-M (accessed 12th June 2017).
- Longhurst, J.W.S. , Irwin, J.G. , Chatterton, T.J. , Hayes, E.T. , Leksmono, N.S. and Symons, J.K. , 2009. The development of effects-based air quality management regimes. Atmospheric Environment , 43(1), pp.64-78. 10.1016/j.atmosenv.2008.09.050 (accessed 16 June 2017).
- Mead (2007) Noise Pollution: ‘The Sound behind Heart Effects’ published in Environmental Health Perspectives, 115 (11), A536–537.
- MLIT (2008) World's CO2 Emissions in 2006, Ministry of Land, Infrastructure, Transport and Tourism, Japan http://www.mlit.go.jp/kokusai/MEET/data_en.html (accessed 12th June 2017).
- Olowoporoku, D. , Hayes, E. , Longhurst, J. , and Parkhurst, G. (2009) Managing local traffic-related air pollution in England presentation. http://www.polisnetwork.eu/uploads/Modules/PublicDocuments/managing_local_traffic-related_air_pollution_in_england.pdf and Paper: https://www.researchgate.net/profile/Enda_Hayes/publication/265990201_Managing_local_traffic-related_air_pollution_in_England/links/54ae762d0cf2213c5fe4f175.pdf (accessed 16 June 2017).
- POST (2013) Peak car use in Britain, Parliamentary Office of Science and Technology (POST) briefing document for the Commons Transport Select Committee, November 2013. http://www.parliament.uk/documents/commons-committees/transport/POST-briefing-on-peak-car.pdf (accessed 12 June 2017).
- Shrink That Footprint (2013) The ‘electric cars aren’t green’ myth debunked http://shrinkthatfootprint.com/electric-cars-green (accessed 12th June 2017).
- T&E (2008) Can you hear us? Why it is finally time for the EU to tackle the problem of noise from road and rail traffic, European Federation for Transport and Environment 08/1 http://www.transportenvironment.org/sites/te/files/media/2008-02_traffic_noise_can_you_hear_us.pdf (accessed 12 June 2017).
- Tiwary, A. , Chatterton, T. and Namdeo, A. (2014a) Co-managing carbon and air quality: pros and cons of local sustainability initiatives. Journal of Environmental Planning and Management , 57 (8), 1266–1283. doi: 10.1080/09640568.2013.802677
- Tiwary, A. , Chatterton, T. and Namdeo, A. (2014b) Co-managing carbon and air quality: pros and cons of local sustainability initiatives. Journal of Environmental Planning and Management , 57 (8), 1266–1283. doi: 10.1080/09640568.2013.802677
- WHO Regional Office for Europe, OECD (2015). Economic cost of the health impact of air pollution in Europe: Clean air, health and wealth. Copenhagen: WHO Regional Office for Europe. http://www.euro.who.int/__data/assets/pdf_file/0004/276772/Economic-cost-health-impact-air-pollution-en.pdf?ua=1 (Accessed 12 June 2017)