
CHAPTER 7
Security Selection – Emerging Markets (Hard Currency)
OVERVIEW
This chapter lays out the investment opportunity for emerging market fixed income. Although estimates on the size of emerging market fixed income vary considerably, this is a large and growing area. We will focus on hard currency bonds issued by sovereign and quasi‐sovereign entities. A hard currency bond typically refers to a USD denominated bond issued by an emerging market country. These bonds contain a risk‐free and a risky component, with the risky component being our area of focus. Security selection for credit excess returns in emerging market hard currency shares some similarities with security selection for credit‐sensitive assets generally, but data challenges mean our measures need to be modified. This chapter introduces a set of systematic investment themes and assesses their efficacy individually and in combination for emerging market hard currency bonds.
7.1 WHAT IS THE INVESTMENT OPPORTUNITY FOR EMERGING MARKET FIXED INCOME?
Obtaining clear estimates on the size of emerging market fixed income is difficult. Indices that are used as typical policy benchmarks for asset owners only include bonds that meet stringent index inclusion criteria. Countries are typically included only if the Gross National Income (GNI) is below a certain threshold (distinguishes emerging countries from developed countries). Bonds are typically included only if they are investible. A key use of benchmarks is for relative performance evaluation and/or tracking. If a bond does not trade or capital market participation is limited to foreign investors, then that renders the bond less suitable for benchmarking purposes. Index provider liquidity and investability filters can greatly reduce the size of the emerging market investment opportunity set.
I often use a short annual report from Ashmore Group PLC to introduce emerging market fixed income to students. Using a variety of sources including data from the Bank for International Settlements, Ashmore provides high‐level information on the size of the emerging market (EM) fixed income asset class. Their most recent piece was published in August 2020 (Dehn 2020) and noted that the EM fixed income asset class was $29.6 trillion USD. Local‐currency‐denominated bonds accounts for 82 percent, and the remaining 18 percent consists of what they call “external debt” but we are calling “hard currency.” Government‐issued debt accounts for 44 percent of the total, and the remaining 56 percent are issued by corporates (36 percent by financial corporates and 20 percent by nonfinancial corporates). Governments and corporates account for roughly 50 percent each of the local currency debt, but corporates account for more of the external debt (especially financial corporates). Exhibit 7.1 shows a breakdown of issuance across the largest 15 emerging countries. China is by far the largest issuer of emerging market bonds (52 percent) and that concentration is true for local currency and external debt and for government and corporate issuance.

EXHIBIT 7.1 Country representation in emerging markets fixed income.
Sources: Ashmore (2020) and Bank of International Settlements.
We will focus our analysis on the efficacy of systematic investment approaches in emerging markets fixed income on the JP Morgan Emerging Market Bond Index Global Diversified (EMBIGD). This is a weighted USD‐denominated emerging markets sovereign index. The weighting schema enforces additional diversification than what would be evident if simply using market capitalization weights (a 10 percent cap is applied for each country). Countries are included if they have a rating of BBB or below. Individual bonds need to have a face value of at least $500 million USD, pass certain liquidity filters (bid‐ask spreads and interdealer quote requirements), and have at least 2.5 years remaining to maturity to be added to the index. In addition to sovereign bonds, the index includes bonds issued by quasi‐sovereign entities, which refers to entities that are either fully guaranteed or fully owned by the national government.
Exhibit 7.2 shows a breakdown of the number of sovereign and quasi‐sovereign issuers in EMBIGD over the 2002–2019 period. The cross‐section has grown considerably over the past two decades in line with the overall growth in emerging markets. The EMBIGD had a market capitalization of $203 billion USD in 2002, which has grown to over $1 trillion USD in 2020.

EXHIBIT 7.2 Number of sovereign and quasi‐sovereign issuers of emerging market hard currency bonds.
Source: JP Morgan Emerging Market Bond Index Global Diversified (EMBIGD).
Exhibit 7.3 shows a breakdown of the credit ratings for EMBIGD over the 2002–2019 period. Most bonds are rated BBB and below with a sizable portion not rated (NR). There is a noticeable shift in the ratings distribution in September 2012 when ratings became more widely available for included bonds. Exhibit 7.3 also provides a cumulative count of the number of bonds in EMBIGD. The index has grown from 140 bonds in 2002 to over 750 bonds toward the end of the period.
Exhibits 7.4 and 7.5 show how the distribution of credit spreads and spread duration, respectively, have changed over the 2002–2019 period for EMBIGD bonds. Similar to corporate bonds (Chapter 6), we see counter‐cyclical movements in credit spreads of hard currency emerging market bonds as the credit risk gets larger during challenged economic environments. Spread duration has remained relatively constant over the sample period; the drop in spread duration around the great financial crisis (2008/2009) is attributable to the sudden large increases in spreads (a risky annuity shortens in duration when spreads widen).

EXHIBIT 7.3 Credit rating breakdown of emerging market hard currency bonds.
Source: JP Morgan Emerging Market Bond Index Global Diversified (EMBIGD).
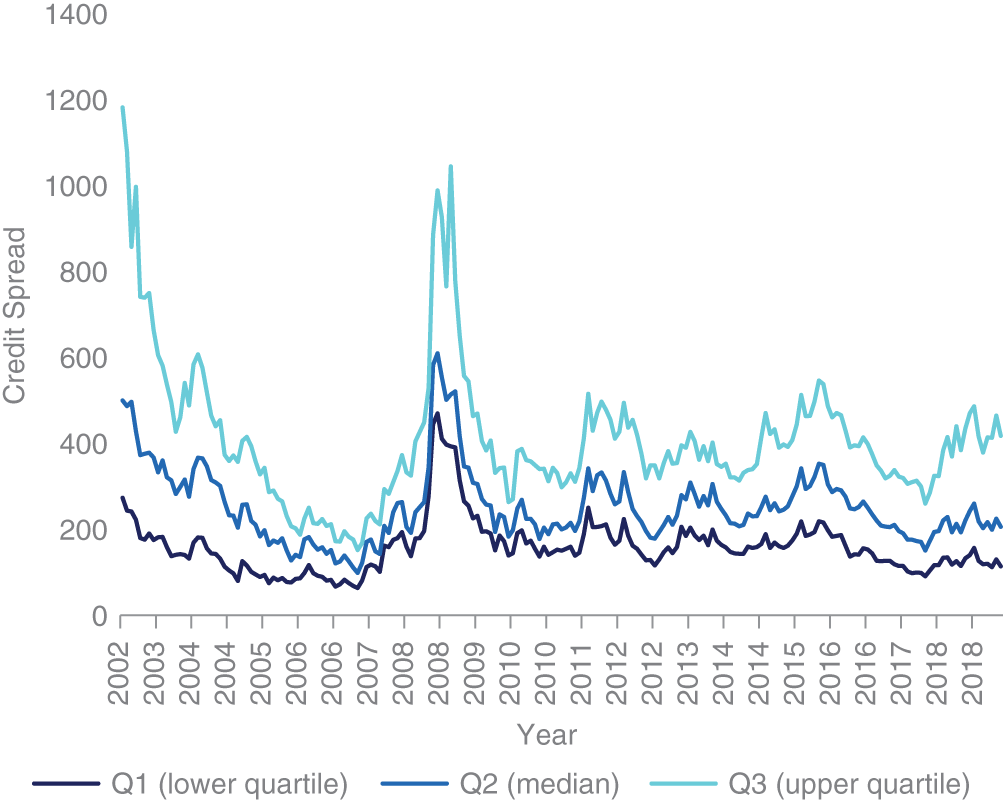
EXHIBIT 7.4 Cross‐sectional distribution of credit spreads for emerging market hard currency bonds.
Source: JP Morgan Emerging Market Bond Index Global Diversified (EMBIGD).
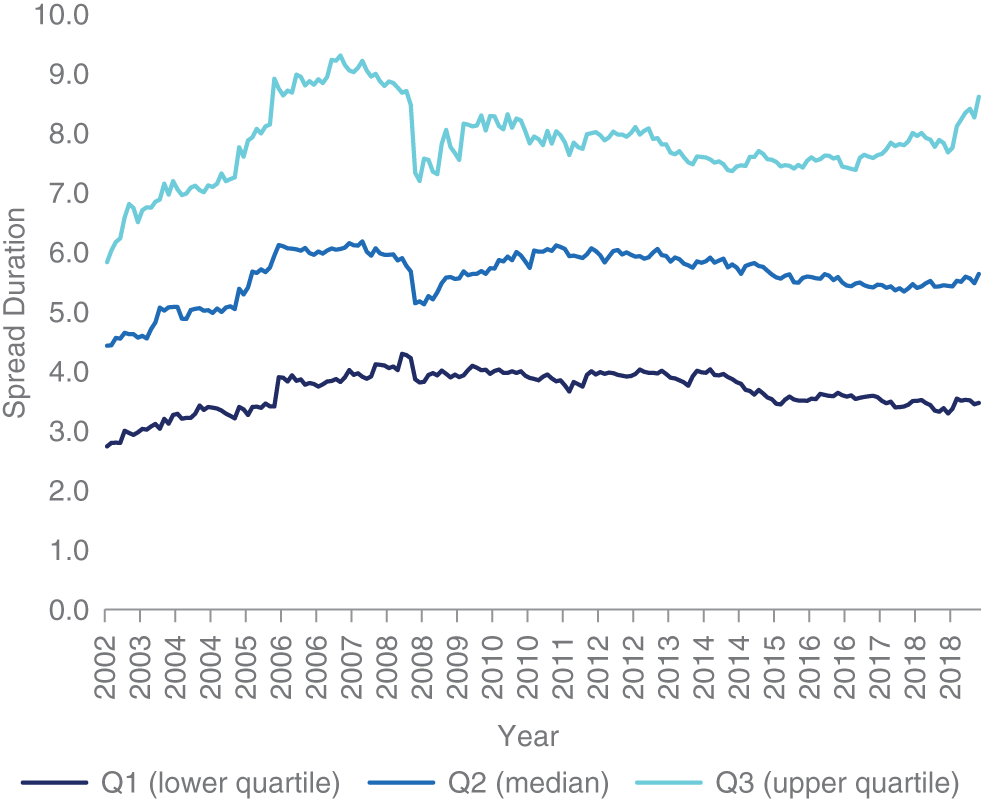
EXHIBIT 7.5 Cross‐sectional distribution of spread duration for emerging market hard currency bonds.
Source: JP Morgan Emerging Market Bond Index Global Diversified (EMBIGD).
As of December 31, 2020, the JP Morgan EMBI Global Diversified Index contained 861 individual bonds. Of these bonds, 546 were issued by sovereign entities and 315 were issued by quasi‐sovereign entities. Two hundred distinct entities issued these 861 bonds (87 unique sovereign entities and 113 unique quasi‐sovereign entities). There is considerable breadth in the emerging market hard currency universe. The investment opportunity set shares more similarity with corporate bonds than government bonds, with the across‐issuer dimension having the greater breadth (i.e., the median sovereign issuer has four bonds outstanding, and the median quasi‐sovereign issuer has two bonds outstanding).
It is useful to compare the composition of EMBIGD to the broad emerging market fixed income universe identified in Dehn (2020). EMBIGD includes bonds from 73 countries compared to 185 countries covered in the Bank for International Settlements data. The EMBIGD has a market valuation of about $1.15 trillion USD in 2020 compared to the nearly $30 trillion USD for the entire emerging market fixed income universe. It is important to keep this in mind as we continue this chapter. We have very good coverage of hard currency emerging sovereign debt (the $1.15 trillion USD is the bulk of external sovereign debt), but we are not looking at emerging market local currency government debt (we discussed security selection for rate‐sensitive assets in Chapter 5) nor are we examining local or hard currency emerging market corporate debt (we discussed security selection for credit sensitive assets in Chapter 6).
Hard currency bonds contain two primary sources of risk (and hence return potential). First, there is a risk‐free component. Because these bonds are all issued in USD, the risk‐free component is the US government bond yield curve. Second, there is a risky component. The risk for an investor in a hard currency bond is that the issuing entity (sovereign or quasi‐sovereign) will be unable to satisfy the USD contractual commitments in the future. This is a type of credit risk, unlike the rate risk that dominates regular local currency government bonds. The mismatch in foreign currency obligations to local currency cash flow sources for repayment is the source of risk. An emerging sovereign cannot issue more local currency to satisfy foreign currency obligations (they need to repay in foreign currency). To quantify the relative importance of the risk‐free and risky components of hard currency emerging debt, we can undertake a return‐variance decomposition similar to what was done in Chapter 2 (see Equations 2.2—2.13). Over the 2002–2020 period the return variation attributable to the risky (risk‐free) portion is 82 (18) percent. Most of the return potential in hard currency emerging market bonds is due to spread risk, and that is the focus of our security selection for the remainder of the chapter.
7.2 A FRAMEWORK FOR SECURITY SELECTION OF HARD CURRENCY EMERGING MARKET BONDS (INVESTMENT THEMES)
There is not a section on the dimensions of active risk taking for emerging market hard currency bonds (e.g., the importance of level, slope, curvature). The breadth available to investors is in between what we have seen for developed market corporate bonds (Chapter 6) and developed market government bonds (Chapter 5). Corporate bond markets had over 1,000 issuers and each issuer had a small number of bonds outstanding (about two for each HY corporate issuer and about seven for each IG corporate issuer). Government bond markets had less than 20 sizable issuers, but each issuer had many bonds outstanding. Exhibit 7.2 (number of issuers) and Exhibit 7.3 (number of issues) imply about three to four bonds outstanding for each emerging sovereign issuer. So, there is the opportunity to engage in security selection both across issuers (country selection) and within issuer (maturity selection). We will focus on country selection in what follows.
The framework described in the following subsections was originally developed in Brooks, Richardson, and Zu (2020). They examine the efficacy of systematic investment themes across long/short and long only emerging market hard currency portfolios. We will examine only the long/short portfolios in this chapter. Our framework will cover a broad set of investment themes (carry, defensive, momentum, and valuation), but we will only discuss simple measures within each theme. The basis for each investment theme builds on Chapter 6 where we covered credit sensitive assets more generally. Kang, So, and Tziortziotis (2019) also find evidence that simple measures of value and momentum can explain cross‐sectional variation in emerging market bond (excess of cash, not credit excess) return variation, and that these simple measures can be incorporated into an optimized long‐only portfolio.
7.2.1 Value
A belief in the efficacy of value themes is supported by extensive evidence across many asset classes, many geographies, and many time periods (see e.g., Asness, Moskowitz, and Pedersen 2013). Value is the tendency for relatively cheap assets to outperform relatively expensive assets on a risk‐adjusted basis. Emerging market hard currency bonds entail credit risk, and that is the return source we are looking for through our security selection. So, our value measures will condition credit spreads on relevant fundamental information. But what should/could that set of fundamental information be? Chapter 6 illustrated a structural model approach (distance to default, or ![]() ), where the expected probability of default implied by
), where the expected probability of default implied by ![]() is the theoretical anchor for credit spreads. A cheap emerging market hard currency bond would then be the bond (or credit default swap [CDS] contract linked to that bond) where the credit spread is wide relative to that expected default probability. This looks the same as the analysis in Chapter 6 for corporate bonds.
is the theoretical anchor for credit spreads. A cheap emerging market hard currency bond would then be the bond (or credit default swap [CDS] contract linked to that bond) where the credit spread is wide relative to that expected default probability. This looks the same as the analysis in Chapter 6 for corporate bonds.
So what is different here for emerging market bonds? Data. Prior research examining the efficacy of value measures for corporates has generated relatively sophisticated distance to default and expected default probability measures using a rich set of market and fundamental data sources (e.g., Correia, Richardson, and Tuna 2012; Correia, Kang, and Richardson 2018). For emerging sovereign entities, it is difficult to compute a clean measure of distance to default. How do you get a clean measure of the indebtedness of the sovereign entity? How do you get a precise measure of the volatility of the sovereign entity? Is it possible to link the constructs of leverage and volatility in a parsimonious way? Rather than trying to force proxies for leverage and volatility into a structural model, we will use a reduced form approach and measure these aspects directly and use them as explanatory variables in a regression‐based value signal.
We estimate the regression in Equation (7.1) on an expanding window basis:
![]() is the average credit rating across the primary rating agencies that are used in EMBIGD.
is the average credit rating across the primary rating agencies that are used in EMBIGD. ![]() is the trailing standard deviation of the monthly country equity returns over the most recent 12 months. Equation (7.1) is estimated using a panel regression because each cross‐section is small (typically less than 25 sovereign entities have liquid CDS contracts each month). Time fixed effects are included to account for temporal variation in credit spreads driven by common macroeconomic factors. This regression framework captures the two essential ingredients of default forecasts (leverage and volatility), and it does so in a flexible way that allows for estimation across our universe. The residual from Equation (7.1) is our value measure.
is the trailing standard deviation of the monthly country equity returns over the most recent 12 months. Equation (7.1) is estimated using a panel regression because each cross‐section is small (typically less than 25 sovereign entities have liquid CDS contracts each month). Time fixed effects are included to account for temporal variation in credit spreads driven by common macroeconomic factors. This regression framework captures the two essential ingredients of default forecasts (leverage and volatility), and it does so in a flexible way that allows for estimation across our universe. The residual from Equation (7.1) is our value measure.
Extensions to value measures could (i) expand the set of information used to identify the indebtedness and credit quality of the emerging sovereign, and (ii) expand the set of market assets used to measure volatility (this could include historical measures of volatility from the debt market itself or currency markets). Our aim here is not to exhaust all possible measures of value but to present a framework for thinking about operationalizing value for emerging market hard currency bonds.
7.2.2 Momentum
As with value, our belief in momentum is supported by extensive evidence across many asset classes, many geographies, and many time periods (see e.g., Asness, Moskowitz, and Pedersen 2013). Momentum is the tendency for an asset's recent performance to continue, leading to outperformance of recent winners relative to recent losers. The challenge is how to best measure momentum for emerging market hard currency bonds. Recent performance can be measured using return data from the asset itself, as well as return data from other related assets. We will measure momentum as an equal‐weighted combination of three monthly return‐based metrics: (i) six‐month trailing emerging market CDS returns, (ii) six‐month trailing foreign exchange (FX) returns, and (iii) six‐month trailing country equity returns. We prefer to sell protection on CDS contracts (equivalent to a long position in emerging market bonds) with positive CDS returns, positive local currency returns relative to USD, and positive country equity returns.
Extensions to momentum could include a variety of nonprice, or fundamental, measures. As was discussed in Chapter 5 in the context of security selection for rate‐sensitive assets, improvements in expectations of the health of the emerging sovereign should be a positive signal for the embedded credit risk in hard currency bonds. Such fundamental measures of momentum could include (i) changing expectations of economic growth, and components thereof, sourced from a variety of forecasting agencies (positive), and (ii) changes in leverage or indebtedness of the sovereign entity (negative). An investor should put their fundamental hat on to identify relevant country level statistics.
As with all momentum signals that are designed to forecast changes in credit spreads (for all credit sensitive assets) it may be necessary to convert that spread change forecast to an expected return forecast by making an adjustment for any cross‐sectional difference in spread duration. For our examination of long/short strategies within a set of liquid five‐year CDS contracts, there is minimal cross‐sectional variation in spread duration, so these adjustments do not matter much, but for security selection within the full EMBIGD, consideration should be given to duration adjustments.
7.2.3 Carry
By now this should start to feel somewhat repetitive. That is part of the systematic investor experience. You are looking for economically sound investment insights that travel well across your asset classes. So it should be no surprise to hear, again, that carry is the tendency for higher‐yielding assets to outperform lower‐yielding assets (it is the return you will get if nothing changes with the passage of time). But, of course, as time passes there will be changes in expectations of credit risk, and hence returns. Carry is a source of risk, but one that has generated a positive risk‐adjusted return across many asset classes and time periods (e.g., Koijen, Moskowitz, Pedersen, and Vrugt 2018). We will use a very simple measure of carry, based only on the five‐year CDS contract at the start of each month. We seek exposure to emerging sovereigns where the CDS contract has a higher spread level. We ignore roll‐down and higher‐order measures of curve shape, which can be a useful extension of the carry investment theme (as was the case for government and corporate bond security selection as well).
7.2.4 Defensive
Defensive is the tendency of safer, lower‐risk assets to deliver higher risk‐adjusted returns relative to their low‐quality, higher‐risk counterparts. This is a multifaceted construct requiring multiple measures. As with value measures, access to reliable and relevant data for emerging sovereigns makes measurement of this theme more challenging. Ideally, we would like access to a clean set of financial statements that give an (audited) assessment of the sovereign entities financial health, cash flow (tax) generating capabilities, and a transparent assessment of its capital structure. Alas, this does not exist. Not even close. Countries do not practice accrual‐based accounting, and tracking what sovereigns ultimately owe is hard even in developed markets. We will do what we can in reduced form. First, we will use a measure based on the level of inflation (based on forecasted levels of inflation). A “better” sovereign entity is one that can target and achieve low levels of inflation. A lower quality sovereign is one that has higher levels of inflation. We use a constant 12‐month ahead forecast of inflation from Consensus Economics. We prefer to sell protection on CDS contracts (long risk) where there is a lower level of expected inflation. Second, we use a measure of indebtedness (i.e., asset/debt ratio). The “asset” value for the sovereign combines foreign reserves (obtained from Thomson Reuters International Comparable Economics, TRICE) and the level of GDP grossed up by expectations of GDP growth for the next 12 months (GDP growth expectations are obtained from Consensus Economics). Estimating “debt” precisely for sovereign entities is a challenging task, because there are often many implicit government guarantees linked to government sponsored entities. We take a simple approach and compute “debt” as the sum of government external debt and 50 percent of nongovernment external debt (reflecting the contingent nature of external private sector debt, which the sovereign may assume in the event of default). External debt data is obtained from TRICE. The log of asset/debt is our measure of sovereign indebtedness. We prefer to sell protection on CDS contracts (long risk) for countries with higher Asset/Debt ratios (i.e., lower leverage). Our defensive theme is an equal‐weighted combination of the two measures (inflation and indebtedness).
7.3 A FRAMEWORK FOR SECURITY SELECTION OF EMERGING MARKET HARD CURRENCY BONDS (PERFORMANCE)
To assess whether systematic exposures to carry, defensive, value, and momentum are potentially useful in an emerging market bond context, we construct long/short portfolios using five‐year CDSs. Over the 2004–2018 period, we can measure the four systematic investment themes over 25 emerging sovereign reference entities. We are discussing the return performance using CDS instruments, rather than EMBs, as CDSs are standardized, liquid contracts that allow for relatively easier cross‐country comparisons and long/short implementation.
This is the first time we have examined CDS contracts in detail, so a short discussion is useful. CDS contracts provide insurance against the likelihood of nonpayment of USD hard currency reference bond obligations by emerging sovereign reference entities. We use five‐year “on the run” CDS contracts linked to (i) reference entities that are “emerging sovereign,” (ii) have reference obligations denominated in USD, and (iii) are sufficiently liquid as captured by membership in the EMBIGD+ index (the + is not a typographical error, it refers to a modified EMBIGD index that ensures each sovereign is sufficiently liquid).
At the start of each month we rank the universe of liquid CDS contracts on our four investment themes, either individually or in combination (equal weighted across the four investment themes). Our investment view is continuous in each measure, and we ensure that it is beta‐neutral (ensuring that the notional exposures on the long and short side of the portfolio are equal in beta amounts). Our long/short CDS portfolio is a little more advanced than the simpler long/short top/bottom tercile/quantile approach discussed in earlier chapters for government and corporate bonds. We are now moving to a stage in the book where portfolio construction/design choices are coming into focus. To estimate beta, we use an asset‐by‐asset variance‐covariance matrix, modeling correlation and volatility separately (this matrix is based on historical credit excess returns). Portfolios are scaled to 10 percent volatility (using the return covariance matrix), are rebalanced monthly, but do not account for transaction costs. Again, our purpose is to assess the potential efficacy of a systematic approach for security selection in emerging market hard currency bonds. View this as a necessary but not sufficient condition for success. If we find evidence of return predictability at this stage, we cannot yet claim success. Are we able to implement these exposures in a cost‐effective way?
Exhibit 7.6 summarizes the performance of our four investment signals (value, momentum, carry, and defensive), both individually and as an equally weighted average combination. The bottom section of the exhibit reports information about the return series (Sharpe ratios, information ratios, and correlations). All investment themes have attractive risk‐adjusted returns with Sharpe ratios ranging from 0.34 for defensive to 0.68 for momentum. The equally weighted combination, Sharpe ratio of 1.11, is superior to any one individual theme due to the low pairwise correlations evident at the bottom of Exhibit 7.6.
To assess whether security selection based on value, momentum, carry, and defensive themes are diversifying with respect to traditional market risk premia (and some well‐known factor risk premia from equity markets), we run the following regression (with all explanatory variables as defined in Chapter 5):

The top half of Exhibit 7.6 reports estimated regression coefficients and, in italics below, the corresponding test statistics. Across all four investment themes, individually and in combination, there is minimal exposure to either traditional market risk premia or equity style returns. The adjusted ![]() for Equation (7.2) ranges from 2.83 percent for value to 13.61 percent for momentum. Momentum has the expected positive correlation with equity momentum (there is a commonality to momentum returns across asset classes) but that correlation is muted and does not detract from the very strong intercept (test statistic of 3.01). Carry has the expected positive association with the credit premium, and that reduces the orthogonal return contribution from the carry investment theme. Importantly, the information ratios (and associated test statistics for the regression intercepts) are all positive, and statistically so for momentum and the combination portfolio.
for Equation (7.2) ranges from 2.83 percent for value to 13.61 percent for momentum. Momentum has the expected positive correlation with equity momentum (there is a commonality to momentum returns across asset classes) but that correlation is muted and does not detract from the very strong intercept (test statistic of 3.01). Carry has the expected positive association with the credit premium, and that reduces the orthogonal return contribution from the carry investment theme. Importantly, the information ratios (and associated test statistics for the regression intercepts) are all positive, and statistically so for momentum and the combination portfolio.
EXHIBIT 7.6 Properties of emerging market hard currency bond security selection investment themes (V for value, M for momentum, C for carry, D for defensive, and VMCD for an equally weighted average) for the 2004–2019 period.
| V | 0.04 | 0.24 | −0.10 | −0.02 | −0.12 | 0.09 | −0.01 | −0.02 | −0.03 | 2.83% |
| 1.49 | 1.04 | −0.45 | −0.30 | −1.10 | 0.84 | −0.15 | −0.17 | −0.33 | ||
| M | 0.07 | −0.38 | 0.09 | −0.02 | 0.19 | −0.01 | 0.11 | −0.14 | −0.13 | 13.61% |
| 3.01 | −2.15 | 0.54 | −0.26 | 2.28 | −0.13 | 2.23 | −1.22 | −1.81 | ||
| C | 0.05 | 0.57 | 0.21 | −0.08 | 0.10 | 0.15 | −0.03 | 0.03 | −0.20 | 8.89% |
| 1.56 | 2.35 | 0.91 | −0.95 | 0.88 | 1.31 | −0.54 | 0.21 | −2.12 | ||
| D | 0.03 | −0.37 | −0.09 | 0.15 | −0.09 | −0.21 | 0.03 | 0.06 | −0.01 | 6.50% |
| 0.88 | −1.63 | −0.42 | 1.82 | −0.81 | −1.94 | 0.44 | 0.44 | −0.14 | ||
| VMCD | 0.13 | −0.16 | 0.01 | 0.02 | 0.09 | 0.06 | 0.07 | −0.03 | −0.24 | 6.85% |
| 4.39 | −0.72 | 0.04 | 0.31 | 0.85 | 0.58 | 1.25 | −0.23 | −2.80 | ||
| V | M | C | D | VMCD | ||||||
| V | 1 | −0.29 | 0.07 | 0.04 | 0.45 | 0.37 | 0.44 | |||
| M | 1 | −0.13 | 0.24 | 0.58 | 0.68 | 0.89 | ||||
| C | 1 | −0.75 | 0.12 | 0.36 | 0.46 | |||||
| D | 1 | 0.32 | 0.34 | 0.26 | ||||||
| VMCD | 1 | 1.11 | 1.30 |
Sources: Brooks, Richardson, and Xu (2020), JP Morgan indices, https://mba.tuck.dartmouth.edu/pages/faculty/ken.french/data_library.html, and https://www.aqr.com/Insights/Datasets.
7.4 EXTENSIONS
7.4.1 Maturity Dimension
The analysis in Section 7.3 covered long/short portfolios based on five‐year CDS contracts for emerging market sovereigns. The systematic investment model can equally be applied in a benchmark‐aware long‐only context where active risk is taken relative to the EMBIGD benchmark. Brooks, Richardson, and Xu (2020) and Kang, So, and Tziortziotis (2019) both assess the efficacy of long‐only implementations of systematic emerging market bond portfolios. They both find attractive risk‐adjusted returns from long‐only implementations suggesting the potential of diversified return sources for asset owners.
A benefit of examining long‐only benchmark‐aware portfolios is the additional investment breadth. For sovereign issuers with more than one liquid bond, you are able to enhance investment capacity by (i) taking positions in multiple bonds for that sovereign issuer (e.g., you can define a country “level” asset similar to what we did in Chapter 5 for government bonds), (ii) taking positions in different bonds for a sovereign issuer (e.g., you can define a country slope asset, again similar to the analysis in Chapter 5 for government bonds). For country‐level views, we can aggregate across multiple issues proportional to the inverse of spread duration. For example, if an issuer has three bonds with spread durations of 2, 5, and 7, the weights for the country asset would be 59, 24 and 17 percent, respectively. For country slope views, we can define a country specific “steepener” that is spread‐duration‐neutral for that country.
There are choices on whether to include sovereign and quasi‐sovereign issuers together when defining the country‐level and country‐slope asset. Likewise, there are choices on tailoring the investment for country‐level and country‐slope views. For example, the front end of the credit curve may be more sensitive to underlying fundamentals (e.g., economic growth, indebtedness, etc.) and this differential sensitivity can be captured when modeling the country slope asset (i.e., you may prefer a country steepener for higher quality and improving emerging sovereigns, because the front end of the credit curve is more responsive to those insights).
7.4.2 Emerging Market Corporate Bonds
As noted at the start of this chapter, there is a very large set of emerging market corporate bonds. A representative index is the J.P. Morgan Corporate Emerging Markets Index (CEMBI), which tracks the returns of USD denominated bonds issued by emerging market corporate entities, which had a market capitalization of nearly $500 billion USD as at December 31, 2020.
Dekker, Houweling, and Muskens (2021) examine the effectiveness of systematic investing signals using factor definitions of Houweling and Van Zundert (2017), including size (preference for emerging corporate issuers with lower market value of debt outstanding), low‐risk (preference for emerging corporates with better credit ratings and emerging corporate bonds with lower remaining time to maturity), value (preference for emerging corporate bonds with spreads that are wide relative to rating category, maturity, and historical change in spreads), and momentum (preference for emerging corporate bonds with higher recent bond excess returns). Although I don't agree with the size signal (see discussion in Chapter 6), the set of investment signals here is representative. Dekker, Houweling, and Muskens (2021) find across long/short and long‐only portfolios evidence of attractive risk‐adjusted returns from investing based on systematic investment themes either individually or in combination.
Operationally, sourcing/providing liquidity is more challenged in emerging markets. Relationships may need to be cultivated with a broader set of trading counterparties to ensure depth of market liquidity access. While there is nothing in principle limiting the success of active investing (systematic or otherwise) in emerging markets, it is more challenging to implement portfolios in emerging markets.
REFERENCES
- Asness, C., T. Moskowitz, and L. Pedersen. (2013). Value and momentum everywhere. Journal of Finance, 68, 929–985.
- Brooks, J., S. Richardson, and Z. Xu. (2020). (Systematic) investing in emerging market debt. Journal of Fixed Income, 30, 44–61.
- Correia, M., S. Richardson, and I. Tuna. (2012). Value investing in credit markets. Review of Accounting Studies, 17, 572–609.
- Correia, M., J. Kang, and S. Richardson. (2018). Asset volatility. Review of Accounting Studies, 23, 37–94.
- Dehn, J. (2020). The EM fixed income universe version 9.0. Ashmore, The Emerging View (August).
- Dekker, L., P. Houweling, and F. Muskens. (2021). Factor investing in emerging market credits. Journal of Index Investing, 12, 28–46.
- Houweling, P., and J. Van Zundert. (2017). Factor investing in the corporate bond market. Financial Analysts Journal, 73, 100–115.
- Kang, J., K. So, and T. Tziortziotis. (2019). Embedded bets and better bets: Factor investing in emerging market bonds. Journal of Investment Management, 17, 27–46.
- Koijen, R., T. Moskowitz, L. Pedersen, and E. Vrugt. (2018). Carry. Journal of Financial Economics, 127, 197–225.