
Business intelligence is all about people. We need to help people understand data as quickly as possible so that they make strategic decisions more quickly.
Unfortunately, decision makers can end up being distracted by a need to mash data together in Excel. Worse, they may even expend time in trying to understand the data in the first place, rather than using the time to analyze the data to make an informed decision. This has a pernicious impact on the organization since decision makers are diverted from their role and contribution to the organization.
One proposal is to take a step back and re-evaluate the business questions and how they are answered. Due to the requirement that the data is correct and current, users could be provisioned with data that is insulated from the operational systems and merged together. This could help to answer the business need for a decision to be made using the data on the dashboard.
In this recipe, we will load the fact table called FactInternetSales first, and then we will load the dimension tables. We will look at joining tables together and putting the tables into Tableau's memory. When we do this, we relieve some of the pressure that is produced when we create an unnecessary proliferation of snapshots of data. In turn, data silos need to be mashed up by business users in order to get the information they need. We will join tables together so that the business users can get results more quickly using Tableau, rather than trying to merge lots of smaller spreadsheets together.
For the exercises in this chapter, open a new Tableau workbook and name it Chapter Four.
- On the initial Tableau page, select Connect to Data and navigate to the location where you stored the data files, as shown in the following screenshot:

- Click on the Text File option
- Navigate to the
FactInternetSalesfile and select it. - Next, we will add the date dimension first. Go to the Files heading on the left-hand side, and drag the file called
DimDate, to the canvas on the right-hand side. - You should join the tables together. Under the heading Data Source, select the field list item called Order Date Key. On the right-hand side, under
DimDate.csv, select Date Key. Your join should look like this:
- You don't need to take all of the columns. In fact, it would be a good idea to take across only the columns that you need, or it will be confusing for the end user to see too many unnecessary columns. Here, we will remove the international language columns for clarity. For reference, we removed the following columns:
Spanish Day Name of WeekFrench Day Name of WeekSpanish Month NameFrench Month Name
- Now, let's add in a few more tables. Go to the Files section on the left-hand side, and drag
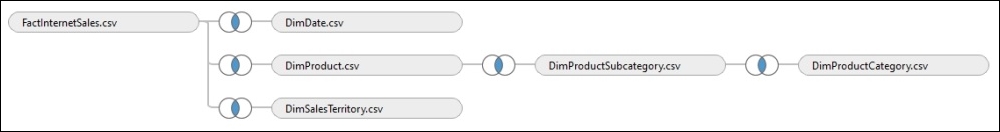
DimProduct.csvto the white canvas. Tableau will do the join for you. It will join theProductKeycolumn in theDimProductfile to theProductKeycolumn in theFactInternetSalestable. - Let's add in the product subcategory information. Drag the
DimProductSubCategoryfile from the Files section on the left-hand side to the canvas. Again, Tableau will do the join for you. The join will use theProductSubCategoryKeycolumn in theDimProductSubCategorytable to join with theProductSubCategoryKeycolumn in theDimProducttable. - Let's add in the product category information. Drag the
DimProductCategorytable to the canvas. As mentioned earlier, Tableau will do the join for you. Tableau will use theDimProductSubCategorykey in the table to match withProductCategoryKeyin theDimProductSubCategorytable. - Finally, let's add in some sales territory data. Drag the
DimSalesTerritoryfile from the Files section, and drag it to the canvas area. Tableau will take theSalesTerritoryKeycolumn in theDimSalesTerritorytable, and use it to join with theSalesTerritoryKeycolumn in theFactInternetSalestable.To assist you further, here is a table that shows the table name and its key:
Table name
Key
DimProductProductKeyDimProductSubCategoryProductSubCategoryKeyDimProductCategoryProductCategoryKeyDimSalesTerritorySalesTerritoryKeyYour canvas should now appear as follows:
- For each additional table, we will add an inner join. What are these joins? An inner join, also known as an equi join, selects only the rows from both the tables that have matching values. Rows with values in the joined field that do not appear in both of the database tables will be excluded from the result set. So, for example, if there is a row in the
FactInternetSalestable, which does not have a value in theDimDatetable, then it will not be returned, and vice versa. - Go to the File option at the top, and click on Save. This will import all the data into Tableau's data engine. Then, click on the Go To Worksheet button to go back to the main Tableau canvas.
- Now, let's extract the data to make our data go faster. Go to the Data menu item, and navigate to FactInternetSales+. From the pop-up menu, select Extract Data. Here is a screenshot:

- You will now be taken to an Extract Data dialogue box. We will import all rows, so you simply need to press the Extract button and the work is done. Here is an example:

- Next, you will be prompted to save the file. Make a new folder on your computer, and call it TDE files. Save your TDE here.
- Once you have imported your data, your Tableau worksheet will show all of the tables on the left-hand side.
- As a quick check that all of your data is imported, select the Number of Records metric from the Measures pane. You will find it at the bottom of the Measures pane on the left-hand side. You can refer to the next screenshot as an example:
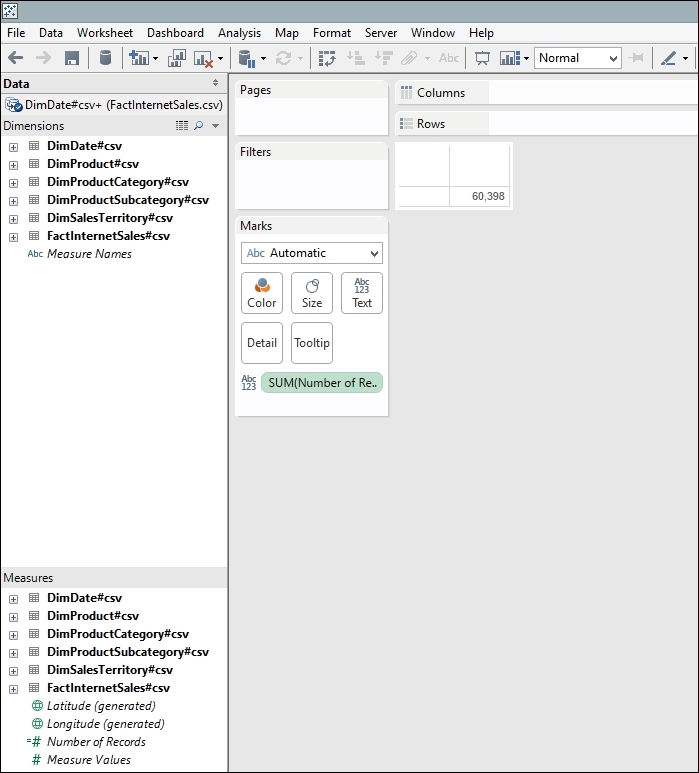
As you can see, the tables are located in the Data pane on the left-hand side.
To summarize, in this section, we have shown different ways of joining tables in order to alleviate a situation where people are copying and pasting data all over the place. By unifying all the data that the users need into one distinct place, it will save them time and energy that they could use to make better decisions.
Tableau has its own data engine, which is an analytics database. It uses compression, which means that it can store a lot of data. It also involves techniques to make data retrieval very fast. It is a flexible data model, and you can work on the data very quickly in the same way as it is represented on the disk.
We saved the data extract, which is a separate file from the Tableau workbook. It has the file extension .tde, which stands for Tableau Data Extract. This extract file can be reused directly without having the source connection details. This is extremely useful for portability. You can also use it as a way to prototype the dashboard. Further, you can anonymize a dataset and load it into an extract file. Then, you can ask the developer to work from the anonymized extract file. Once the development is complete, you could change the source connection so that Tableau connects to real-world data.
Here is a trick—if you want to verify the number of rows loaded into Tableau's data engine, then take the Number of Records metric and put it into the Marks shelf. This will give you a quick check to see if the number of rows loaded matches what you expect. If the number is much lower or higher, then one of your joins may be wrong. It's best to do this before you start or you will have to redo the work!
What happens if you have made a mistake and want to delete worksheets? You can delete worksheets by right-clicking on the worksheet tab, and selecting Delete Sheet.
When you attempt to delete a worksheet, you will notice that there is no option to delete the sheet. You can see an illustration of this feature in the following screenshot:

If the worksheet is used in a dashboard, Tableau will not allow you to delete a worksheet if it is reused elsewhere. In order to get around this feature, you need to delete the dashboard first, and then you'd need to delete the original worksheet. Tableau doesn't let you delete all the worksheets; however, it needs a worksheet in order to show data!