
We live in a world where everything is Big Data. Many organizations are burdened with too much data, and this is a common problem. The problem is made worse by the fact that many people aren't sure what to do with the data due to its size and complexity. In today's enterprises, data is often in disparate locations, and it is growing in size. This situation is reflected in this recipe, since it requires a lot of "moving parts" to be put together, such as downloaded data, the Hortonworks Sandbox, and Tableau.
For the purposes of simplicity and clarity, we will simply use a small amount of data rather than a Big Data source. This will help you to manipulate the data more easily since it is in an accessible format. Often, the key factor in the importance of data is how often it is used and how many business processes depend on the data, rather than its size. So, don't ignore the little data!
If you don't have access to Big Data technologies, don't feel excluded from the party. There is no need for you to skip over this chapter. We will base our example on the Hortonworks Sandbox, which is freely available over the Internet for you to use. It is also already preconfigured for you, so it is the easiest way possible to ramp up toward Big Data for free.
To use Windows Azure DataMarket, you will need a Microsoft account, such as a Live account, Hotmail, an MSN account, or others of the kind. This is free to set up if you don't already have one. To do this, visit https://login.live.com/ and look for the Sign Up Now link to follow the wizard through the process.
To learn more about Big Data solutions, a great place to start is the Hadoop Sandbox, generously provided for free by Hortonworks and preconfigured for you to get started straightaway. To get started, download the Hortonworks Sandbox from the Hortonworks website at www.hortonworks.com. Sandbox is a virtual machine, and Hortonworks offers it using Hyper-V or VMware. You can download it to your preferred VM mechanism. If you are not sure about using Hyper-V or VMware, you can download the free VMware Player, which is easy to use and will work with the Hortonworks Sandbox. You can find it at https://my.vmware.com/web/vmware/free#desktop_end_user_computing/vmware_player/6_0.
Once you have configured the Sandbox, you need to download some sample code to put into the Sandbox. To enrich the data, we will use a country code set of data, which will give us a lot of information about individual countries. For this example, we will reuse the country file that we downloaded from Azure in Chapter 1, A Short Dash to Dashboarding!. Instead of connecting directly to the file, we will download it to a CSV file in Excel. To do this, connect to the Windows Azure DataMarket using a Windows Live ID by visiting https://datamarket.azure.com/.
The data can be found at https://datamarket.azure.com/dataset/oh22is/countrycodes#schemaAbout. Halfway down the page, look for the link to Explore this Dataset. On the right-hand side, you will see Download Options. Select the option to download as CSV.
You will see that there are several columns in the downloaded CSV, and we won't need them all for this example. To make the example simple, let's keep only the following columns:
AreaCapitalContinentCountrycallingcodeCountryidCountrynameCurrencyFipsIOCISO3IsonumericNato2Nato3Population
Now we are ready to use Big Data technology to enrich our data in Tableau.
- Start by uploading the CSV file into the Hortonworks Sandbox. This is straightforward. Once you have the Hortonworks Sandbox open in your browser, create a directory called
GoldenRecord. To proceed, go to the File Explorer option and select Upload File to upload it to theGoldenRecorddirectory. - Once you have uploaded the file, create the table. To do this, run a query in the Query Editor interface. The following screenshot shows this interface:
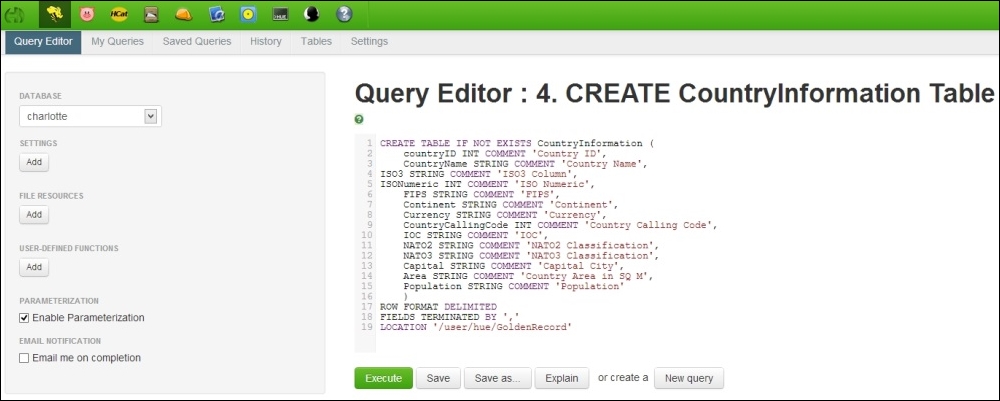
- Copy the following script and paste it into the Query Editor, as shown in the preceding screenshot:
CREATE TABLE IF NOT EXISTS CountryInformation ( countryID INT COMMENT 'Country ID', CountryName STRING COMMENT 'Country Name', ISO3 STRING COMMENT 'ISO3 Column', ISONumeric INT COMMENT 'ISO Numeric', FIPS STRING COMMENT 'FIPS', Continent STRING COMMENT 'Continent', Currency STRING COMMENT 'Currency', CountryCallingCode INT COMMENT 'Country Calling Code', IOC STRING COMMENT 'IOC', NATO2 STRING COMMENT 'NATO2 Classification', NATO3 STRING COMMENT 'NATO3 Classification', Capital STRING COMMENT 'Capital City', Area STRING COMMENT 'Country Area in SQ M', Population STRING COMMENT 'Population' ) ROW FORMAT DELIMITED FIELDS TERMINATED BY ',' LOCATION '/user/hue/GoldenRecord' - Once you have done this, click on the Execute button, and the script will create a table called
CountryInformation. When you click on the Tables option, you will see theCountryInformationtable as shown in the following screenshot: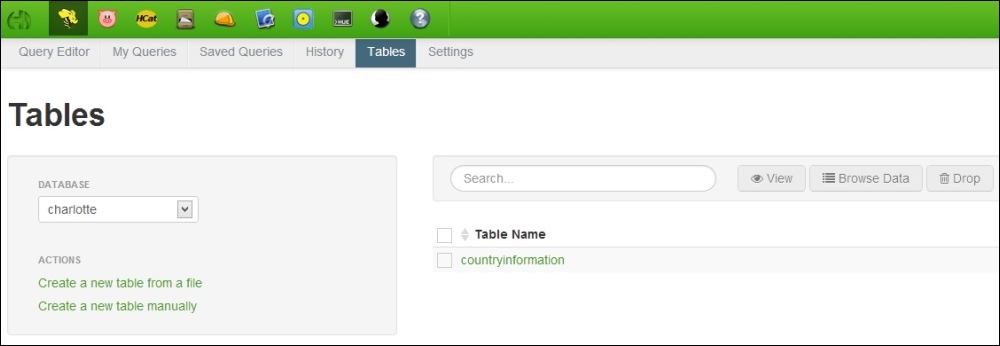
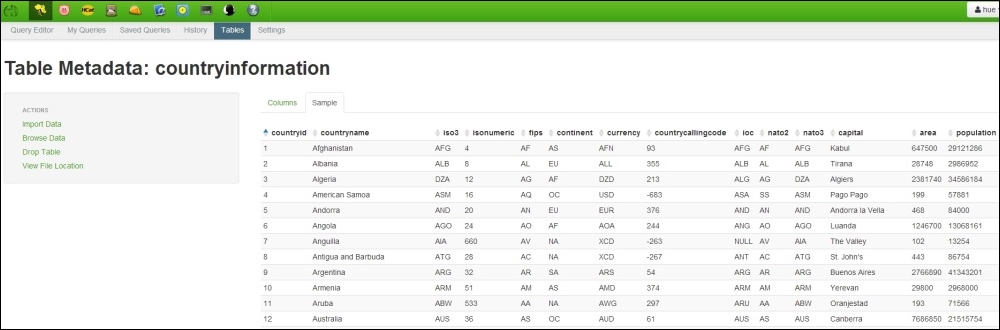
- If you click on the countryinformation link, you will see the columns that you created. The following is an example of the columns as seen in the Hue browser:

- You can also see a sample of the data by clicking on the Sample link, as seen in the following screenshot:
We are now finished working with the Hortonworks Sandbox. Next, we need to use Tableau to connect to the Hortonworks store. There are two ways to do this. If you have the Tableau Professional edition, then you have enabled connectivity to Hortonworks. You can see this if you go to Connect to Data on the Tableau workbook. If you have the Tableau Desktop edition, you will need to use Excel to connect to the Hortonworks Sandbox and download the data from there. Once the data is downloaded to Excel, you can store it and connect to it easily. If this was a real-life scenario, this wouldn't be satisfactory because the data might go out of date very quickly.
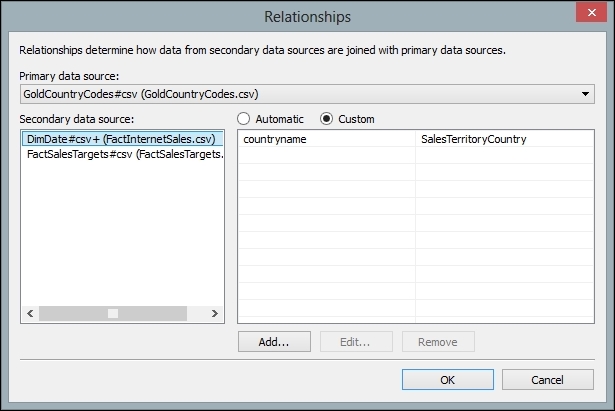
- However, for the purpose of our simple example, the data can be loaded from Excel into the Tableau Desktop edition. However, we'll connect to the data source, and let's call it
GoldCountryCodes. - Once the data is in the Tableau workbook, we can join it to the other tables using the country name. Here's an example of the joining in the following screenshot:
- Once the data is joined together, we can visualize it in Tableau. We will have a mashup of the CSV files and Big Data technology—all in the same Tableau workbook.
- For example, you could use the SalesAmount measure and put it next to the Population data from the external file. As a starting point, you could make a table and then see where the data takes you! The following screenshot shows your starting point:

Why not try some of the visualizations in Tableau based on this data to see how it looks?
Note that this recipe only uses small data files as an example, and it is not intended to be a real-world Big Data exercise where we transfer petabytes of data. Excel is used as an accessible example of a data source for training purposes.
The beauty of mixing Big Data sources with Little Data is that the user is insulated from the size of the data. Instead, they can visualize their data from different stores and different formats.
Fortunately, Tableau offers us a royal road to understanding the data by helping us to visualize it quickly and easily. It also allows us the ability to explore the data so that it starts to make sense regardless of whether it is Big Data or the important Little Data that makes up the data currency of the enterprise. We can enrich our existing data stores by using Big Data technologies, and this is the theme that we explored in this recipe.
In this recipe, we also made changes to the data by enriching it with a Big Data source. Big Data solutions are becoming more prevalent, but there is still a need for simplicity in accessing data regardless of its size. In this example, Tableau used a simple ODBC connector to access the data held in the Hortonworks Sandbox. A common experience among data analysts is not being able to get access to the data they want. Therefore, the simplicity of accessing the data is vital, and ODBC is a common way of accessing data that is familiar to IT professionals.
Once we have access to the data via ODBC, there is no stopping us! Tableau then sees the data as another data source, in the same way as it sees data from Excel or OData, for example. In other words, this mechanism is a great "leveler" of data access since the data is accessible regardless of its size.
Tableau obviously cannot suck in petabytes of data (yet!), and this is one scenario where Big Data will need to stay outside of Tableau as an external data source. On the other hand, as we saw earlier, business intelligence requirements often involve summarizing data for averages, counts, and so on. It can be useful to break the data down into manageable summaries, and Tableau could access the summary data rather than the full Big Data itself. These issues are architectural questions, but a summary is a good place to start before moving forward to bigger questions.