
With any measures, you either use them or lose them.
—Mario Moreira
Measures and metrics can be challenging because they can be both dangerous and helpful. By dangerous, I mean that if you measure the wrong thing, it can set you in the wrong direction and people can rig the measures if they think they will be used against them. They are helpful when you measure outcomes over output, as successful business outcomes are what you are looking for. They are also helpful for better decision making.
This chapter is not intended to be an inclusive set of Agile measures. It is meant to provide you with enough information to get started in building your measurement framework and use it to determine if you are successfully delivering customer value. Focusing on customer value means that you need metrics that help you gauge if you are moving in the direction of customer value. It may also mean that many of your current metrics may not be of value or certainly have a lesser value. Also, you should only keep those metrics that you actually use for decision making and navigation.
Outcomes Matter
The primary goal of Agile measures is to help you become more aligned with delivering customer value. This is why outcome-based measures are much more aligned with Agile than output measures. Output measures focus on how much you delivered, while outcome measures focus on the results of what you deliver. It is the results that matter.
Outcome-based measures are drivers to help you understand business success. You may still need output measures to help you on your way; just ensure that they are relevant to help you determine if you are reaching the outcomes you are looking for.
As discussed in Chapter 3 and illustrated in Figure 3-3, output may count the number of releases while outcome is how many more customers either bought or used the product from release to release. If sales or usage is low even though the number of releases is high, it's the sales or usage that matter. Often people focus on outputs because they tend to be easier to measure or are a carryover from a more traditional mindset.
Agile Pit Stop
Outcome-based metrics change our perspective from an internal one to a customer or external perspective.
An outcome focus changes your perspective from an internal one to a customer or external perspective. This allows you to better understand what you are aiming for in the customer-value-driven world you need to establish.
Another reason to include the Reflect stage to create a 6R model (as discussed at Chapter 11) is that it is during the Reflect stage when the results or outcomes come to light. This helps you frame the big picture of delivering an idea. It doesn’t begin when development starts working on the idea and it doesn’t end when it gets delivered.
Value of Metrics
A metric is only as valuable as your ability to digest it and use it to steer your enterprise. Some metrics have a temporary use while others may have a more permanent use. You may observe that although many metrics are created and shared, only a few of them are actually being used for decision making. You have to continually ask what measures can help a team or organization move in the right direction? Before discussing suggested metrics, it is worth having a discussion of the relative value of a metric.
The value of a metric is defined as its usefulness divided by the effort it takes to collect. The dividend implies the metric serves a useful purpose, such as decision making. The divisor implies the metric costs, which are the energy in collecting data and generating the metric. If the usefulness is outweighed by the energy to generate it, then it may not be worth preparing the metric.
Agile Pit Stop
The value of a metric is defined as its usefulness divided by the effort it takes to collect it. If you are not really using it to navigate your course, retire it.
Some metrics may have a short life cycle, being valuable for only a certain time based on the usefulness they provide. As an example, if an Agile education program commences, it may be of value to collect the number of people educated in Agile. This provides visibility into ensuring the actual number of employees being educated is increasing as desired. However, once you have educated 80% of the target audience, it may no longer be useful to collect this data and keep tracking this metric.
Because the relative value of a metric changes over time, it is beneficial to periodically assess the value being generated. If a current metric no longer provides value, it is time to retire it. If a new one is of value, it may be included if the usefulness outweighs the energy to generate it.
Value of Leading Indicators
Business success is measured in a number of ways. When you think of desired outcomes from a customer perspective, it is more products sold or used, meaning an increase in revenue. Having a customer revenue metric helps you understand whether products or services are being sold.
Capturing revenue is a good starting point. However, because revenue is an outcome metric, it is a lagging indicator. To supplement lagging indicators, you need leading indicators that provide you visibility into what is currently occurring with the customer and the progress of the idea. This timely visibility is important because it provides input for making better decisions as you move forward. Better decision making with timely data leads to an increased chance of success and more revenue.
Agile Pit Stop
Revenue is a solid Agile outcome measure since it’s about improving business results. However, it is a lagging indicator, so you need leading indicators to provide timely visibility to ensure you are moving in the right direction of customer value.
While customer revenue is an important metric to collect, the question is, what metrics can you put in place to ensure you are moving in the right direction? For every lagging metric, you need to establish at least one leading metric to act as an indicator to provide visibility to gauge if you are moving in the direction of a positive lagging metric (for example, increase in revenue). I call this the lagging to leading metric path.
As illustrated in Figure 20-1, the desired outcome is customers’ buying/using your idea (that is, product or service). Since this is a lagging metric involving revenue from customers, leading indicators could be the following:
Customers attending demos: a leading metric involving the demos or sprint reviews. You capture how many customers are attending the demo and feedback you are receiving. If customers aren’t attending, there is a reduced probability that you’ll reach the successful outcome you desire.
Customers satisfied with a demo: a leading metric where you capture customer satisfaction from the functionality viewed in the demo.
Customers participating in beta: a leading metric involving how many customers are willing to exercise an increment of an idea in a beta environment.

Figure 20-1. Lagging to leading metric path
The value of leading indicators is that they “indicate” if you are moving in the direction of customer value. If no customers are willing to attend a sprint preview of a product, this indicates that maybe the product is not appealing to the customer marketplace. With no customers, you also miss the valuable customer feedback to help you adapt toward customer value.
If customers are reporting negative satisfaction in the sprint review, this indicates that the idea is not appealing to the customer marketplace. Finally, if few customers are willing to participate in the usage of an idea increment in a beta environment, this can indicate little customer interest in your product. The key is building a set of leading indicators to help guide you since no one indicator provides all of the data you need.
Measures for Running the Enterprise
Getting to customer value is a journey. As part of that journey, how do you ensure you are moving in the direction of customer value? The answer is value metrics. To supplement value metrics, a selection of flow, quality, and satisfaction metrics can help triangulate your measures for a holistic view. The key is to establish metrics that you will actively use focused on value or leading indicators to value. The following is a selection that may prove useful.
Value Curve
The value curve is a way to view the value of ideas being worked on vs. those waiting in your pool of ideas. The importance of this metric is to become aware of those high-value ideas (in this case, based on cost of delay) that are waiting and how much low-value work is being worked on that is causing the high-value work to wait, as illustrated in Figure 20-2.

Figure 20-2. Enterprise value curve
It can inform your decision making by providing you awareness of the high-value ideas waiting and aging. When a team pulls for more work, you can ensure that the next highest-value piece of work gets pulled instead of applying the old method, which seems to have resulted in lower-value work coming their way. You can gain more insight of value curves in Chapter 12.
Ideas with CoD and CD3
The ideas with cost of delay (CoD) and CoD divided by duration (CD3) are early indicator value metrics that look at the percentage of ideas that get evaluated with CoD (or designated value score). A complementary metric to add is what percentage of ideas gets evaluated with HiPPO (highest paid person's opinion).
These metrics help you know how serious your enterprise is at applying a value-based practice to the value of ideas. HiPPO inversely looks at how much value priority is driven by a person’s opinion. Figure 20-3 illustrates that over time, more CoD and CD3 are being applied and less HiPPO. In mid-January, a CoD education effort occurred, which increased the usage of CoD and CD3. This is a temporary measure. Once you are over 80% at applying CoD and CD3 (using the 80/20 rule), you no longer need to collect this measure. You can gain more insight into CoD and CD3 in Chapter 12.

Figure 20-3. CoD/CD3 adoption score
Customers at Demos
The customer-at-demos measure is an early indicator value measure that looks at the number of customers attending demos for a team or product. Captured during the Reveal stage, a low number of customers attending a demo typically indicates either a lack of interest or a lack of actual customer feedback, which are both inhibitors to understanding customer value.
This type of measure can help you understand levels of customer involvement in demos. If you aren’t getting much customer involvement in the demos, you are less likely to be moving in the direction of customer value. Looking at Figure 20-4, which product (A or B) is getting more customer involvement in its demos? This is a temporary measure. Using product B as the example, once it is clear that it is getting customer involvement over a few sprints, this measure is no longer needed.

Figure 20-4. Customers attending demos
Customer Satisfaction
Customer satisfaction is a way to gauge if a company’s products and services meet or surpass customer expectations. The benefit of customer satisfaction is twofold. First, it may be considered a leading indicator of customer revenue, giving you insight into whether you are moving in the right direction. Second, it can focus employees on the importance of fulfilling value to customers. Customer satisfaction is often reported at a cumulative level. It may be measured along various dimensions: usefulness of a product and responsiveness to problems.
As illustrated in Figure 20-5, customer satisfaction surveys should be conducted periodically to provide a gauge of satisfaction of the company's products and identify actions for improvement. Post-purchase satisfaction surveys in the Reflect stage of the 6R model should be utilized to gauge the satisfaction of customers and what specific value the customers found. Because there are many forms of customer satisfaction metrics, consider researching the various forms and identify what is right for you.
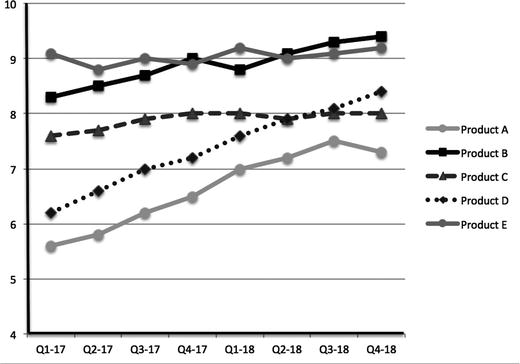
Figure 20-5. Customer satisfaction by product
A key customer satisfaction measure is the net promoter score (NPS). It is an index that measures the willingness of customers to recommend a company's products or services to others. It helps you gauge overall satisfaction with a company's product or service and the customer's loyalty. In answering the question of how likely you are to recommend this product to a friend, you typically select from 1 to 10 where a response of 0 to 6 is known as a detractor, a response of 7 and 8 is passive, and a response of 9 and 10 are the promoters (in other words, those willing to recommend).
End-to-End Lead Time
Often in an enterprise, there are discussions focused on measuring time to market. This visibility provides you the rate in which you are delivering customer value into production. The challenge is that a lot of the discussion focuses on the work during the Realize stage (that is, development). This is known as cycle time. Cycle time focuses on the time an idea begins development work until it is delivered. There tends to be a lot of focus on optimizing the Realize stage without recognizing that there may be much larger improvement opportunities from Record to Refine.
A more meaningful focus is to measure the time across the end-to-end Record to Release stages (for example, concept to cash) along the enterprise idea pipeline known as lead time. Lead time is the elapsed time from when the idea is recorded until it is delivered. It highlights that it is quite possible that there is a lot more elapse time spent in the Record to Refine stages than in the Realize stage. The question is, how long does the idea wait before it gets pulled into the Realize stage?
Using Figure 20-6, the Realize stage takes three months in both scenarios (traditional budgeting and Agile budgeting). In the Agile budgeting scenario, a special focus is placed on reducing the wait states typically found in a more traditional budgeting scenario, reducing the overall cycle time from 16 months to 6 months, a 62.5% improvement for time-to-market even as the cycle time in the Realize stage stays the same (three months) in both scenarios.
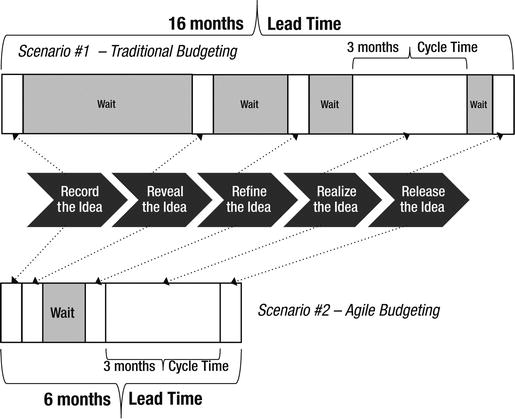
Figure 20-6. Lead time and cycle time relating to the 5R model
When companies first measure their lead time, the length of their end-to-end Record to Release times often surprises them. This is due to learning how long ideas are in wait states. It is advisable to establish a lead-time trend metric, as illustrated in Figure 20-7, at the product, product-line, or enterprise level. A lead-time-trend metric highlights the original length of lead time and the direction where lead time is headed.

Figure 20-7. Lead-time-trend measure
The goal for the lead-time trend is to identify a pace of change that a customer can absorb. For most websites and retail products, it can be quite rapid and often a faster pace than what is current. In order to set a goal to reduce end-to-end lead time, you should consider leading with education on the incremental thinking and decomposition techniques. You can use lead time as an indicator for revenue. If ideas are taking a long time to get to market, this can have a direct impact on customer revenue.
Customer Revenue
Revenue is a complex term that can be interpreted in many ways. I am referring to net revenue, which is the amount of money a company receives from sales of products and services less negative revenue items such as returned items, refunds, and discounts. Although revenue is a lagging indicator, the benefit of revenue metrics is that they are a key indicator of whether customers find value in the products you are building.
Revenue metrics can be generated at product, product-line, business-unit, or enterprise levels. Revenue can be quarterly, as illustrated in Figure 20-8. Because revenue is a lagging metric, ensure you create a lagging to leading metric path so that you have leading indicators to help you gauge your path to an increase in revenue. There are many forms of revenue metrics, so consider researching the various forms and identify what is right for you.

Figure 20-8. Customer revenue from sales measure
Employee Satisfaction
In the spirit of employees matter, employee satisfaction is a way to gauge employees' feeling of contentment within a workplace. Employee feedback allows you to engage in meaningful improvement opportunities. Poor satisfaction can lead to higher attrition rates and low productivity. If employee satisfaction starts decreasing, can it have an impact on customer revenue meaning that employees are less motivated to support the company and less focused on customer value?
Satisfied employees can lead to loyalty and higher productivity. By giving your employees a voice, they can express their interests and concerns. Employee satisfaction surveys can energize and empower employees, provided their results and improvement opportunities are taken seriously. Figure 20-9 illustrates a customer-satisfaction metric using COMETS attributes from Chapter 7 as a framework to gauge employee satisfaction. This example uses a top-box approach where those employees who select 9 or 10 (of 10) are very satisfied with those areas.

Figure 20-9. Employee-satisfaction metric using COMETS
When commencing an Agile program, it is important to gauge satisfaction. It can help you understand how satisfaction levels change. During an Agile change, while many become more satisfied, some may find their positions of control being reduced and become less satisfied. Because there are many forms of employee-satisfaction metrics, consider researching the various forms and identify what is right for you.
Enterprise Dashboard for Correlation
Once you have a collection of metrics, it is useful to share it collectively in a dashboard. A dashboard is a form of information radiator where you display your key metrics that help you understand where your enterprise is going. It is best to focus on three to six metrics, which should be prioritized by customer value, speed, and satisfaction, as illustrated in Figure 20-10.

Figure 20-10. Enterprise dashboard
A dashboard provides at least two benefits. The first is that you can view metrics in one place and see them side-by-side, whether on paper or on a screen. The second is that you can correlate them to ensure you are not optimizing for a particular metric inappropriately. An example of sub-optimization is while bringing lead times down, customer satisfaction decreases. Another example is removing all severity 3 and 4 defects for higher quality may inadvertently increase lead times.
In an Agile context, a shared dashboard lends transparency to what is being measured and helps employees understand what is occurring without second-hand interpretation. I strongly encourage you to make your metrics transparent with the help of a dashboard for all to see. Do keep in mind that some metrics are captured at different rates—daily, weekly, per sprint, monthly, quarterly, bi-yearly, and yearly.
What Are Your Measures of Success?
It is important to consider your Agile measures of success. The material in this chapter can give you a jump-start in establishing metrics that give you visibility into aligning with Agile and, more importantly, establishing a direction toward customer value, speed of delivery, and satisfaction. Make sure to consider your lagging and leading metric path and metrics that provide visibility at the enterprise and product levels.
A dashboard provides one place to view key metrics and viewing them side-by-side can ensure you are not optimizing for a particular metric inappropriately. Measures of success are meant to help you determine if you are moving in the right direction of customer value. These metrics should provide insights, help you make decisions, and determine if you should adapt or stay the course.