
Chapter 1
It's “Oh My God!” Bad
Marketing is too important to be left to the marketing department.1
—David Packard, cofounder and past chairman, chief executive officer (CEO) and president of Hewlett-Packard
- “Marketing measures ROI [return on investment] in terms of marketing, such as customer satisfaction and brand value instead of the most relevant relationship, the one between spending and the gross profit generated from these investments…brand value! What in God's name is this anyway? It's not as if our shareholders care.” (CEO of a Spanish telecommunications firm)
- “There is a disconnect between our overall strategy and what marketing understands to be our customers.” (CEO of an Austrian retailer)
- “Marketers are, simply put, often disconnected from the financial realities of the business.” (CEO of a German financial institution)
- “Marketers make decisions based upon gut feelings rather than a solid ROI analysis.” (CEO of a U.S. professional services firm)2
CEOs around the world have stopped trusting their chief marketing officers (CMOs). Our research proves it.3 The findings are sobering. The majority of CEOs can't bring themselves to say that marketing is strategically relevant.4 Oh my God!
This is a major problem. Marketing's job is to bring the voice of the customer to the company. Customers are the only reason companies exist, and marketing is charged with overseeing the customer experience. In fact, 90 percent of CMOs are personally responsible for the overall customer experience management efforts of their firms.5
Unfortunately, for many corporate leaders marketing has become, to quote the CEO of an Italian telecom, a “function not on the top of my everyday priority list.”6 Or worse! CEOs often view marketing as a money pit. To quote the CEO of one U.S. retailer, “Marketing [has] great ideas but no clue how to measure its impact on what really counts How can I allocate them a budget that disappears into a black box while others can deliver me an ROI for every dollar I give them?”7
Marketing's detractors likely don't see a problem at all—and to be sure, there are lots of detractors. Ironically, for a management science charged with managing the reputation of their companies, marketing has a terrible reputation among consumers and business professionals.8 Only 10 percent of the population has a positive impression of marketing. By contrast, 62 percent have a negative opinion of marketing. Moreover, detractors can rightfully point out that companies still exist and that companies must, by definition, have customers. So companies can exist just fine without much help from marketing. What difference does it make that marketing has lost strategic relevance with CEOs?
The reason is best summed up in the words of Peter Drucker, the father of modern management.
There is only one valid definition of business purpose: To create a customer Because it is its purpose to create a customer, any business enterprise has two—and only these two—basic functions: marketing and innovation. They are the entrepreneurial functions. Marketing is the distinguishing, the unique function of the business. Any organization in which marketing is either absent or incidental is not a business and should never be run as if it were one.9
Marketing's failure will ultimately be reflected in the customer experience. In fact, it already is. Given the current CEO-CMO breakdown, it's not surprising to find a corresponding breakdown between the way senior executives view their companies and the way their customers do. After all, it's marketing's job to be the champion of the customer for the CEO. What is surprising, however, is the enormity of the gap. A study reported in the Harvard Management Update finds that 80 percent of company executives believe that their companies provide a “superior” customer experience. Only 8 percent of their customers agree.10 This finding is confirmed in the Temkin Group report, “The State of Customer Experience Management, 2014,” which found that only 10 percent of firms are customer centric.11
Of course, positive change for customers will happen only when CEOs view their companies from their customers' perspective. After all, there's no need to change things when you believe you are already doing a superior job.
It is easy to blame CEOs for being shortsighted. The sad truth is that CEOs' complaints about marketing are valid. Marketers do a terrible job of linking their efforts to tangible business outcomes. To be fair to CMOs, it isn't for lack of desire or effort. The problem is more pernicious. All too often, the expected linkage isn't there—and it never was! The underlying assumptions CMOs use to justify most of their investments in improving the customer experience are wrong.
Growth Is Hard to Find
CEOs at every public company are obsessed with achieving two outcomes: profits and growth. The reason for profits is obvious: Profits determine a company's viability.
It is growth, however, that is the lifeblood of companies. It is arguably the most important gauge of a company's long-term success. It is what creates economic value for shareholders. As a result, growth is the common goal of every CEO of a public company and one of the most important metrics by which the board of directors will assess a CEO's performance.
Unfortunately, growth is a goal that is seldom achieved. An investigation of 4,793 public companies reported in the Harvard Business Review found that fewer than 5 percent achieved net income growth of at least 5 percent every year for five years.12 Furthermore, once growth stalls, the odds of ever resurrecting even marginal growth rates are very low.13 Consequently, although there is no question that growth is the imperative, the dismal results for most companies prove that it's hard to know just how to make it happen.
Deconstructing Market Share
If the goal is market share growth, then we need to begin by understanding what actually drives market share. Strangely, although growth is the goal of virtually every CEO of every public company, few managers know the main components of market share. Virtually all managers calculate market share as follows:
In other words, they simply take the sales figure for their firm or brand and divide this by total sales for the category.
The good news is that this is technically correct. The bad news is that it provides no strategic guidance for growing market share. To do that, managers need to understand the impact of three distinct components that drive the market shares of all firms:14
- Penetration: This is the proportion of customers within an industry category who use your brand at least once in a given time period.15 It is calculated as follows:

- Usage: This is a measure of how heavily customers of your brand use products in the category relative to all customers in that same category.16 It is calculated as follows:

- Share of wallet: This is the percentage of your customers' spending in the category that is allocated to your brand.17 It is calculated as follows:

Looked at this way, the formula for market share becomes as follows:

Viewing market share as a function of these different components points us toward three very different strategies for growth.
A penetration strategy is all about acquiring new customers. This means persuading potential customers to try the brand and expanding into new markets. Without question, acquiring new customers will always be vital to the success of any business. As markets become saturated, however, it gets more and more difficult to find new potential customers. In fact, lower demand and higher competition in the developed world has caused some of the most-respected brands to chase growth in the developing world.
A usage strategy is about getting consumers of your brand to increase their total consumption in the category. In other words, if your brand can get its customers to buy more in the category than competitors do, your market share will increase. It's a good idea if you can do it. For example, we are aware of one toilet bowl cleaner that wanted to increase usage of its product to increase its market share. Unfortunately, convincing consumers to clean their toilets more frequently wasn't a realistic option. Instead, the company increased the size of the opening on the spout used to spray the cleaner into the toilet. The result was that more cleaner went down the toilet, and hence the bottles ran out sooner, thereby requiring more frequent purchases of the product.
For most categories, however, getting customers to buy more is very difficult to do. Need tends to drive most of our purchases. For example, we don't tend to buy more toothpaste when we start making more money (and we probably wouldn't even if they increase the size of the opening on the tube).
A share of wallet strategy is about getting your customers to allocate a greater percentage of their spending in the category to your brand. It is almost always easier and more cost-effective to improve current customers' share of spending with a firm (i.e., share of wallet) than it is to acquire new customers. This is because, in most categories today, consumers are not loyal to a firm or a brand but rather by a set of firms and brands.
This means that more customers alter their spending patterns instead of completely halting business with a firm. Therefore, efforts designed to manage customers' spending patterns tend to represent far greater opportunities than simply trying to maximize customer retention rates. For example, a study by Deloitte finds that nearly 50 percent, on average, of hotel loyalty members' annual hotel spend is not with their preferred brand.18 Moreover, a study by McKinsey finds that the cost of lost wallet share typically exceeds the cost of customer defections. For example, McKinsey found that on average 5 percent of bank customers close their checking accounts each year; the impact of losing these customers results in a loss of 3 percent of the banks total deposits. By contrast, 35 percent of customers reduced their share of deposits each year, resulting in a loss of 24 percent of total bank deposits.19 Moreover, they observed this same effect for all 16 of the industries that they examined.
Although managers need to consider how each component of market share fits into their firms' overall growth strategies, share of wallet is the factor most directly affected by the customer experience. After all, share of wallet is arguably the most important gauge of a customer's loyalty—in fact, in their seminal Harvard Business Review paper, business consultant Thomas Jones and esteemed Harvard professor W. Earl Sasser, Jr., assert that share of wallet is “the ultimate measure of loyalty.”20 Clearly, loyalty builds as the result of consistently positive customer experiences.
As a result, both CEOs and CMOs make customer loyalty a top priority. Seventy percent of CMOs rank customer loyalty as a top three strategic priority for their firms—93 percent put it in their top five.21 Similarly, CEOs consistently rank customer relationships in their top challenges—in fact, a recent global survey of CEOs found that this challenge is second only to getting top caliber employees.22
To achieve this goal, firms worldwide have adopted holistic customer experience management programs with the clear aim of improving the share of business that customers allocate to their brands. In fact, 65 percent of companies have a senior executive in charge of their company's customer experience efforts.23 And to help these companies, an entire industry has developed to maximize the customer experience at all points of contact within a company.24 The result is that companies spend billions of dollars each year to improve the customer experience.
To ensure that these efforts are positively affecting customer loyalty, most CMOs measure and manage customers' satisfaction and recommend intention levels (see Figure 1.1). In fact, marketing executives frequently rank customer satisfaction as their number one priority.25 Why? Because managers believe that spending on the customer experience results in the following chain of effects: customer experience → customer satisfaction → share of wallet.

Figure 1.1 Customer Loyalty Metrics Tracked by CMOs26
Unfortunately, it doesn't work out that way. Although the goal is admirable and the focus on the customer experience is imperative, managers are unable to connect their efforts to improve the customer loyalty metrics that they track with business growth. Spending more money on the customer experience often doesn't result in happier customers.27 Probably more critical for managers, improved satisfaction rarely leads to improved market share.
To find out why, we undertook an intensive investigation into the relationship between satisfaction and business outcomes. Our research—conducted with Professor Sunil Gupta at the Harvard Business School—uncovered two critical issues that have a strong negative impact on translating customer satisfaction into positive business outcomes. Moreover, these issues are equally applicable for other commonly used metrics, such as recommend intention and the Net Promoter Score (NPS).28 These two problems can be summarized as follows:
- Satisfaction ≠ market share
- Satisfaction ≠ share of wallet
Given the serious potential for damaging the financial performance of a company, these findings should affect every company's customer experience strategy.
Different Metric, Same Outcome
Before discussing the two most common problems, it is important for managers to understand that whether your firm tracks satisfaction, recommend intention, NPS, or some other commonly used customer survey–derived metric, you are unlikely to get managerially relevant differences in terms of their relationship to growth. This is because these metrics are actually measuring the same underlying construct—specifically, how positively customers feel toward the brand.29 So the argument that one metric works significantly better in linking to growth is not only erroneous but has been conclusively proved to be false in all large-scale peer-reviewed scientific investigations.30
Our own research clearly and easily demonstrated the fallacy of the “my metric is best” argument. We examined the NPS, which was sold as “the single most reliable indicator of a company's ability to grow.”31 To see whether that was indeed the case, we chose to examine the same data used to make this claim. Specifically, we replicated the charts used in the book The Ultimate Question by Fred Reichheld, the creator of NPS. These charts were used to demonstrate the performance of NPS in linking to growth. Because these industries were specifically selected for presentation in the book, they would clearly be expected to serve as the best examples of the relationship between NPS and growth.32
Without question, the strength of the relationship between NPS and business growth presented in these charts was impressive. But was it superior to other metrics? To find out, we used the data from these charts to compare NPS levels with customer satisfaction, specifically the American Customer Satisfaction Index (ACSI). Reichheld asserted that the ACSI was examined and found to have a 0.00 correlation to growth.33 (A zero correlation means that there is absolutely no connection to growth whatsoever.) Therefore, our examination should have given every advantage to NPS.
The results of our investigation, however, unambiguously proved that the claims of NPS's superiority were false. The left side of Figure 1.2 shows the NPS charts presented in The Ultimate Question. For the charts on the right, we simply substituted the ACSI levels for NPS for the same time periods. Surprisingly, the ACSI tended to perform better despite the fact that these same charts were presented as prime examples of the strength of the NPS-growth relationship.

Figure 1.2 A Comparison of Net Promoter Score and the American Customer Satisfaction Index Using Net Promoter Data from the Book The Ultimate Question
It is important to note that these charts do not prove that either the ACSI or NPS are strong predictors of growth. These examples simply allowed us to test the claims of superiority by comparing the original NPS data with the ACSI. In fact, there were serious problems with using this method as evidence of a relationship to growth. The growth rates presented in The Ultimate Question included time periods that occurred before the NPS time frames (in other words, the linkage was to the past, not the future). As a result, it does not represent a valid test of the relationship between the ACSI or NPS and business growth. That requires a rigorous scientific investigation, which looks at firms in numerous industries over time.
Fortunately, as noted earlier, that has already been done—several times—by leading academic researchers and reported in some of the best peer-reviewed scientific journals. The results from all of these studies find the same poor relationship to growth. To quote professors Van Doorn, Leeflang, and Tijs, “We find that all metrics perform…equally poor for predicting future sales growth and gross margins as well as current and future net cash flows The predictive capability of customer metrics, such as NPS, for future company growth rates is limited.”34
Now we explain why this is so.
Satisfaction ≠ Market Share
The empirical association between a firm's market share and the (mean) satisfaction of its customers is not positive Not a single company with a market share above 30 percent could be said to have high customer satisfaction. All firms with higher levels of satisfaction also had lower market shares.35
—Professor Claes Fornell regarding his examination of the Swedish Customer Satisfaction Index
Most managers believe that higher satisfaction and NPS levels are associated with higher market share levels. CEOs and boards of directors are so convinced of this that it has become quite common to base employees' compensation in part on achieving targeted customer satisfaction levels.
The unfortunate reality for managers betting on satisfaction, however, is quite the opposite. For most sectors, the relationship between companies' customer satisfaction/NPS levels and their market shares is negative. In other words, higher company (or brand) satisfaction/NPS levels tend to correspond to lower market share.
The first reaction of most managers to this fact is disbelief. After all, the press is filled with articles from consultants and business pundits that purport to show how improving satisfaction/NPS leads to amazing market share success. Although we have no doubt that these pundits can point to examples of firms that grew while increasing their satisfaction/NPS scores (just as every miracle weight loss cure has testimonials to support their claims), the data supporting a negative relationship are too overwhelming to deny.
In fact, we see examples of this negative relationship all the time. We simply don't pay attention to it because it doesn't correspond to what we expect to see. Regardless, it is quite literally staring us in the face.
Think for a moment about the big three burger chains in the United States. McDonald's consistently ranks below Burger King and Wendy's in customer satisfaction. For 17 of the 18 years that the ACSI has tracked these firms, Wendy's has always had the highest satisfaction level, Burger King has been second, and McDonald's has ranked third. Despite its consistent last place satisfaction levels among the big three, however, McDonald's has by far the largest market share (see Figure 1.3).

Figure 1.3 The Relationship between Satisfaction and Market Share Is Often Negative
Satisfaction levels from the American Customer Satisfaction Index
The story is similar in retail. Since 2007, Walmart has recorded the lowest customer satisfaction scores of all discount retailers tracked by the ACSI. Target, Sears, and JCPenney all consistently outperform Walmart on customer satisfaction year after year. Despite low relative satisfaction levels, however, Walmart has a dominant market share. In fact, outside of the U.S. Department of Defense and China's People's Liberation Army, Walmart is the largest employer in the world.36
The negative satisfaction–market share relationship also holds true in financial services. For example, MetLife has significantly lower satisfaction than its main competitors for life insurance but has substantially greater market share. And in retail banking, larger banks have substantially lower satisfaction levels than their regional bank and credit union competitors but far greater market share. In fact, credit unions have achieved the highest customer satisfaction level of any industry investigated by the ACSI37 yet they hold correspondingly very low market shares relative to their big bank competitors.38
The reality is that satisfaction is not a predictor of market share. However, market share is a strong negative predictor of future customer satisfaction.39 So for firms with high market share levels (or goals of attaining high levels), a focus on high satisfaction is not compatible.
The primary reason for this seemingly counterintuitive finding is that the broader a company's market appeal relative to the offerings of competitors, the lower the level of satisfaction. Why? Gaining market share typically comes from attracting customers whose needs are not completely aligned with the company's core target market. As a result, on the one hand, smaller niche firms are better able to serve their customers (see Figure 1.4). Large market share firms, on the other hand, must by their very nature serve a more diverse set of customers. The more diverse the customer base, the less likely that a firm's offering will meet a customer's ideal—hence, satisfaction will be lower. Yet because of their appeal to a broader group of customers, these firms generate higher market share than their smaller niche competitors.

Figure 1.4 Mass Market Brands versus Niche Brands
Mass market brands have lower satisfaction scores than niche brands. They also have a wider dispersion of customers—and as a result, many don't receive their ideal offer. Niche brands must appeal to a small, more homogeneous group to survive.
The fact that firms with more similar customer bases tend to have higher satisfaction provides managers with another uncomfortable reality. Customer satisfaction ratings can increase as a result of a decline in market share. For example, an examination of the ACSI shows that Burger King's satisfaction levels rose over the same time period that it was losing share to McDonald's and Wendy's, dropping it from the second- to the third-largest fast food burger chain. Similarly, Kmart scored its biggest year-over-year increase in customer satisfaction (and its highest ACSI score since tracking for the firm began) as it was preparing its bankruptcy filing as a result of large-scale customer defections. The reason for this is that when customers are defecting, the customers that remain typically like the firm or brand—if they didn't, they would leave as well.
All of us have also experienced another common cause of the negative relationship between satisfaction and market share in some industries. Specifically, busy places often mean more headaches. Virtually all of us have been to stores where the lines were so long that you could feel yourself age while waiting to pay for your items and leave. As a result, large retailers often see a negative relationship between their stores' sales and their corresponding satisfaction levels (see Figure 1.5). Of course, no manager recommends reducing the number of customers who come into the store to improve satisfaction. Unfortunately for these high-sales store managers, their stores are typically expected to achieve the same satisfaction levels as their less busy sister stores.

Figure 1.5 For Many Retailers, the Relationship between Store-Level Satisfaction and Revenue Is Negative
Each point in the chart represents an individual store within a particular brand. The y-axis shows the revenue for a particular store, and the x-axis shows its corresponding satisfaction level. A negative correlation in this case indicates that store size (based on revenue) and satisfaction are negatively related—in other words, higher revenue is associated with lower satisfaction.
Given that brands with larger market share are likely to have lower satisfaction than smaller brands, how exactly are managers to compare their performance vis-à-vis competition? In our own experience, managers of some the world's largest brands often benchmark their performance against the highest satisfaction brands in the category despite the fact that their share is often significantly smaller. Moreover, senior executives tend to view these levels as attainable targets for their own firms given that they were achieved by a competitor.
Consultants often go even farther down this path. It is virtually impossible for managers to go through their employment histories without hearing a management guru expound on how their brands should be more like the great but niche brands of Harley Davidson, Disney, Cirque du Soleil, and so on. The underlying argument is that customer expectations are set not only by the performance of direct competitors but by all firms with which customers conduct business. Although there may be a grain of truth to this argument, most of the time it is not managerially relevant. It is good to learn from the experiences of other firms, but setting target satisfaction levels based on the performance of niche players isn't just unrealistic; it's a bad business decision. If the goal is market share, pursuing the highest satisfaction levels is not a compatible strategy!
Satisfaction ≠ Share of Wallet
When is the ultimate customer-service-measurement number not enough? That's what Jiffy Lube asked recently when the company discovered that its Net Promoter Scores—a popular customer-service metric known as the “one number you need to grow”—weren't actually helping it grow One of the initial head-scratching finds was that the overall NPS rating had almost no correlation to return visits. That meant customers who said they'd gladly recommend Jiffy Lube to friends didn't necessarily return to the store themselves.40
—Ad Age
It is easy to understand why managers expect customers' satisfaction and NPS levels to be strongly linked to the share of category spending that customers allocate to the brands that they use. Unfortunately, it is not even remotely true.
Without a doubt, numerous scientific studies show that there is indeed a statistically significant positive relationship between satisfaction and customers' purchasing behaviors.41 Unfortunately, there is a problem with this relationship: Although it is statistically significant, it most definitely is not managerially significant.
Managers tend to misunderstand the concept of statistical significance. In everyday English, significant means “important.” In statistics, however, it means “probably not a random occurrence.” The problem for managers is that many things can be significant in the statistical sense without being important. That's definitely the case with the relationship between satisfaction and customers' purchasing behaviors. In fact, the relationship is so extraordinarily weak that it is managerially irrelevant.
This is not an overstatement. Satisfaction (and NPS) is so weakly correlated with the share of spending that customers allocate to the brands that they use that it is useless as a metric to drive higher share of wallet.
This naturally raises the question, “Exactly how weak is the relationship?” In our examination of the relationship between satisfaction/NPS and share of wallet, we reviewed more than 250,000 consumer ratings covering in excess of 650 brands from more than a dozen countries; we found that the average variance explained is around 1 percent.42 In layman's terms, this means that 99 percent of what is going on with consumers' share of category spending is completely unexplained by knowing their satisfaction level or NPS. Worse still, the effect of the change in satisfaction on changes in share of wallet is even weaker. Our research finds that changes in satisfaction (and NPS) explain a miniscule 0.4 percent of the change in share of wallet over time.43
Given that managers measure and manage satisfaction levels and NPS because they are thought to link to growth, this is disastrous. When the relationship is this weak, there is no reliable way to predict financial outcomes from improving satisfaction and NPS.
Most managers don't want to accept this reality. In fact, we are often challenged by managers on this. Fortunately for us, it is very easy for managers to see this for themselves using simple spreadsheet software such as Microsoft Excel.
If your firm is collecting satisfaction and/or NPS data, simply create a spreadsheet containing customers' satisfaction and share of wallet data. Specifically, input customers' satisfaction ratings (or NPS classifications) for your firm or brand in one column and their share of wallet in another (see Figure 1.6). Now all you have to do is determine how much of the variance in share of wallet is explained by knowing satisfaction levels or NPS. This is done by computing what is called the R-square. Fortunately, this isn't difficult to do. Microsoft Excel provides a simple function to compute the R-square, so there is no complicated mathematics necessary to find out how strongly your satisfaction/NPS metric links to your customers' share of spending with your brand.

Figure 1.6 It Is Easy to Prove that Satisfaction and NPS Are Very Weak Predictors of Share of Wallet
It is easy for managers to see for themselves that the correlation between satisfaction/NPS and share of wallet is very weak by using simple spreadsheet software such as Microsoft Excel. Simply input customers' satisfaction (or NPS) levels for your firm or brand in one column, and their corresponding share of category spending (share of wallet) in another column. Then compute the R-square, the squared correlation coefficient. The percentage of variance explained (i.e., R-square) is almost always less than 5 percent and is typically around 1 percent.
Note 1: In Microsoft Excel the formula for calculating R-square is =RSQ(column1,column2). Columns 1 and 2 correspond to customers' satisfaction and share of wallet levels—when computing R-square it does not matter whether satisfaction is column 1 or column 2 in the Microsoft Excel formula.
Note 2: If you are using the Net Promoter Score, simply input “3” for Promoters, “2” for Passives, and “1” for Detractors.
Doing this always results in bad news. The percentage of variance explained will almost always be less than 5 percent—typically around 1 percent—meaning that 95 percent or more of the variation in your customers' spending is completely unexplained by the satisfaction or NPS metric your firm is tracking.
Always Wrong on Average
Given that it is so easy to prove that customers' satisfaction and NPS levels have virtually no meaningful correlation to share of wallet, why is it that managers overwhelming believe that they do?
The most important reason is that we want to believe. It fits our sense of how the world should work. We want to believe that more satisfied customers allocate a greater share of their spending than less satisfied customers.
Research and consulting firms have fed this belief by presenting misleading information about the relationship between customer satisfaction and spending. For example, virtually every manager has seen or heard something similar to the following: On average, promoters/delighted customers spend $X more than detractors/dissatisfied customers (see Figure 1.7).

Figure 1.7 Examples of Reported Higher Average Spending levels for one group versus another based on satisfaction, Net Promoter Score, and liking levels
To be clear, we have no doubt that the averages presented by consultants and researchers are correct. They are just irrelevant. Because satisfaction and NPS do such a poor job of explaining customers' spending levels, using satisfaction and NPS levels to group customers does not meaningfully explain why one group spends more than another.
Average levels are a means of gauging the center of a distribution of people. As a result, in calculating the average, both positive and negative extremes cancel each other out (see Figure 1.8).

Figure 1.8 Averages Can Be Misleading because Positive and Negative Values Cancel Out
To get a better idea as to why this is misleading, instead of thinking about satisfaction and spending, think about peoples' weight and the regions in which they live. Let's assume that people in the northern part of the country weigh more on average than people in the southern part of the country. Let's also presume that the difference is statistically significant.
Even though this information is true, it doesn't help very much in gauging the weight of any individual. In fact, if you were provided with only the weight of each individual in the country, you would not be able to accurately predict whether they lived in the northern or southern part of the country.
This is because there is a huge dispersion in the weight of individuals within each region of the country. As a result, there will be a tremendous overlap of people with the same weight (above and below average) in both the north and the south.
The same problem happens with using satisfaction levels and NPS to distinguish customer spending patterns (see Figure 1.9). Although the average may be higher for each group, the overlap is so great that it is managerially irrelevant.
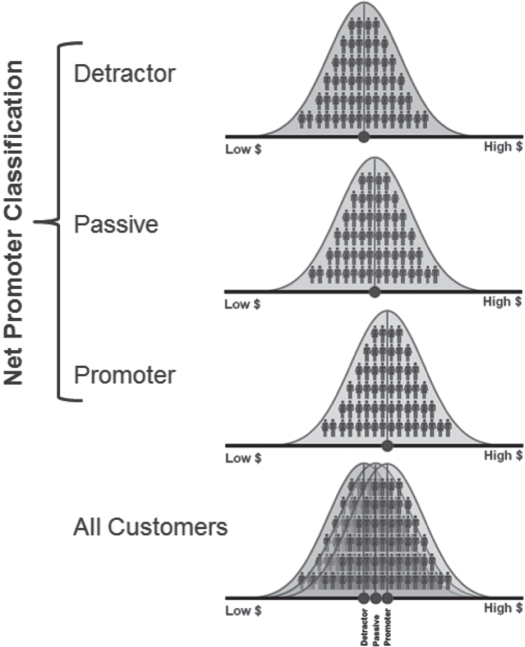
Figure 1.9 Averages Based on Satisfaction and NPS Levels Do Not Accurately Reflect Spending Differences by Individuals within Each Group
Another, less obvious way that researchers and consultants misleadingly use satisfaction and NPS levels is through the use of firm-level averages (as was done in Figure 1.2). This is especially problematic when these firm-level averages are correlated to metrics based on individual customer behaviors, such as share of category spending, sales, and so on.
For example, in our research we found that firm-level satisfaction for U.S. banks and credit unions was highly correlated to the average share of deposits customers held with the various financial institutions that they used.44 The problem was that at the individual customer level, satisfaction was very weakly correlated to share of deposits.
Because managers are trained to benchmark their firm's performance relative to that of competitors, these firm-level analyses can appear very persuasive. Unfortunately, most managers are unaware that correlations at the aggregate level are typically much higher than at the individual level. As was shown in Figure 1.8, this occurs because positive and negative extremes at the individual level cancel themselves out at the group level.
Therefore, firm-level correlations that differ dramatically from individual-level correlations should be treated with suspicion. In fact, there are actually statistical rules for when you are allowed to aggregate data.45 A simple rule of thumb is that you are never allowed to aggregate data when the relationship between the variable you are tracking and the outcome variable is very weak.
The customer-level relationship between your metric of choice (e.g., satisfaction, recommend intention, NPS classifications of promoter, passive, or detractor) and share of wallet must first strongly link before you can aggregate the data. If this is not the case, the use of aggregate-level data will most likely result in what researchers call the ecological fallacy.46 Specifically, an aggregate-level correlation is incorrectly assumed to apply at the individual level.
An overly simplified example should help demonstrate the problem of the ecological fallacy. In 2011, National Geographic produced a video designed to show the world's most “typical” person.47 What National Geographic found is that the typical person is a 28-year-old Chinese man who makes less than $12,000 per year and has a cell phone but not a bank account. Although that insight makes for fun trivia, it clearly isn't very useful when thinking about the best way to understand the needs and wants of individuals, because people vary dramatically from the average.
For group-level information to be managerially relevant, the individuals within the group need to reflect the average—otherwise, the average gives wrong information about the people within the group. Therefore, when presented with averages (e.g., the average promoter spends $X), managers need to insist that their research partners provide them with the individual-level correlations corresponding to these averages so that they can gauge the usefulness of this information.
The good news is that individual-level correlations from a firm's customer research are typically very easy for researchers to provide. Furthermore, because research professionals and consultants know (or should know) about the ecological fallacy, they should want to minimize the possibility that managers will draw incorrect conclusions from their research. Regardless, it is management's responsibility to insist that they do.
A Cautionary Tale
The fact that satisfaction does not link to customers' share of category spending has huge implications for managers. Managers typically survey customers to gauge their experience via metrics such as satisfaction, recommendation intention, and purchase intention. The underlying logic is that there is a virtuous chain of effects that lead from positive customer perceptions of product/service performance to share of wallet, specifically product/service performance → satisfaction/intentions → share of wallet. For that reason, managers identify those aspects of the product/service experience that most strongly affect these metrics as primary targets for improvement in the belief that this will ultimately result in improved share of wallet.
Without question, the logic is intuitive It also doesn't work!
The result is that companies spend a great deal of time and money on efforts to improve customers' perceptions of the experience, but typically they find that the impact on customers' share of spending shows very little improvement. To see the danger of this situation, one need only look to the biggest company on the planet, Walmart.
During the Great Recession of 2008, Walmart was one of a very few retailers seeing same-store sales increases. Most other retailers, including its rival Target, saw significant same-store sales declines over this same period (see Figure 1.10).

Figure 1.10 Walmart Performed Consistently Well during the Recession of 2008 While Most Retailers Saw Sales Declines
With competitors reeling from the recession, Walmart embarked on a new initiative to “crush the competition,” to quote Time magazine.48 Dubbed Project Impact, it represented a dramatic remodeling initiative designed to improve the customer experience based on extensive customer feedback. Despite consistent sales performance over time, the one area in which Walmart significantly lagged its competitors was customer satisfaction. Project Impact was going to change that and crush the competition in the process.
As a result, the familiar pallets in the aisles stacked high with items disappeared. Displays at the ends of aisles were reduced. And the dizzying array of merchandise jammed on the shelves was streamlined so as not to overwhelm customers.
The good news was that it had a very positive effect on customers' perceptions of shopping at Walmart. In fact, Walmart reported that because of Project Impact, customer satisfaction jumped to an all-time high.49
Unfortunately, the launch of Project Impact resulted in the one of the longest same-store sales declines in the company's history (see Figure 1.11). Higher customer satisfaction actually resulted in customers allocating a lower share of their spending to Walmart.

Figure 1.11 The Launch of Project Impact Began One of the Longest Same Store Sales Declines in Walmart's History
To be clear, the problem wasn't that customers stopped shopping at Walmart. “The customer, for the most part, is still in the store shopping,” observes Charles Holley, Walmart's Chief Financial Officer, “but they started doing some more shopping elsewhere.”50
Moreover, the loss in sales was not the result of a bad economy. Competitors like Target and Dollar Stores enjoyed strong same-store sales growth during this same time period.51
The reason for the decline in sales rested squarely on the rollout of Project Impact.52 The effort cost Walmart $2 billion—enough revenue to qualify as a Fortune 1000 company. The executive behind Project Impact is now an ex-Walmart employee, and his team has been effectively disbanded.53
Project Impact shows the danger of focusing on improving customer satisfaction absent a strong linkage to customer spending. To quote William S. Simon, CEO of Walmart's U.S. division, “They loved the experience. They just bought less. And that generally is not a good long-term strategy.”
The Moral of the Story?
Without question, no firm can last for very long without satisfied customers. But a misguided focus on improving satisfaction and NPS levels is a recipe for financial disaster.
There is no getting around the fact that satisfaction and NPS levels have almost no correlation to the share of category spending that customers give to your brand. Please, don't take our word for it—prove it for yourself using simple spreadsheet software (as was shown in Figure 1.6). Without a strong linkage between satisfaction/NPS levels and customers' share of spending, there is virtually no way to make efforts to improve satisfaction and NPS pay off.
Equally damning, if the goal is market share leadership, then pursuing satisfaction leadership is not compatible. In fact, to gain market share, managers need to accept lower satisfaction levels by appealing to a larger, more diverse customer base.
This contradicts the message of virtually all programs discussed in the business press regarding the relationship of satisfaction and NPS levels to business performance. The grim reality is that most of these efforts are doomed to fail. Moreover, they often run counter to a firm's competitive positioning and strategy.
Although the current situation is grim, it doesn't have to be. These issues are solvable. But they won't be solved by continuing to do what's always been done, only better. It requires new ways of looking at the problem. More important, it requires a willingness to let go of legacy systems that don't work.
That's hard. Many managers have put their reputations on the line in support of these systems. Some have even reported flawed linkages to customer spending—of course, the corresponding growth in sales that would be expected from such a linkage rarely materializes.
What is even harder, however, will be facing competitors willing to make the change. They will be able to accurately identify what it really takes to drive customers' spending with their brands. They will make the right calls to drive market share.
As a result, change will happen. In the end, the truth will win. And the truth is that the current situation is “Oh my God!” bad.