
With the default installation of Wireshark, there are couple of command-line tools that get installed. These command-line tools are some sort of protocol analyzers, which can be taken advantage of when you don't have a GUI interface to work with or you don't have an option to install the GUI. There are good number of tools available in Wireshark to do this, which are Capinfos, Dumpcap, Editcap, Mergecap, Rawshark, Reordercap, Text2pcap, and Tshark.
The most common and widely used command-line tool for protocol analysis purposes is Tshark, which is capable of capturing data through listening to a live wire, and it can even analyze your already saved trace files. The captured packets are translated into an understandable form and printed to the standard output, or you can save them to the file of your choice. Dissectors that are used by Wireshark the same Tshark utilizes.
Tshark uses the pcap library to capture and translate the packets from the live wire or from the already saved files. Just like Wireshark's filtering option, we can enable filters in Tshark. There are multiple customizable options present in Tshark that can be leveraged to use it in a more advanced fashion.
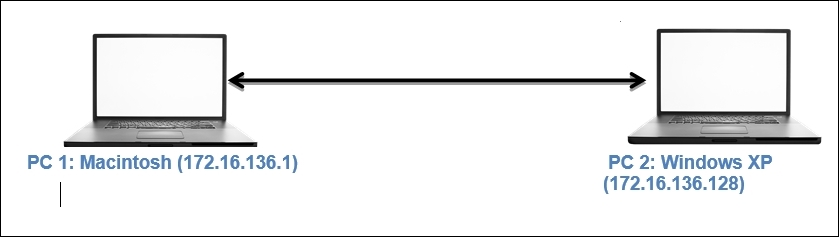
Wireshark has a CLI version, which is almost similar to Tshark in terms of the syntax and various options that both of them support equally. Let's understand this topic better with an example. Say, for instance, we have an Apache web server and FTP running on a Windows XP box located at 172.16.136.128 and a Macintosh client running at 172.16.136.1. Using our custom infrastructure, we will generate some network packets and try to use Tshark for capturing and analysis purposes.
When working on a Windows PC, you might have to create the environment variable before you can start using Tshark. The following screenshot belongs to Tshark, displaying tshark –h (help options) within the CLI:
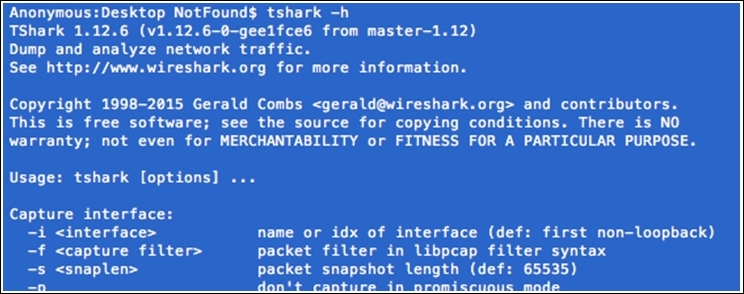
Figure 3.22: Tshark help
We will start with the basics and eventually move toward the creation of filters, and then we will collect statistics using the CLI-based tool Tshark:
- The first thing we should know is how many interfaces do we have available to capture packets. Use the following command to check
tshark -D: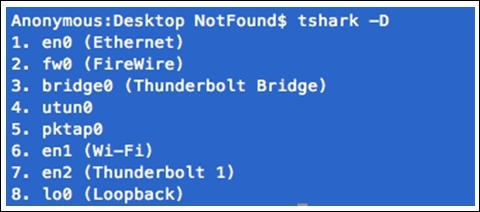
Figure 3.23: Interfaces available
If you do not specify any interface for capturing,
tsharkwill choose the first interface that is available on its own. Interfaces can be chosen by their names and also by the sequence number they appear in. Refer to the preceding screenshot, which shows all the interfaces that are available. - I have a custom interface
pktap0that will listen to the connection between my client and the server. So, the command to initiate the capture process will betshark –i pktap0 or tshark –i 5: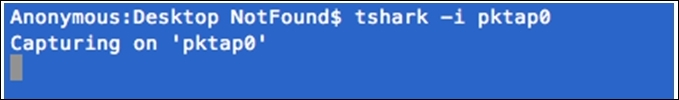
- Now, let's generate some HTTP traffic by visiting the web page hosted on our server from the client (I am using the
curlcommand-line tool for browsing purpose):
- As soon as the preceding command has been issued, a couple of packets are captured by
tsharkon thepktap0interface. And a summary of translated packets for better understandability can be seen. Refer to the following screenshot that illustrates the same: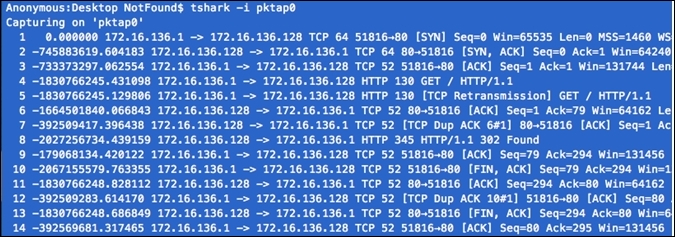
Figure 3.24: Packets captured at pktap0
If you want to stop the capture process at any point, press Ctrl + C.
- To save the translated packets to a file, we need to specify the
–wswitch, along with the command that will save the raw data packets to the specified file: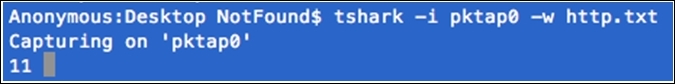
A total of 11 packets have been captured, and a text file is being created on the desktop with the
name http.txt, which will contain raw data as shown in the following screenshot: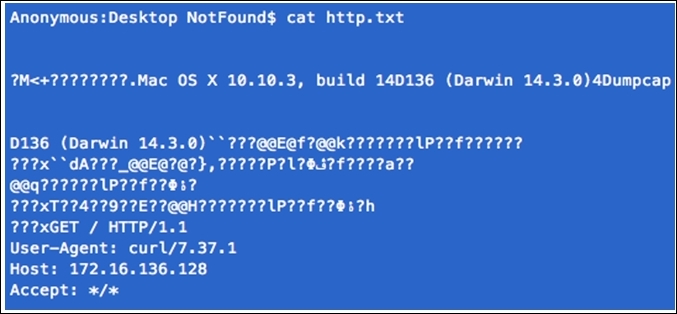
Figure 3.25: Raw data stored in file
- If you want to save the normal translated form (like the one shown in the list pane in Wireshark), as shown in the standard output, then just redirect the output of the tshark command to a file of your choice, as shown in the following screenshot:
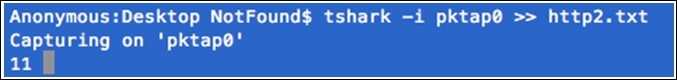
As you can see,
11packets are captured and redirected to the text filehttp2. Let's see what is stored in thehttp2.txtfile: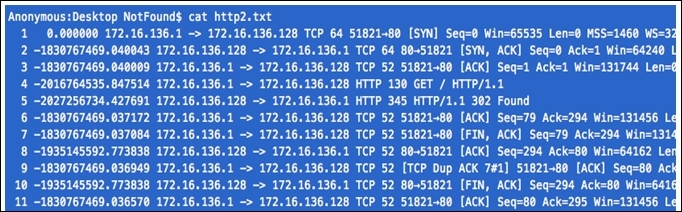
Hopefully, by now you must have clearly understood the difference between both ways of saving the raw data packets and translated packets. Both of the techniques can be used in multiple scenarios.
- The next big thing you will learn is the different filters (Capture, Read, and Display) available in Tshark. We know about Capture and Display filters already, but here we have one more category, that is, the Read filter. The Read filter is closely similar to the Capture filter, as both of them can filter packets from the live network. However, the Read filter is also capable of filtering packets out of a saved file. Using the Read filter could be processor intensive, and things like packet loss can happen, so think twice before using it. To display the filter, the
–fswitch is used;–Ris used for the Read filter; and–Yis used for the display filter. Now, I am going to capture only FTP packets using the following syntax: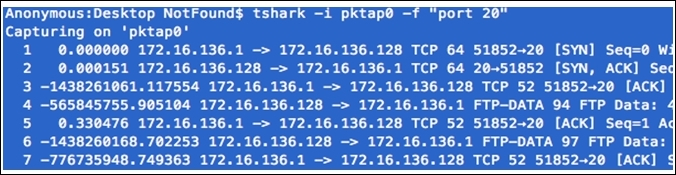
While applying a filter, there is a restriction that the filter expression must be specified as a single argument if it has spaces in between. Then, we need to write the expression within double quotes. Refer to the preceding screenshot that illustrates the same.
- Now, let's try to create one display filter using the
http.pcapfile. I want to filter all packets originating from the web server located at172.16.136.128using thehttpprotocol. - First I captured the communication between the client and server. And save the traffic in file
HTTP.pcap.Once I have enough packets to work with, I will apply display filters, as shown in the following screenshot:
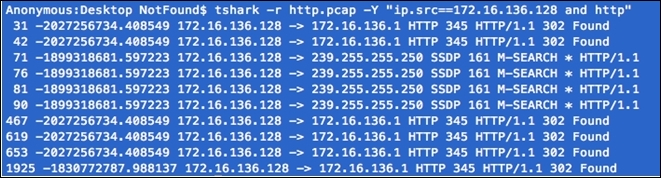
Figure 3.26: Tshark display filter
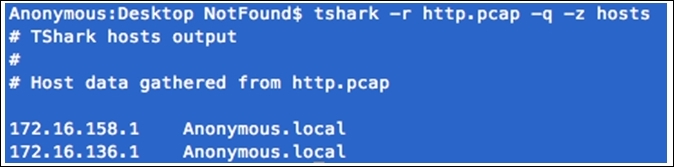
- Suppose you want to quickly collect statistics about the http protocol from the
http.pcapfile. For such a requirement, we can use this command:tshark –r <file-name> -q –z <expression>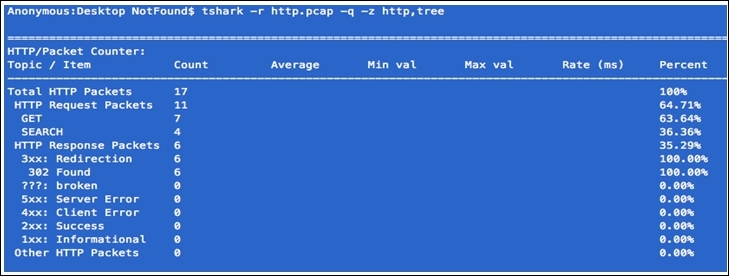
The
-qswitch keeps it silent over the standard output (this is generally used while working with statistics in Wireshark) and the–zswitch for activating various statistics options available. Both of these switches are often used together. - Let's take one more simple example before wrapping this up; from the http.pcap file, I want to figure out how many hosts there are in total during the whole capture time. For such a requirement, refer to the following screenshot:
Here, you learned about the basic theoretical and practical concepts of the CLI utility Tshark, along with how to capture and filter data as per our requirements. With the help of Tshark, it becomes really easy to understand how protocols work; we saw various techniques to collect and analyze the packets. Statistical features in Tshark are rich, which helps a moderate user become advanced with an better understanding of how to analyze network packets.