Monitoring the server
The Monitoring portlet in Server portlets group allows you to monitor a local or a remote Geronimo server. The console is designed to monitor a Geronimo instance running in a separate JVM. The console can gather statistics and performance data from multiple Geronimo servers, and display this data graphically. The Monitoring console uses the Management EJB (MEJB) to gather statistics from a remote Geronimo server. You may also use JMX to gather statistics from a remote server, but this would require the remote server to install and run the org.apache.geronimo.plugins.monitoring/agent-car-jmx/2.1.4/car plugin. The portlet screen is shown below:

The Monitoring console defines Servers and Graphs with statistics collected from servers, and Views consisting of one or more graphs. In this section, we will see how the Monitoring console plugin can be used to monitor a Geronimo server.
Adding a Server
To add a server for monitoring, click on the Add a new server link. This will show a screen similar to the one shown below:

Complete the following fields:
Name: A name to identify this server.
IP/Hostname: Hostname or IP address of the server to be monitored.
Protocol: Select EJB to use the MEJB. Select JMX to use the JMX server in the remote JVM.
Port: The port number to connect to the server. The default port number is 4201 for EJB and 1099 for the JMX protocol.
Username: The administrator username of the remote server.
Password: The password for the username entered above.
Click on Add to complete adding this server. The newly-added server will be listed under Servers, as shown in the screenshot below:

The server is enabled by default. In order to disable the server, click on the Disable link under the Actions column. To edit an existing server, click on the Edit link under Actions. On the next screen, after editing the fields, click on Save to save your changes. A text of Online in the Status column indicates that the Monitoring console is able to connect to the server. Data collection is disabled by default. Enable data collection by clicking on the Enable Query link under actions. After enabling data collection, click on the link provided in the Name or IP/Hostname column to view the live statistics for chosen MBeans, as shown in the next screenshot:

The Statistics Collected column shows the MBeans that are enabled for statistics collection. The Statistics Available column shows the MBeans that can be enabled for statistics collection. To disable statistics collection, click on the X next to the MBean name in the Statistics Collected column. To enable statistics collection, click on the + next to the MBean name under the Statistics Available column.
Adding a Graph
To add a graph, click on the Add a new graph link. This will display a screen similar to the one shown in the next screenshot:
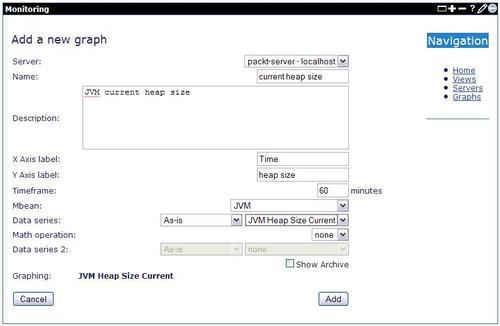
Complete or select the following fields:
Server: Select a server from which the statistics will be collected.
Name: A unique name for the graph.
Description: A description for this graph.
X axis label: A label for the horizontal axis.
Y axis label: A label for the vertical axis.
Timeframe: A time frame for the graph.
Mbean: The Mbean on the server that will provide the statistics.
Data series: Select As-is for the value as it is or Change (Delta) in for the difference. Select the statistic.
Math operation: Select an operation to combine more than one statistic for the graph.
Data series2: Select As-is for the value as it is or Change (Delta) in for the difference. Select the statistic.
Click on Add to add the new graph. The new graph will be shown under Graphs. To edit the graph, click on the Edit link under the Actions column. Click on the graph name to view the graph in a pop-up window.
Creating a new view
You can create a view consisting of graphs. In order to create a view, click on the Create a new view link. This will display a screen similar to the one shown below:

Complete the Name and Description fields for the view, and select the Graphs to be displayed in the view. Click on Save to add the view. The new view will be shown under Views. To edit a view, click on the Edit link provided under the Actions column. Click on the view name to see the graphs in the view. The following screenshot shows a sample view:

This view shows two graphs. The first graph shows the current heap proportion to max heap size over time. The second graph shows the current heap size over time. Note that you can also compose views consisting of graphs from different servers.