
A sensor is a device that can detect changes or events and provide a corresponding output. The output is usually an electronic signal, for example, a light dependent resistor (LDR) outputs a voltage, which depends on the level of light cast on the sensors. When working with electronics, sensors are often divided into analog and digital sensors. Digital sensors can only detect two states, either on or off. The digital sensor can only distinguish if there is voltage going into the sensor or not. In code, this transfers into a 1 for voltage coming in and 0 if there is no voltage present. This is why they are called digital sensors, since they only operate in 0s and 1s. This means that these sensors only have two states, either on or off. A button, for example, is a digital sensor, which can only sense two states, if the button is pushed or not.
Analog sensors, however, can sense a range of values. The LDR, for example, is an analog sensor that changes the output voltage depending on the light level cast on the sensor surface. The problem with microprocessors is that they are digital by nature, and don't know how to handle analog information by default. This is why there are analog pins on almost all Arduino boards, which have an analog to digital conversion built in. These pins can read values ranging from 0 to 1023. In this chapter, we will have a look at some different sensors that may be useful for wearable projects and introduce them to readers that are not too familiar with programming yet.
In this chapter, we will take a look at a collection of analog sensors, which can be used to track movement and light. In the first two examples, we will focus on a stand-alone sensor component, which will involve building circuits using a breadboard. The remaining examples will use sensors that include prebuilt circuits on a PCB board. In this chapter, we will also take a look at different ways to communicate with our prototyping board and how to send data back to the computer.
Tip
If you run out of digital pins, you can always use the analog pins even for reading digital sensors. Just remember that the output will be read in the range of 0 to 1023 and not HIGH and LOW if you are reading them as analog pins. The analog pins can be used as digital pins as well. Analog pin A1 is the same as digital pin 14, and so on.
In this chapter, we will cover bend sensors, pressure sensors, light sensors, accelerometer, gyroscopes, and compass sensors. A sensor is a device that can detect events or changes of different kinds and can provide a corresponding output. It is a device that changes some characteristics due to external conditions and can be connected to a circuit, converting the signal so that it can be interpreted by a microprocessor.
With some sensors, you need to build you own circuitry and interpret the data provided by the sensor through code. Some complex sensors have a built-in communication protocol, which enables them to provide data corresponding to their function. The sensitivity of a sensor indicates how much the output data can change.
The first sensor we will try out is a bend sensor. Sometimes it is also known as a flex sensor, and the name gives a good hint at what kind of sensor this is. As the name suggests, this sensor senses bends. The sensor works similarly to most analog sensors. These sensors are built on the same principal, where they take a voltage input and the sensor acts as a resistor that can change its own resistance. In Figure 2.1 you will find all the components needed for this example. The component labeled as 1, in Figure 2.1, is a regular resistor, which measures 10kΩ. Resistors are some of the most common electronic components that you can find, and are used in almost all electronic devices. A resistor is used to limit the flow of current in an electronic signal. This means that if you apply a voltage at one end of the resistor, it will output a lower voltage at the other end. In the case of this example, we need a resistor to create what is known as a voltage divider in order to get good values from our sensor. The component labeled number 2, in Figure 2.1, is the bend sensor. These sensors detect bending in one direction. When left untouched, the bend sensor will measure about 10kΩ, and when fully bent it will measure around 20 kΩ. Number 3, in Figure 2.1, is the FLORA board we used in the previous chapter:
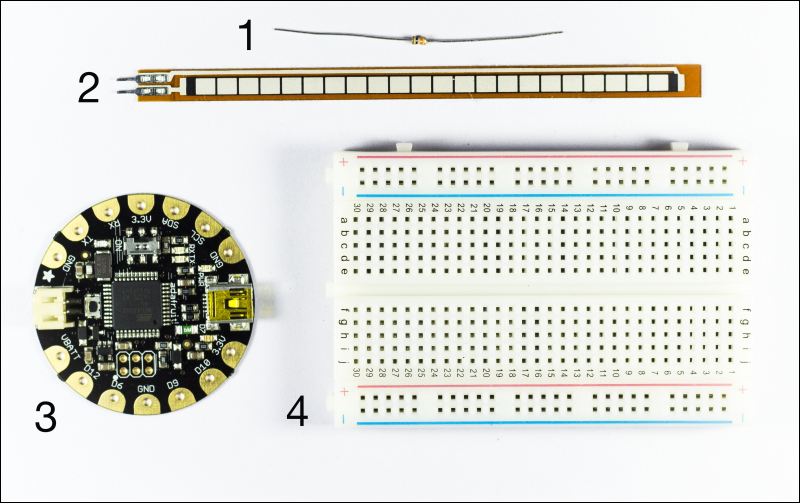
Figure 2.1: Showing 1. The 10kΩ resistor 2. A Bend/flex sensor 3. The FLORA board 4. The bread board
Number 4, in Figure 2.1, is a breadboard, and this is not technically a component. Breadboards are used for prototyping with electronics. When electronics are made, components are soldered together, but before you show how everything connects and what you want to make, it's good if you can try connections out before soldering them together. This is when a breadboard comes in handy. The breadboard in Figure 2.1 is a miniature version of a standard breadboard. The lines of a breadboard are connected vertically in the middle of the board and horizontally at the edges. The + and – line marks the horizontal connections, while in the middle segment of the board the lines connect between the numbers and down from a to j. The following Figure 2.2 shows an illustration of how the breadboard lines connect on the inside of the board:
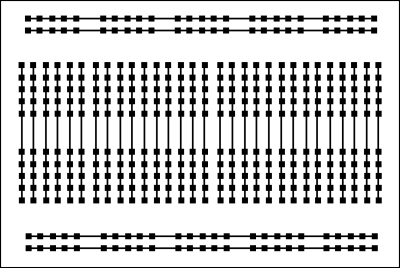
Figure 2.2: Internal connections of the breadboard
Breadboards make a circuit bulkier, but they are not used for the final designs. They are mainly used for trying out connections before soldering your components together.
Wires have also been added, so we can connect our sensor to the FLORA board later on. In Figure 2.3, you will find the necessary connections to be made:
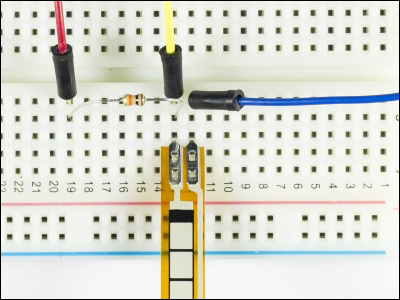
Figure 2.3: A close up of the breadboard connections
On the left side of the resister, we have a wire that connects to the 3.3 V output of the FLORA board. Resistors have no polarity, which means the direction of connection does not matter. They work both ways so to say.
On the right side of the resistor, we connected one of the connections to the bend sensor, and one to a wire that we will connect to an analog pin of the FLORA board. The second connection of the bend sensor is connected to ground. In this circuit, power will be passed and limited through the resistor. Once on the other side of the resistor, some of the electricity will be passed through the sensor and some will be passed back to the analog pin. When we bend the sensor, we make it harder or easier for the electricity to pass through the sensor depending on how we bend it. The overflow of electricity that can't be passed through the sensor will be passed back along the analog pin, which we will read through our FLORA board.
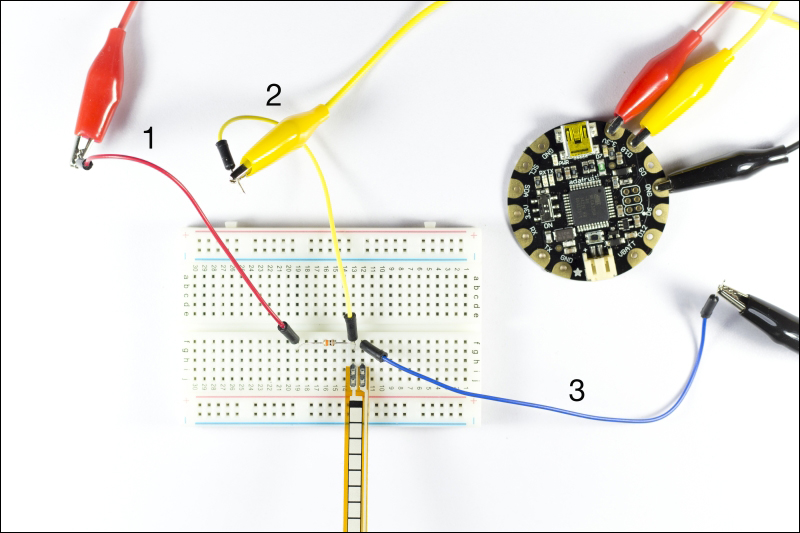
Figure 2.4: Connecting the bend sensor
The preceding Figure 2.4 shows how to connect everything to the FLORA board using alligator clips:
- Cable number 1 connects to 3.3 V
- Cable number 2 connects to D10
- Cable number 3 connects to GND
In order to check that everything works, we need to connect the FLORA board to our computer and write some code. For all of the sensor examples in this chapter, we will be using the serial library to send the data back to the serial monitor in your Arduino IDE. Serial communication is not used in every sketch, so to save memory space, the code that enables the communications is put in a library, which we can call upon when we need it. This is why all serial commands start with Serial., which means that we are calling the any command afterwards from the library. Serial communication is just one of the many communication protocols that can be used. Communication protocols are basically a set of rules on how two devices should act in order to communicate with each other.
//variable to store the analog pin
int bendSensor = 10;

void setup(){
//Start the serial communication
  Serial.begin(9600);
}

void loop(){
//Save the data from the sensor into storeData
  int storeData=analogRead(bendSensor);
//Print the data and add a new line
  Serial.println(storeData);
//Give the computer some time to receive the data
  delay(200);
}
The setup is where we initialize the serial communication. When this is done, you always need to declare the speed of your communication, which is calculated in baud, that is, same as bits per second. The speeds are fixed, so if you want to see what speeds are available, open up your serial monitor and you should find something that looks like Figure 2.5:

Figure 2.5: Showing the serial monitor
In the bottom of the right corner in the serial monitor you will find a drop-down menu with the available speeds. If there is no reason for choosing a particular speed, I usually use 9600 baud. This rate is fast enough for most applications and is supported by most devices. At the top of the serial monitor, you will find an input box where you can send information to the FLORA board. The preceding Figure 2.5 also shows data that is sent from the sensor. In my case, the sensor outputs a steady value of 489 when left untouched. When the sensor is fully bent, the value increases to around 650. In the previous code example, the data was sent back to the computer using the Serial.println() command, which adds a carriage return. This means that when the data is received by the computer, it adds it to a new line when presented on the screen. You can send data without the carriage return by simply using the Serial.print()command. However, this will keep on printing data on the right, on the same line, until the Arduino sends a line return.
The data can instead be formatted by the serial monitor using the drop-down menu to the left of the speed menu. In this drop down, you will find different formatting options such as adding a new line, carriage return, both, or none of them. Remember that the built-in formatting in the serial monitor only works for incoming data. On outgoing data, you will need to format your data in code.
In the next example, we will take a look at how to interact with a pressure sensor.
This example follows the same principals as the previous bend sensor, but this time, we will try out a pressure sensor. The pressure sensor does the same thing as the bend sensor where it regulates a voltage output depending on the pressure applied to the sensor. If the sensor is pressed, it will add to the resistance and the voltage coming out the other end of the sensor will be lower. Again, we will use the FLORA board to detect the changes in the value of the output.
You will need the following components found in Figure 2.6:
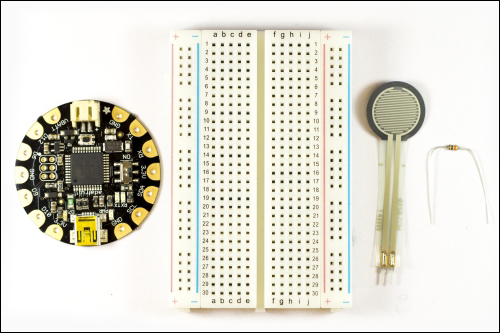
Figure 2.6: The FLORA board, bread board, pressure sensor and 10 kΩ resistor
From the left, you have the FLORA board, breadboard, pressure sensor, and a 10 kΩ resistor. In order to make the circuit, we will be using the same setup as we did in the bend sensor example. The pressure sensor is also known as a force sensor and can be used to detect physical force, touching, or even weight. If weight is what you are looking for, this might not be the best choice since this sensor doesn't output an actual weight value, though by using some fixed weights and some calibration you could make a crude scale.
In Figure 2.7 you will find the necessary connections that need to be made:
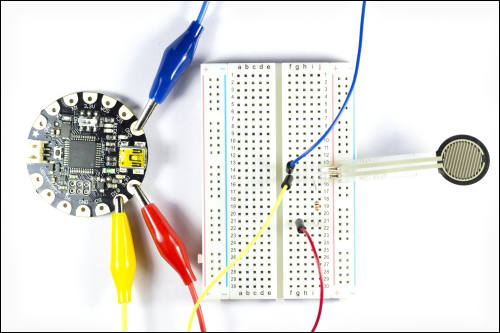
Figure 2.7: Showing the connections to the FLORA board
Let's take a closer look at the connections:
- On the side of the resistor with only one wire, we have a connection to the 3.3V pin on the FLORA board.
- On the other side of the resistor, we have a connection to the first pin of the pressure sensor and a wire connection to D12 on the FLORA board.
- The second pin of the pressure sensor connects to GND of the FLORA board.
To test the range of the sensor, you can use the same code used for the bend sensor, as it prints the analog data back to your serial monitor. In the case of the sensor, I was using, it gave me almost the full range from 0 up to 1023. In the following example, we use the value from the sensor to make a small visualization using the onboard LED on the FLORA board:
//declare variables to store pin numbers
int pressureSensor=12;
int led=13;
void setup() {
  //declar pin as an output
  pinMode(led,OUTPUT);
}

void loop() {
  // read the input on analog pin 12:
  int pressureValue = analogRead(pressureSensor);
  //turn the led on
  digitalWrite(led,HIGH);
  //wait using the value from the sensor
  delay(pressureValue);
  //turn the led off
  digitalWrite(led,LOW);
  //turn the led on
  delay(pressureValue);
}
In the sketch, we use the data from the sensor to set the delay time of the LED. When you press the sensor, this will lower the value, which will lessen the delay between blinks. This in turn will mean that the LED will start to blink faster. Remember that your sensor might have a slightly different value range, so you might need to modify the value in order to find a satisfactory blinking speed. The best way is to print out your sensor data to the serial monitor using serial communication in order to check your range of values. Then, you can add or subtract with any amount you prefer inside the delay, an example of this is shown as follows:
digitalWrite(led,HIGH);
  //wait using the value from the sensor
  delay(pressureValue+1000);
  //turn the led off
  digitalWrite(led,LOW);
  //turn the led on
  delay(pressureValue+1000);
In the next sketch, for example, we will make a mini game where the goal is to find the sweet spot. The code is set up so that you have to press the sensor in order to find the hidden spot defined in the code. Once you find it, the LED will start to shine for as long as you can hold the spot:
//declare variables to store pin number
int pressureSensor=10;
int led=7;

void setup() {
  //declare pin as an output
  pinMode(led,OUTPUT);
  Serial.begin(9600);
}

void loop() {
  //read the input on analog pin 12:
  int pressureValue = analogRead(pressureSensor);
  //as long as the value is in between 500 and 700 keep on looping
  while(pressureValue>500 && pressureValue<700){
    //turn the led on
    digitalWrite(led,HIGH);
    //check so that the value
    pressureValue = analogRead(pressureSensor);
  }
  //turn the led off
  digitalWrite(led,LOW);
}
The sweet spot is hidden in the range of 500 to 700. When the value is in the sweet spot range, we enter the while loop, which will keep on looping until the condition for the while loop is no longer met. This is why we need to add an additional reading of the sensor inside the loop, or the code will get stuck inside the while loop forever. As long as you can keep the value inside the range, the LED will light up. If you press the sensor too hard or too little, the while loop will be broken and the LED will turn off. If you find it too easy to find the sweet spot, try to decrease the range. This will make it much hard to find the spot.