
Chapter 43
More Development Tools
The Android SDK is more than a library of Java classes and API calls. It also includes a number of tools to assist in application development. Eclipse, of course, tends to dominate the discussion. However, that is not the only tool at your disposal, so let's take a quick tour of what else is available to you.
Hierarchy Viewer: How Deep Is Your Code?
Android comes with a Hierarchy Viewer tool, designed to help you visualize your layouts as they are seen in a running activity in a running emulator. So, for example, you can determine how much space a certain widget is taking up, or try to find where a widget that does not appear on the screen is hiding.
To use Hierarchy Viewer, you first need to fire up your emulator, install your application, launch your activity, and navigate to the spot you wish to examine. Note that you cannot use Hierarchy Viewer with a production Android device.
You can launch Hierarchy Viewer via the hierarchyviewer program, found in the tools/ directory in your Android SDK installation, or from inside of Eclipse. The main window is shown in Figure 43–1.
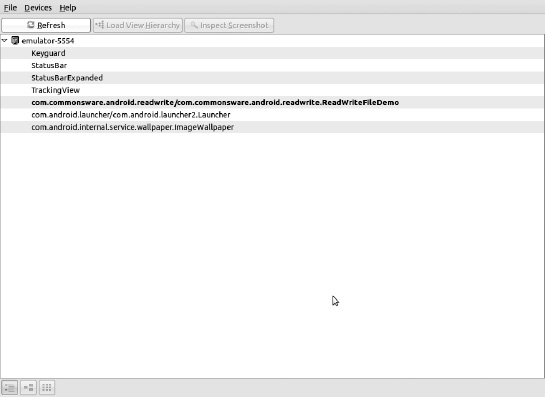
Figure 43–1. Hierarchy Viewer main window
The roots of the table show the emulator instances presently running on your development machine. The leaves represent applications running on that particular emulator. Your activity will be identified by application package and class (e.g., com.commonsware.android.files/...).
Things get interesting when you choose a window and click Load View Hierarchy. After a few seconds, the details spring into view, as shown in Figure 43–2.
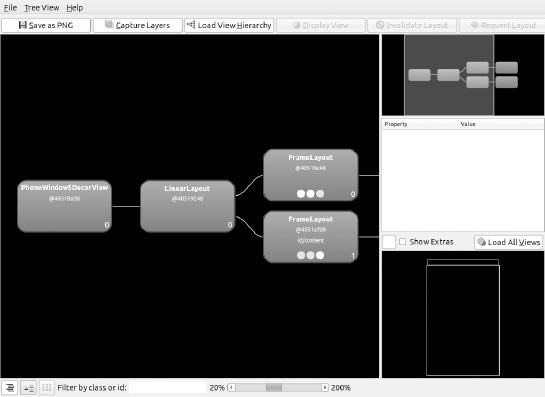
Figure 43–2. Hierarchy Viewer Layout View
The main area of the Layout View shows a tree of the various widgets and stuff that make up your activity, starting from the overall system window and driving down into the individual UI widgets that users will interact with. This includes both the widgets and containers defined by your application and others that are supplied by the system, including the title bar.
Clicking one of the views adds more information to this perspective, as shown in Figure 43–3.
Figure 43–3. Hierarchy Viewer View properties
Now, in the middle-right region of Hierarchy Viewer, you see properties of the selected widget or container, plus timing details for how long it took to render that container and its children.
Also, the widget is highlighted in red in the wireframe of the activity, shown beneath the properties (by default, views are shown as white outlines on a black background). This can help you to ensure that you have selected the right widget, if, say, you have several buttons and cannot readily tell from the tree which button is which.
You can also do the following in the main Hierarchy Viewer window:
- Save the tree diagram as a PNG file
- Save the UI as a Photoshop PSD file, with different layers for the different widgets and containers
- Force the UI to repaint in the emulator or reload the hierarchy, in case you have made changes to a database or to the app's contents and need a fresh diagram
Instead of clicking Load View Hierarchy in the main window, you can click Inspect Screenshot. This puts Hierarchy Viewer in a whole new perspective, called the Pixel Perfect View, as shown in Figure 43–4.
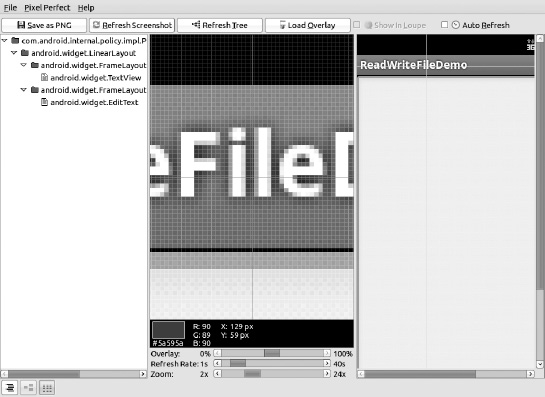
Figure 43–4. Hierarchy Viewer Pixel Perfect View
On the left, you see a tree representing the widgets and other Views in your activity. In the middle, you see a zoomed view of your activity, which is shown at normal size on the right.
The crosshairs overlaying the activity show the position being zoomed. Just click a new area to change what you are seeing. There is a slider to control the level of zoom. Clicking a pixel also indicates the position and color of that pixel.
If you check the Auto Refresh check box in the toolbar, Hierarchy Viewer will poll and reload the UI from your activity periodically, with the frequency controlled by another slider.
DDMS: Under Android's Hood
Another tool in the Android developer's arsenal is the Dalvik Debug Monitor Service (DDMS). This is like a Swiss army knife, allowing you to do everything from browse log files, update the GPS location provided by the emulator, simulate incoming calls and messages, and browse the on-emulator storage to push and pull files.
To launch DDMS, run the ddms program inside the tools/ directory in your Android SDK distribution or open the DDMS perspective in Eclipse. It will initially display just a tree of emulators and running programs on the left, as shown in Figure 43–5.
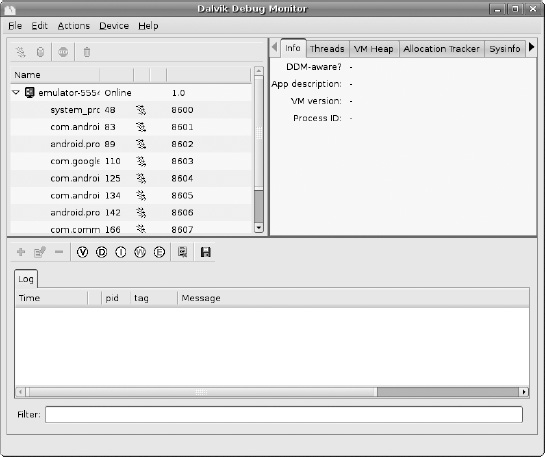
Figure 43–5. DDMS initial view
Clicking an emulator allows you to browse the event log on the bottom and manipulate the emulator via the tabs on the right, as shown in Figure 43–6.
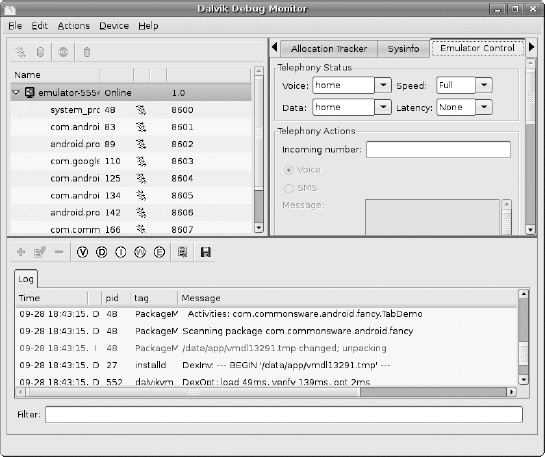
Figure 43–6. DDMS, with emulator selected
Logging
Rather than use adb logcat, DDMS lets you view your logging information in a scrollable table. Just highlight the emulator or device you want to monitor, and the bottom half of the screen shows the logs.
In addition, you can do the following:
- Filter the Log tab by any of the five logging levels, shown as the V through E toolbar buttons.
- Create a custom filter, so you can view only those entries tagged with your application's tag, by clicking the + toolbar button and completing the form (shown in Figure 43–7). The name you enter in the form will be used as the name of another logging output tab in the bottom portion of the DDMS main window.
- Save the log information to a text file for later perusal, or for searching.
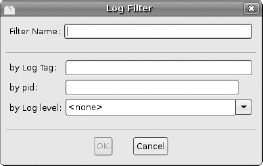
Figure 43–7. DDMS logging filter
File Push and Pull
While you can use adb pull and adb push to get files to and from an emulator or device, DDMS lets you do that visually. Just highlight the emulator or device you wish to work with, and then choose Device![]()
![]()
File Explorer from the main menu. That will bring up your typical directory browser, as shown in Figure 43–8.
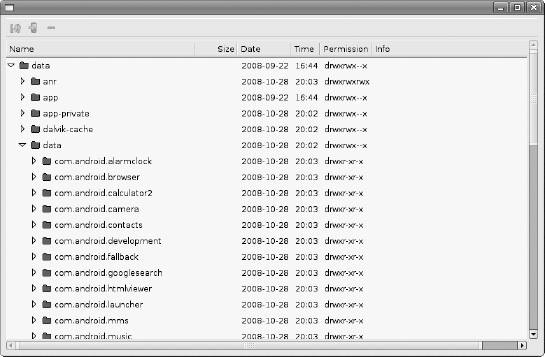
Figure 43–8. DDMS File Explorer
Just browse to the file you want and click either the pull (leftmost) or push (middle) toolbar button to transfer the file to or from your development machine. To delete a file, click the delete (rightmost) toolbar button.
Using File Explorer has a few caveats:
- You cannot create directories through this tool. You will need to either use
adb shellor create them from within your application. - While you can putter through most of the files on an emulator, you can access very little outside of
/sdcardon an actual device, due to Android security restrictions.
Screenshots
To take a screenshot of the Android emulator or device, switch to the DDMS perspective in Eclipse, and press the screen capture toolbar button (displayed as a camera). This will bring up a dialog box containing an image of the current screen, as shown in Figure 43–9.
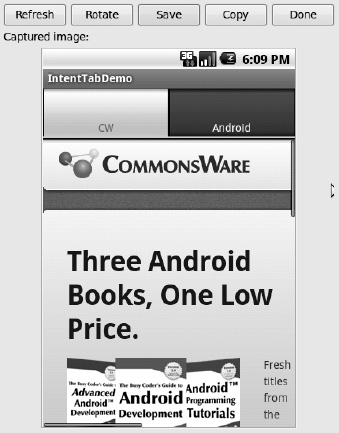
Figure 43–9. DDMS screen capture
From here, you can click Save to save the image as a PNG file somewhere on your development machine, click Refresh to update the image based on the current state of the emulator or device, or click Done to close the dialog box.
Location Updates
To use DDMS to supply location updates to your application, the first thing you must do is have your application use the gpsLocationProvider, as that is the one that DDMS is set to update. Then, click the Emulator Control tab and scroll down to the Location Controls section. Here, you will find a smaller tabbed pane with three options for specifying locations: Manual, GPX, and KML, as shown in Figure 43–10.
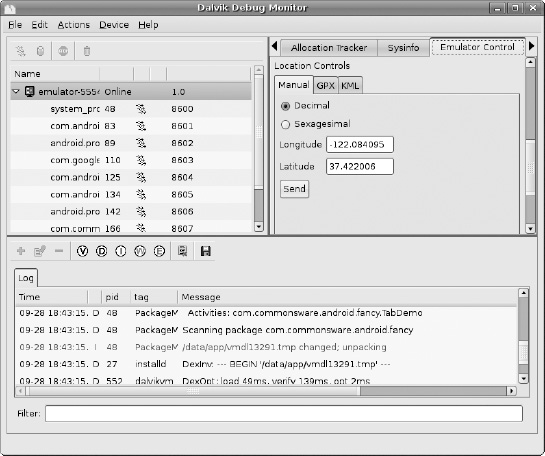
Figure 43–10. DDMS location controls
To use the Manual tab, provide a latitude and longitude and click the Send button to submit that location to the emulator. The emulator, in turn, will notify any location listeners of the new position.
Placing Calls and Messages
If you want to simulate incoming calls or SMS messages to the Android emulator, DDMS can handle that as well. On the Emulator Control tab, above the Location Controls group, is the Telephony Actions group, as shown in Figure 43–11.
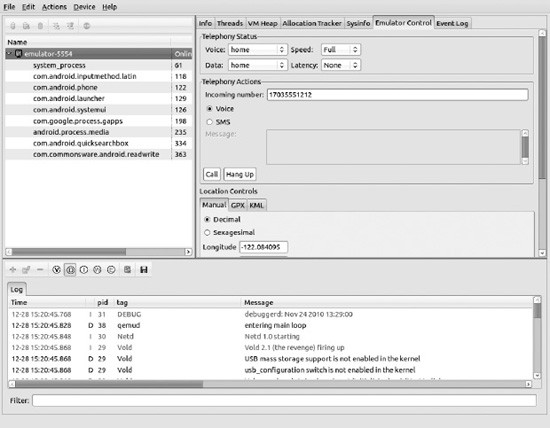
Figure 43–11. DDMS telephony controls
To simulate an incoming call, fill in a phone number, choose the Voice radio button, and click Call. At that point, the emulator will show the incoming call, allowing you to accept it or reject it, as shown in Figure 43–12.

Figure 43–12. Simulated incoming call
To simulate in an incoming text message, fill in a phone number, choose the SMS radio button, enter a message in the provided text area, and click Send. The text message will then appear as a notification, as shown in Figure 43–13.
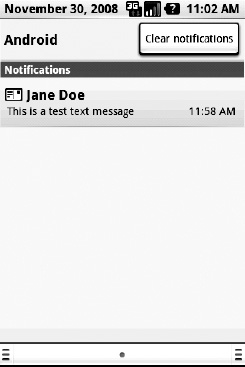
Figure 43–13. Simulated text message
And, of course, you can click on the notification to view the message in the full-fledged Messaging application, as shown in Figure 43–14.
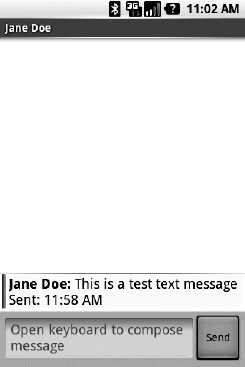
Figure 43–14. Simulated text message, in Messaging application
Memory Management
DDMS also helps you diagnose issues related to how your application uses memory, particularly heap space.
On the Sysinfo tab, you can see a pie chart of the overall memory allocation for the emulator, as shown in Figure 43–15.
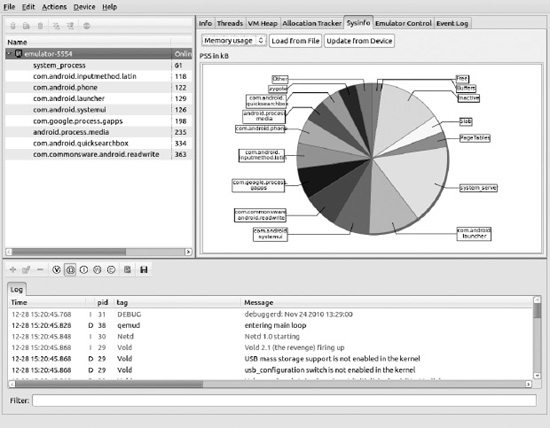
Figure 43–15. DDMS memory usage chart
On the Allocation Tracker tab, you can record every time your code (or code you call inside of Android) allocates memory. Simply highlight your application's process in the tree table, and then click the Start Tracking button. When you want to see what you have allocated since you clicked Start Tracking, click the Get Allocations button, which will fill in a table showing each allocation, how much memory was allocated, and where in the code the memory was allocated, as shown in Figure 43–16.
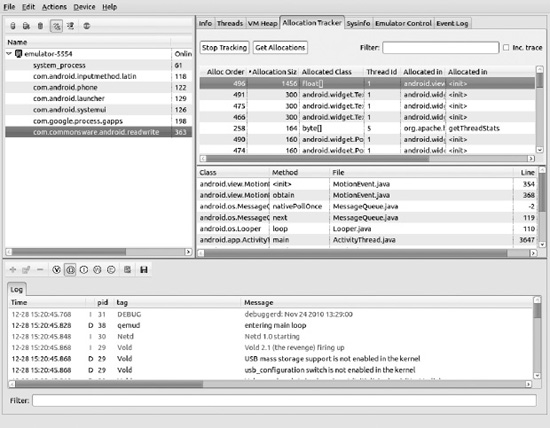
Figure 43–16. DDMS allocation tracker
And, you can even dump the entire heap for your application via the Dump HPROF option, which is the toolbar button that looks like a half-empty can with a red downward-pointing arrow to its right. The resulting HPROF file can be used with MAT, an add-in for Eclipse, to see which objects are still on the heap and who is causing them to stick around.
Before dumping the HPROF file, you may wish to force a garbage collection run on your process. You do so by clicking the toolbar button that looks like a classic metal garbage can.
adb: Like DDMS, with More Typing
The Android Debug Bridge, or adb utility, serves two roles:
- Behind the scenes, it serves as a bridge between your emulators/devices and the rest of the tools. For example, ADT, Hierarchy Viewer, and DDMS all communicate with your emulator via the
adbbridge. This bridge comes in the form of a daemon process, spawned the first time you try using any of those tools since your last reboot. - It offers command-line equivalents for many features of the other tools, notably DDMS.
Some of the things you can do with adb include the following:
- Start (
adb start-server) or stop (adb kill-server) the aforementioned daemon process - List all of the recognized Android devices and emulators presently visible (
adb devices) - Get access to a Linux shell inside your device or emulator (
adb shell) - Install or uninstall Android applications on your device or emulator (
adb install) - Copy files to (
adb push) or from (adb pull) the emulator, much like DDMS's File Explorer - Examine LogCat (
adb logcat)
Getting Graphical
The latest release of Android Developer Tools, released with Android 4.0 (ADT editions 14 and 15), introduces the new Android Asset Studio. This companion tool is designed to allow you to quickly and easily create graphic assets such as launcher icons, action bar and tab icons, and more, and takes care of many of the tedious aspects of creating a coherent set of images that looks good at each possible device size, resolution, and so forth.
There are at least two ways to access and use Android Asset Studio. For the hardcore developer, the code is open source and available on Google Code at http://code.google.com/p/android-ui-utils/. You can download the code, and build your solution, giving you your own instance of Android Asset Studio running in your environment. The downside to this approach is that Android Asset Studio is still flagged as a beta version, and you may well find yourself encountering issues that are still being corrected in development.
NOTE: As an example of one of the issues yet to be corrected, the author can consistently send his graphics card haywire by attempting to add text to a launcher icon under Firefox.
The alternative approach is to use the hosted version of Android Asset Studio from your favorite browser. The developers of Android Asset Studio recommend that you use Chrome as the browser, but you'll have some success using other browsers.
The hosted version of Android Asset Studio is currently at http://android-ui-utils.googlecode.com/hg/asset-studio/dist/index.html. Opening that page in your browser presents you with the currently available options for Android Asset Studio, shown in Figure 43–17.
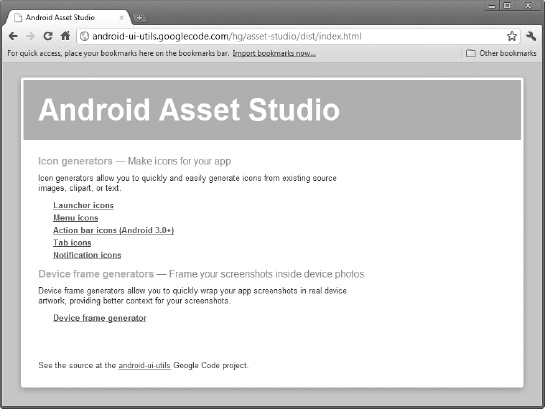
Figure 43–17. Android Asset Studio home page
For example, choosing to create a launcher icon takes you to a very simple palette, where you can see icons in Android-scaled sizes like ldpi, mdpi, hdpi, and xhdpi come to life as you add graphics and text to your new icon. Figure 43–18 demonstrates some quick results (and the fact that your author is not exactly the next Picasso).
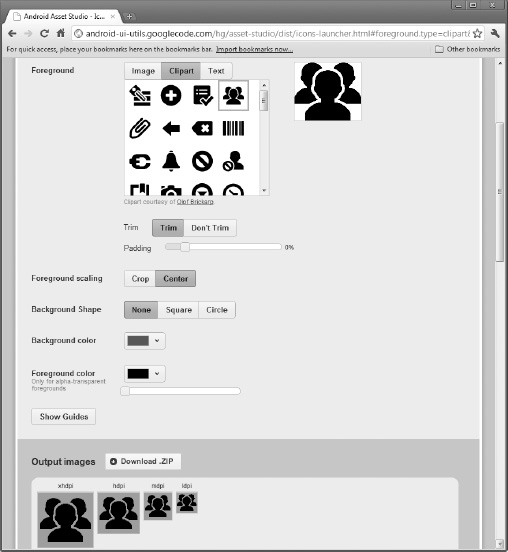
Figure 43–18. Creating a launcher icon set in Android Asset Studio
When you've finished creating your masterpieces, you can download the assets and place them in the relevant res/ folders of your project.