6
Resting-State fMRI: Large Data Analysis in Neuroimaging
M. Menagadevi1*, S. Mangai2, S. Sudha2 and D. Thiyagarajan3
1Department of Biomedical Engineering, Dr. NGP Institute of Technology, Coimbatore, TN, India
2Department of Biomedical Engineering,Velalar College of Engineering and Technology, Erode, TN, India
3Department of Artificial Intelligence and Machine Learning, School of Engineering, Malla Reddy University, Hyderabad, Telangana, India
Abstract
Recent advancements in brain imaging have considerably improved to detect pathophysiological variation in the brain network. Structural and functional characteristics of the brain is understood using different imaging techniques such as angiography, midline ultrasonography, skull radiography, Computed Tomography (CT), Positron Emission Tomography (PET), Magnetic Resonance Imaging (MRI) etc. All the imaging modalities have their unique advantages and limitations. However, among these modalities, resting-state functional Magnetic Resonance Imaging (rfMRI) is the best technique to find brain disorders by measuring the brain connectivity. A huge amount of data is required to explore this complex connectivity network. Recent innovations in imaging techniques, the rfMRI have a unique methodological approach to analyze the big data related to neurological disorders. To find the brain of complex cognitive operations, large set of rfMRI data is required. The development of fMRI in medical applications provides an opportunity to use this exciting modality in the field of pathophysiology, diagnostic uncertainty, identify mechanisms of therapeutic action. This chapter focus on different connectivity of resting-state functional neuroimaging, database descriptions, sharing, infrastructure, analysis methods and clinical applications and also focus on the advanced research challenges and opportunities toward neuroimaging. Big data forms a framework for current technology to have data integration, learning capability and multidiscipline research.
Keywords: Brain connectivity, rfMRI dataset, data analysis, clinical applications
6.1 Introduction
6.1.1 Principles of Functional Magnetic Resonance Imaging (fMRI)
fMRI is commonly used for brain imaging technique, it detects the activity of brain by measuring the changes occur during blood flow. This technique measures the brain cerebral blood flow and neuronal activity. fMRI detects the neuronal changes in the brain, and it gives unique information in both basic and clinical neurosciences. Difference between brain tissue resonances is measured based on these functionally dependent levels of blood oxygen, that is called as Blood Oxygen Level Dependent (BOLD) signal. This BOLD signal depends on Cerebral Blood Flow, Blood Volume and Metabolic rate of Oxygen. The brain uses 20% of the oxygen from the body. Energy to the brain is supplied by glucose molecules present in the oxygen. Oxygen consumption is increase due to increase in blood flow and glucose level. When the oxygen content increased during the consumption, the oxygen level in the blood can be identified using fMRI [12, 19].
Cubical region in the brain which measure the BOLD signal is called voxels. Activity of the neuron in the brain is measured by using BOLD signal. During brain activation, neurons in a voxel become active, so that the BOLD signal will vary over time. It helps the neuroscientist to characterize the brain function using BOLD signal changes. During the neural activity of the brain bold signal value peaks from 4 to 6 seconds after which it decreases back to baseline, again it shoots for 8–12 seconds after onset of brain signals. If there is no additional neural activity for 20 seconds it again returns to baseline this is called Hemodynamic Response Function (HRF).
6.1.2 Resting State fMRI (rsfMRI) for Neuroimaging
rsfMRI imaging is used to study the functional connectivity in different region of the brain. This method identifies approximately 0.01–0.1 Hz low-frequency variations of the BOLD signal, which represents the activity of the brain. Because of changes in deoxygenated hemoglobin and contract agent, the low magnetic field BOLD signal, is measured using rsfMRI. Blood oxygenation level increases due to increase in CBF and its rapidity increase the rsfMRI signal. The widely used methods for Resting State study are the whole brain investigation and the Region-of-Interest (ROI) analysis. By the BOLD signal detection, the ROI correlates the brain voxels and time sequence of an existing ROI [1, 14].
Brain connectivity is important to analyze the human brain network. Brain connectivity of is investigated through rsfMRI, and it is analyzed in terms of similarities in the temporal region. Several neuronal activities of the brain are measured through changes in a BOLD signal in resting state. Main advantage of rsfMRI includes better signal-to-noise ratio, simplicity of the procedure, and lesser period of acquisition time. rsfMRI examine numerous brain networks at one time. Complex cognitive processes in the brain are occurred during the transmission of information between different areas in the brain, which is examined by functional connectivity analyzes in rsfMRI [8, 11, 15].
6.1.3 The Measurement of Fully Connected and Construction of Default Mode Network (DMN)
To measure a fully connected region in the brain, the brain is separated into 90 regions. Average time series of all the region in the brain is measured by the time series average of all voxel. The correlation among two regions was measured. Correlation matrix of dimension 90*90 of Fully connected network was built and calculated the average correlation matrix. DMN was constructed using Seed region [2, 4]. Seed region is located in bilateral medial, inferior temporal gyrus and precuneus region of the brain. Threshold of DMN is set using Standard deviation of sub-network [11, 20].
6.2 Brain Connectivity
Functional and Anatomical connectivity is very important to analyze the neural activity of the brain [1, 3].
6.2.1 Anatomical Connectivity
Physical connections among neural units are called anatomical connectivity of the brain. Anatomical connections are relatively stable over few minutes or seconds; it undergoes significant morphological change on large timescale. These static images help the neurologist to identify the micro-structure underlying the brain [6].
6.2.2 Functional Connectivity
Electroencephalogram (EEG), Spectroscopy, rsfMRI used to analyze the brain functional connectivity. Functional connectivity information can be determined by measuring correlation of brain region in the temporal domain [23]. All the elements of the system are measured by direct or indirect structural links. Inherent activity of the functional network causes more than 60% of brain metabolic activity. This intrinsic activity is examined using low BOLD frequency signals [6, 8].
6.3 Better Image Availability
Brain region and its functional connections can be identified using functional rsfMRI, to explore this complex network large amounts of data are necessary. An era of big data analysis is obtained by combining neuroimaging techniques with new approach of rsfMRI. By using preprocessing techniques artifacts are reduced in the data, after preprocessing analytic technique is applied on rsfMRI dataset to align the data in the time series [4, 16].
Large data’s of rsfMRI are essential to form new cognitive operations in the human brain. More number of data sets are preferred to increase reliability and accuracy of the complex problems compare to small datasets. Due to the recent advancement in technology is an unrestricted sharing of data and able to get more number of neuroimaging data through open access datasets. Functional and Human Connectomes Project are two big data sharing projects for neuroimaging.1300 rfMRI images were collected from 33 international institutions and centers in 2009 using FCP. All images are available and user can use the image upon the registration. Information provided in the datasets are unnamed and limited to age and gender. In Human Connectome Project, studies are carried out under the age of 22–35 by healthy twins and non-twin siblings. All neuroimaging data are accessible through the registration in www.humanconnectome.org. The Laboratory of Neuro Imaging (LONI) has Alzheimer’s disease (AD) population around 1000 data. Consortium for Reliability and Reproducibility (CoRR) has 1629 healthy resting-state fMRI (rsfMRI) data. The Neuroimaging Informatics Tools and Resources Clearinghouse (NITRC) has 6845 imaging data. Beijing Enhanced dataset have 180 healthy images using different data modalities like MRI (Magnetic Resonance Imaging), rsFMRI, DW-MRI (Diffusion Weighted Magnetic Resonance Imaging). Nathan Kline Institute (NKI) dataset has 207 healthy rfMRI, MRI, DW-MRI images obtained from the ages of 4–85 years old. Mind-Brain-Body Dataset is available in Max Planck Institute Leipzig has 194 healthy subject includes structural and resting-state fMRI data acquisition. 580 healthy cross-sectional images were provided by Southwest University Longitudinal Imaging Multimodal (SLIM) Data Repository. 494 healthy adult multimodel images such as structural MRI, rsfMRI and behavioral images are available in Southwest University Adult Lifespan Dataset (SALD). Child Mind Institute healthy brain network has 1551 healthy children and adolescents MRI, rsfMRI, natural stimulus fMRI, DWMRI images. Dallas Lifespan Brain Study (DLBS) contain 350 healthy adults MRI, tfMRI, rsfMRI, DW-MRI images, aged 20–89 categorized in terms of perception, brain structure and function. rsfMRI images of Early and late Mild Cognitive impairment is available in Neuroimaging Initiative of Alzheimer’s disease.550 rsfMRI images of healthy, mild cognitive impairment and Alzheimer disease subjects are available in ADIN (Alzheimer Disease Neuroimaging Initiative) 2 and Open Access Series of Imaging Studies (OASIS). Autisum Brain Imaging Data Exchange (ADIDE 1 and 2) contain 1112,521 rsfMRI images of healthy and Autism disorder patients. Center for biomedical research contain 147 healthy and schizophrenia images [21]. Publically available rsfMRI dataset are listed in the Table 6.1.
Currently available datasets is given in the link https://sites.google.com/site/publicdatadatabase/. Due to the increase in the size of functional neuroimaging databases, the quality of the images acquired is improved by
- Higher spatially and temporally image resolution
- Imaging modalities
- Imaging sessions
- Specific target populations
6.3.1 Large Data Analysis in Neuroimaging
Recent advances in neuroimaging technology offer major progress in the analysis of human brain to develop the research in medicine, neuroscience and psychology. This advancement in technology provides a large volume of brain data with its functional and structural components. In the growth of advanced treatments in the neurological disorder and disease, large image databases are required. Billions of neurons and their connectivity are captured through the imaging techniques. So this large amount of data and their representation have the significant challenges. Major neurological disorders related to brain connectivity network includes Anxiety, Schizophrenia, Depression, Attention Deficit Hyperactive Disorder, Alzheimer’s disease. Understanding the functional complexity of the brain is a necessary to analyze the neurological disorders. rsfMRI technique provides a great potential for the analysis of functional brain networks. rsfMRI images enable us to understand the association between brain connectivity and psychological status.
Table 6.1 Publically available rsfMRI dataset.
| Name of the dataset | Number of subject | Populations |
|---|---|---|
| 1000 Functional Connectomes Project | 1288 | Healthy |
| Human Connectome Project | 1200 | Healthy |
| Laboratory of Neuro Imaging | 1000 | Alzheimer’s disease |
| Consortium for Reliability and Reproducibility (CoRR) | 1629 | Healthy |
| Beijing Enhanced | 180 | Healthy |
| Nathan Kline Institute | 207 | Healthy |
| Max Planck Institut Leipzig Mind- Brain-Body Dataset | 194 | Healthy |
| Southwest University Longitudinal Imaging Multimodal | 580 | Healthy |
| Southwest University Adult Lifespan Dataset | 494 | Cross sectional healthy subjects |
| Dallas Lifespan Brain Study | 350 | Healthy |
| Child Mind Institute Healthy Brain Network | 1551 | Healthy children and adolescence |
| Alzheimer Neuroimaging Initiative | 200 | Healthy and cognitive impairment |
| Alzheimer Neuroimaging Initiative-2 | 550 | Healthy, Cognitive impairment and Alzheimer’s disease |
| Open Access Series of Imaging Studies | 1098 | Healthy, Cognitive Impairment and Alzheimer disease |
| Attention Deficit Hyperactivity Disorder-200 | 973 | Healthy, Deficit Hyperactivity Disorder |
| Center for Biomedical Research Excellence | 147 | Healthy, schizophrenia |
Compare to traditional datasets, Large Data have unique features. By using these unique features, new statistical methods for data analysis are in development. Big Data are characterized by huge sample size and high dimensionality. With the massive data, hidden patterns associated with image can be analyzed. In large data era, the big sample size enables us to better understand heterogeneity.
6.3.2 Big Data rfMRI Challenges
Data collected for the various database exhibit numerous large data quantities, rfMRI size is not large as other data format. Due to the large size of other dataset, processing speed of the system will get low. When the size of the image is low, preprocessing and analyzing the data is easy and time-consuming. Methods used to analyze the data’s have a difficulty with its large size. Variety of data refers to information within single or multiple bit rfMRI datasets [24]. By combining neuroimaging and behavioral data with rsfMRI large variety of data can occur. Human Connectome Project includes variety of imaging modality like rfMRI, dMRI, MEG, tfMRI which help to analyze the image with multiple modalities. Large Veracity refers to noise, inadequate and wrong information data. Although large information is valuable in finding correlations that may be neglected by investigating lesser datasets, researchers find the correlation on bigger dataset. Preprocessing is an important and vital stage in Big Data research. Different preprocessing steps are dynamically turning out to be more acknowledged as standard in the examination of rfMRI data, computational time is increased by using different preprocessing techniques. So, software packages with advanced analytical methods should be developed for preprocessing the datas. The decrease of Information is another vital stage particularly when managing enormous datas with big veracity that is separating important and significant features or extraction strategies from the entire feature which contain noisy information. Software tools along with the web link for neuroimaging is given below [24]:
- Analysis of Functional NeuroImages (AFNI) - https://afni.nimh.nih.gov/afni/
- Advanced Normalization Tools (ANTs) - http://stnava.github.io/ANTs/
- Free Surfer - https://surfer.nmr.mgh.harvard.edu
- FMRIB Software Library (FSL) - https://fsl.fmrib.ox.ac.uk/fsl/fslwiki
- Statistical Parametric Mapping (SPM) - www.fil.ion.ucl.ac.uk/spm/
6.3.3 Large rfMRI Data Software Packages
A figure of necessities and features are essential to be accessible by the software which is designed to analyze big scale rfMRI data such as configurable, vigorous, dependable, and extendable and provenance following. Table 6.2 shows the software package software for fMRI preprocessing [24].
Table 6.2 Software packages of fMRI.
| S. no. | Software | Web link | Programming Language |
|---|---|---|---|
| 1. | Bet A-Series Correlation | www.nitrc.org/projects/basco/ | MATLAB |
| 2. | Scalable fMRI Data Analysis | https://igithub.com/rboubela/biananes | C |
| 3. | Brain Connectivity Toolbox | www.brain-connectivity-oolbox.net/ | MATLAB |
| 4. | Brain Net Viewer | www.nitrc.org/projects/bnv/ | MATLAB |
| 5. | Brain VISA | http://brainvisa.info/web/index.html | Python/C++ |
| 6. | Software for Fast fMRI | https://github.com/wanderine/BROCCOLI/ | Open CL/C++ |
| 7. | Connectome Computation System | https://github.com/zuoxinian/CCS | MATLAB/ Python |
| 8. | Configurable Pipeline for Analysis of Connectome | https://fcp-indi.github.io | python |
| 9. | Functional Connectivity Toolbox | www.nitrc.org/projects/conn/ | MATLAB |
| 10. | Correlation psychophysiological interaction | www.nitrc.org/projects/cppi_toolbox/ | MATLAB |
| 11. | A toolbox for data processing and analysis for brain imaging | http://rfmri.org/dpabi | MATLAB |
| 12. | Data processing Assistant for rsfMRI | http://rfmri.org/DPARSF | MATLAB |
| 13. | Graph Analysis tool | www.nitrc.org/projects/gat/ | MATLAB |
| 14. | Group ICA of fMRI toolbox | http://mialab.mrn.org/software/gift/index.html | MATLAB |
| 15. | Generalized Psychophysiological Interactions | www.nitrc.org/projects/gppi | MATLAB |
| 16. | Comprehensive graph analyses of functional brain connectivity | www.nitrc.org/projects/graphvar | MATLAB |
| 17. | Graphical Analysis of Network | www.nitrc.org/projects/gretna/ | MATLAB |
| 18. | Graph Theory MATLAB Toolbox | www.nitrc.org/projects/metalab_gtg/ | MATLAB |
| 19. | Network-Based Statistic | www.nitrc.org/projects/nbs/ | MATLAB |
| 20. | Neuroimaging Analysis Kit | www.nitrc.org/projects/niak/ | MATLAB/ Octave |
| 21. | Machine learning for Neuro-Imaging | https://nilearn.github.io | Python |
| 22. | Neuroimaging: Pipelines and Interface | http://nipy.org/nipype | Python |
| 23. | Pattern Recognition for Neuroimaging Toolbox | www.mlnl.cs.ucl.ac.uk/pronto/index.html | MATLAB/C++ |
| 24. | Pipeline System for Octave and MATLAB | http://psom.simexp-lab.org | MATLAB/ Octave |
| 25. | Multivariate Analysis of pattern in Python | www.pymvpa.org | Python |
| 26. | Resting-State fMRI Data Analysis Toolkit | http://restfmri.net | MATLAB |
| 27. | Statistical Non Parametric Mapping | http://warwick.ac.uk/snpm | MATLAB |
| 28. | The Decoding Toolbox MATLAB | https://sites.google.com/site/tdtdecodingtoolbox/ | MATLAB |
6.4 Informatics Infrastructure and Analytical Analysis
Big data Informatics is an important element for large data distribution and analytical analysis. It is likely to improve collection, analysis integration and interpretation of data, and have a secure sharing/collaboration of the data. The collection and distribution of Human Connectome Project and Connectome DB database, allows data accessing and automated validation for data Quality Control and allows numerous approaches for accessing the data. Secure access of neuroimaging data is available on Extensible Neuroimaging Archive Toolkit software platform which is utilized by some neuroimaging dataset. Various neuro informatics infrastructure was developed for Processing and analysis for Brain Imaging.
Functional neuroimaging analysis have been developed for data processing, classification and pattern discovery. For classifying the abnormal patterns in the brain like schizophrenia, depression, Alzheimer disease, social anxiety, Mild cognitive impairment, Parkinson disease and other neurological diseases various methods are used. Multiple data models were useful to determine the functional pattern of the brain.
It is challenging to establish neuroimaging across different subjects and imaging modalities. The multi-modal architecture provides an accurate areal map of the human brain. Connectivity domain framework provides a space to exemplify rsfMRI data for the data-driven analysis. Large-scale brain map is formed by integrating meta-analysis to functional neuroimaging.
6.5 Need of Resting-State MRI
6.5.1 Cerebral Energetics
Different states of brain are measured by understanding the brain energy metabolism. The human brain at resting state consumes 20% of the energy and 2% of body mass, maximum of which support of neuronal signaling. Increased in neurological metabolism for task related is <5% compare to large energy consumption during resting state. Less than 1% occur in task related changes.
6.5.2 Signal to Noise Ratio (SNR)
SNR of the resting state studies are better than the task related approaches. rsfMRI emphases on instant activity and it is used as a signal rather noise. Task based activation have a reduced SNR because the signal is lesser relative to the noise. SNR task-based activation is 20% whereas in resting state it is about three times the SNR. Imaging abnormalities in the patients are identified correctly with improved SNR.
6.5.3 Multi-Purpose Data Sets
Multiple cortical systems can be studied using rsMRI data. In task-activation analyses, keen data acquisitions for each function is required. Acquisition of motor and language task is required to identify motor and language system. In rsfMRI, the single data set can be used to inspect both systems, so the data volume get reduced.
6.5.4 Expanded Patient Populations
rsfMRI allows broader patient population for clinical studies. Patients with cognitive dysfunction or physical impairment are unable to perform tasks exactly in the fMRI scanner, whereas in rsfMRI analysis afford an exact result. rsfMRI requires only marginal strains on the patient. Instant action carries only during the patients are asleep and sedated.
6.5.5 Reliability
Reproducibility and intersubject variability are the significant matters to be consider rsfMRI. Resting State Network can be identified consistently through imaging sessions and in dissimilar cases, there may be some changeability among the subjects. Intraclass correlation of >0.60 are obtained using rsfMRI.
6.6 Technical Development
Technical development in medical field plays a major role in the neuroimaging. Signal-to-noise is highly potential over task based studies, for task based analysis number of trails in SNR gets increased. All the neural fluctuation in the cortical system and non- neuronal sources are not BOLD signal, proper identification of the bold signal is a significant task. Noise impact is relatively lesser to neuronal fluctuations. Non-neuronal fluctuations have less SNR compare to neuronal fluctuations. Scan time and clinical applicability is improved by improving SNR. rsfMRI data can be used for analyzing the brain network in resting state and to increase the number of epochs of task related variance.
6.7 rsfMRI Clinical Applications
rsfMRI has remarkable perceptions on Resting State Network in the healthy and unhealthy states [10]. Here, we have described some potential diseases examines using RS-FMRI [12].
6.7.1 Mild Cognitive Impairment (MCI) and Alzheimer’s Disease (AD)
AD is neurological disorder that the brain network is changed during the transition from healthy condition to MCI and AD. AD disease shows the correlation and anticorrelations reduction within the DMN and also clustering coefficient with reduced local connectivity. Symptoms of AD are reduced concentration and thinking, lack in decision-making, memory loss, personality change, depression, sleeping disorder, wandering etc. Symptoms of MCI include Amnestic cognitive impairment which affects the memory of the person and nonamnestic cognitive impairment affects the thinking of the person rather than memory.
rsfMRI imaging is used to find the intrinsic brain connectivity which is considered a promising biomarker for AD and MCI diagnosis. Functional connectivity changes within the DMN have been observed in healthy, MCI and a prodromal stage of AD population. In comparison with health controls, there is a decreased connectivity at baseline in posterior default mode areas and increased in frontal region for AD patients. This result shows that within DMN hyper-connectivity leads to hypo-connectivity of a brain region, and it is a sign of early phase of brain dysfunction. Neuropathology of brain with AD is outlined using rsfMRI which affects temporal lobe, posterolateral cortical regions and the frontal cortex [5]. The significant feature of rsfMRI in AD is the acceptance of data gaining in patients with dementia and to measure functional connectivity without the concert of a task. In Figure 6.1 shows resting-state functional brain image where Green color represent the voxel with DMN. Blue color represents the voxels with decreased Functional Connectivity (FC) in MCI and AD [22]. Figure 6.2 represent rsfMRI BOLD signal, which shows the variation of brain signal during AD and MCI condition [25].

Figure 6.1 Resting state functional brain image of MCI and AD.
6.7.2 Fronto-Temporal Dementia (FTD)
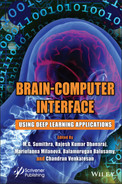
FTD is a neurological disorder with the symptoms of behavioral and personal impairment. The common symptoms of FTD are behavioral changes, lack of judgment, impulsive, apathy, decreased confident level, loss of self-awareness, reduced energy level, decreased knowledge level, depending on others, agitation. FTD functional networks implicated as DMN, the networks spread mainly through the left hemisphere. In bvFTD (behavioral variant Frontotemporal dementia), reduced connectivity in all regions such as anterior cingulate, frontal lobe, amygdala, thalamus, insula, and ventral striatum. Figure 6.3 shows the Bold signal variation of rsfMRI image. Decreased connectivity in the network may affect in increased connectivity within the DMN. Figure 6.2 represents the frontal and temporal pattern of FTD [7].
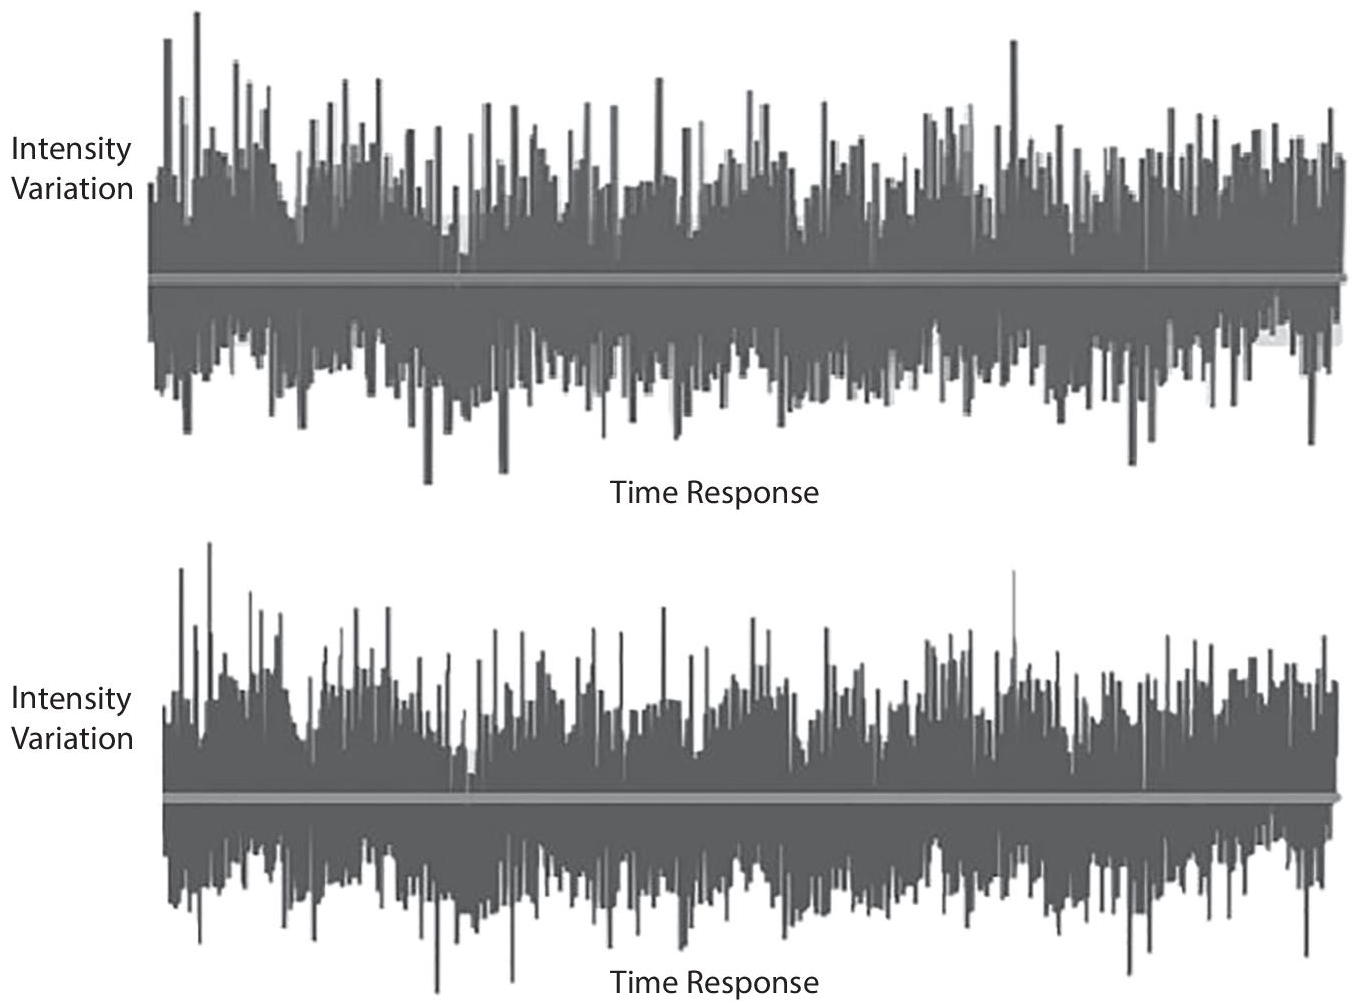
Figure 6.2 BOLD signal of Mild Cognitive Impairment and Alzheimer’s Disease.
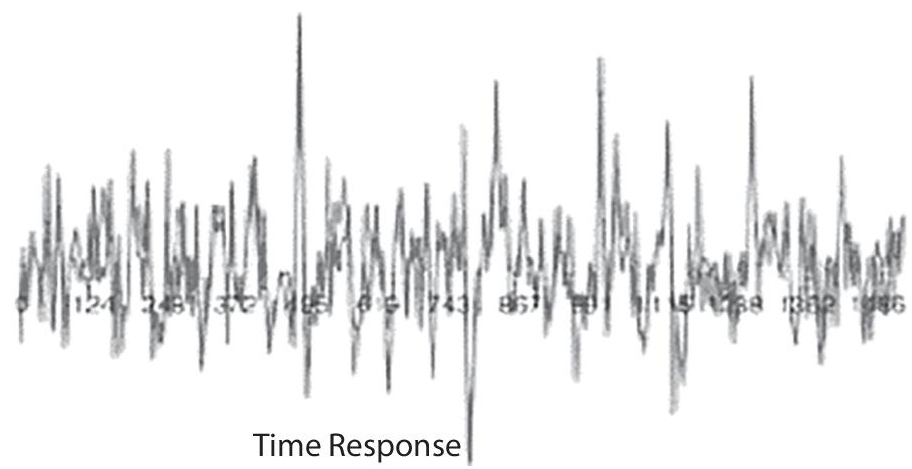
Figure 6.3 BOLD signal of fronto-temporal dementia.
6.7.3 Multiple Sclerosis (MS)
MS is a most common causes of neurological disability, which affects 2.5 million individuals. Symptoms of MS are weakness in one side of the body, loss of vision, dizziness, fatigue, tingling, urinary problem. Connectivity analysis is based on calculation of the temporal correlations among various regions of the brain. The connectivity analysis at resting state, which organizes the multiple neuroanatomic networks. In MS, DMN dysfunction is more noticeable and it is correlated with change in structural connectivity. Anatomical connectivity analysis gives the changes in white matter of MS patient [9].
MS disease leads to the presence of focal lesions and atrophy can complicate functional neuroimaging. Figure 6.4 and Figure 6.5 represents the rsfMRI of normal and multiple sclerosis and Global decreases in brain activity in MS detected. Using the same scale, images from two slice locations in a normal (top row) and a patient with MS (bottom row) displayed. Cerebral glucose metabolism is reduced in the MS patient compared to healthy control. Figure 6.6 shows the Bold signal variation of the rsfMRI image.

Figure 6.4 FTD subtypes imaging. (a) Behavioral variant of FTD (bvFTD). (b) Semantic dementia-temporal lobe atrophy. (c) Coronal T1-weighted MR image – non-fluent aphasia and left frontal and superior atrophy. (d) Axial T1-weighted MR image with right temporal atrophy.
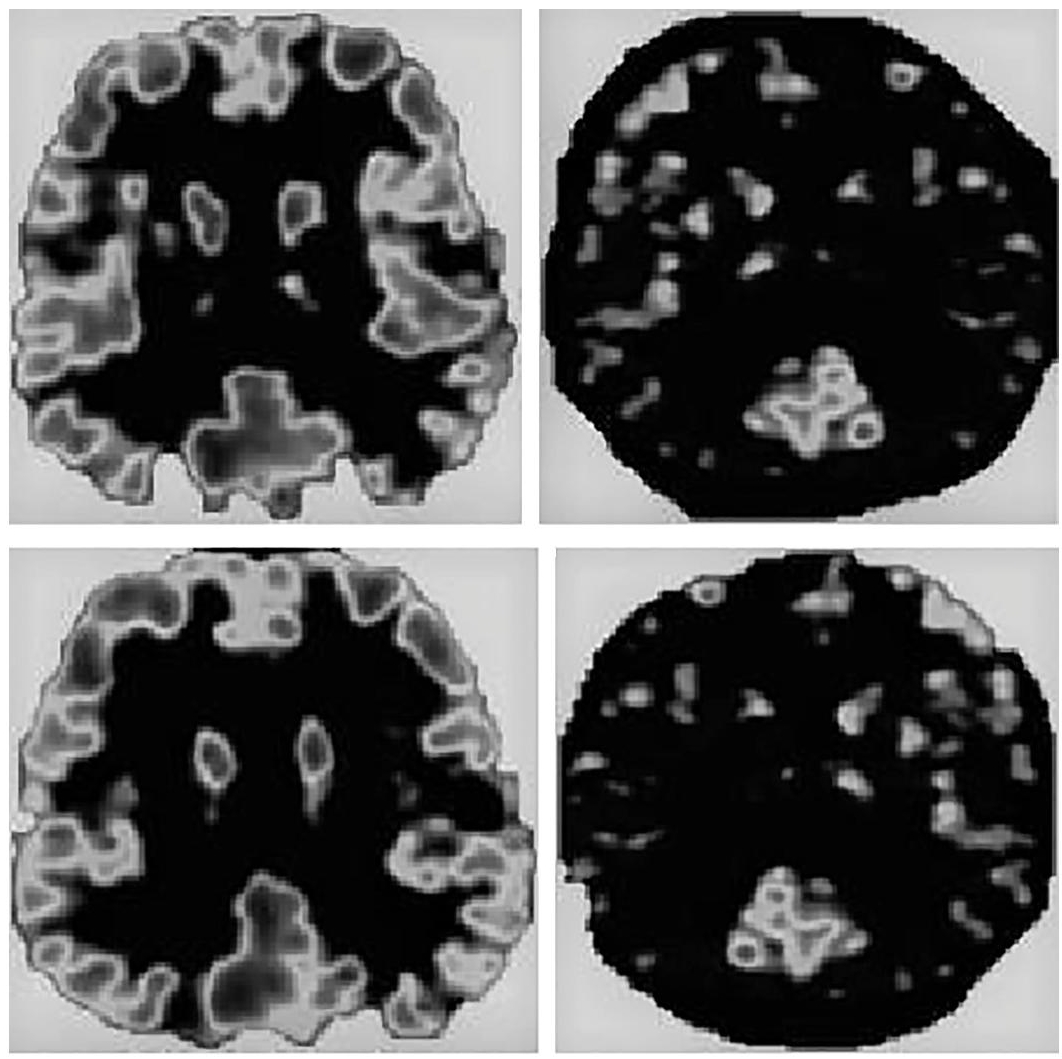
Figure 6.5 rsfMRI of normal and abnormal multiple sclerosis.

Figure 6.6 rsfMRI Bold signal of multiple sclerosis.
6.7.4 Amyotrophic Lateral Sclerosis (ALS) and Depression
ALS is characterized by downstream muscle weakness, loss of motor neurons in spinal tract and anterior horns, speech problem, uncontrollable crying, laughing, behavioral changes. Dysfunction in ALS is described using rsfMRI. BOLD signal analysis in the rsFMRI benefits from high acquisition times and high-resolution structural protocols. In ALS, there is a decreased connectivity in frontal cortex and decreased connectivity in precuneus [10].

Figure 6.7 Resting-state FMRI of depression disorder.
Depression is categorized by mood depression in the patient, lost interest in doing activities, feeling hopeless, depression, losing physical appearance, change in sleep pattern, energy loss, and worthlessness feel. Figure 6.7 shows the resting-state FMRI of depression disorder and Figure 6.8 shows the Bold signal of depression disorder [27]. Functional neuroimaging examines the different cortex region such as Anterior Cingulate, Medial Prefron AFNI tal, Posterior Cingulate, thalamus, and precuneus.
6.7.5 Bipolar
Bipolar disorder is characterized by of mania, decreased sleep, lack of decision-making depression, eating disorder, anxiety disorder and heart problem fMRI uses task-related and resting-state method to analyze the bipolar disorder. Rather than giving information about whole-brain functioning, it gives information about the differences in neuropsychological function and specific task-based brain region. Bipolar disorder activity was spontaneously measured using rsfMRI. Figure 6.9 represents rsfMRI bipolar disorder image.
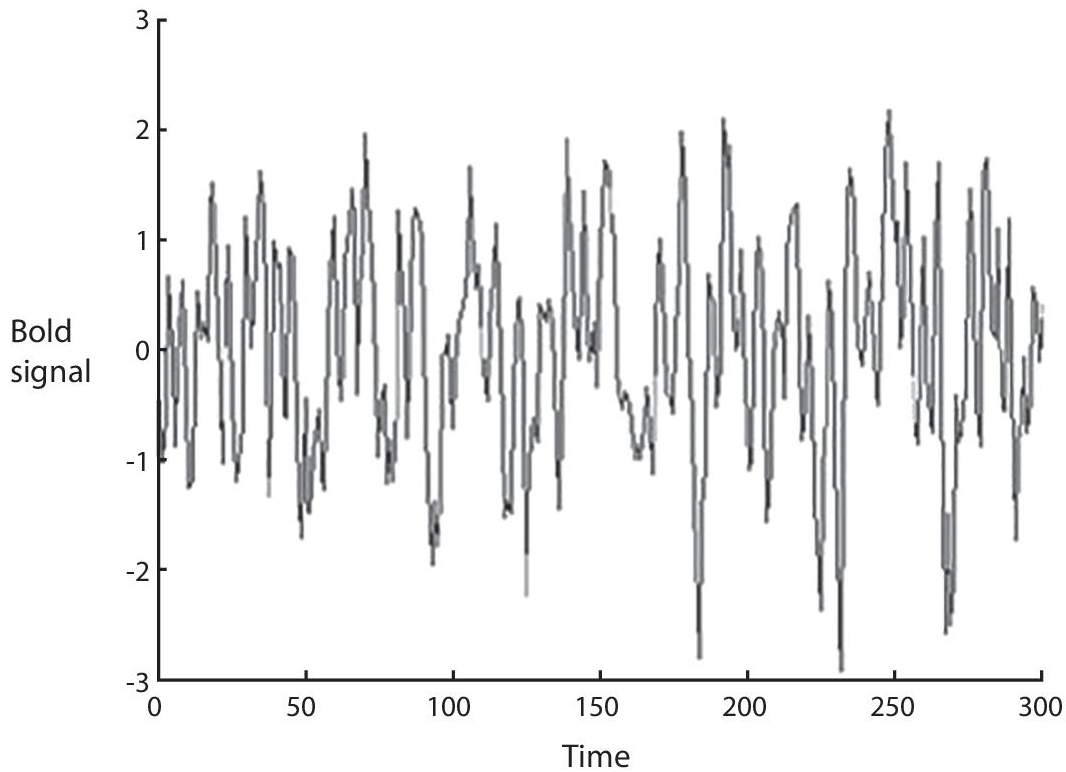
Figure 6.8 rsfMRI bold signal of depression disorder.
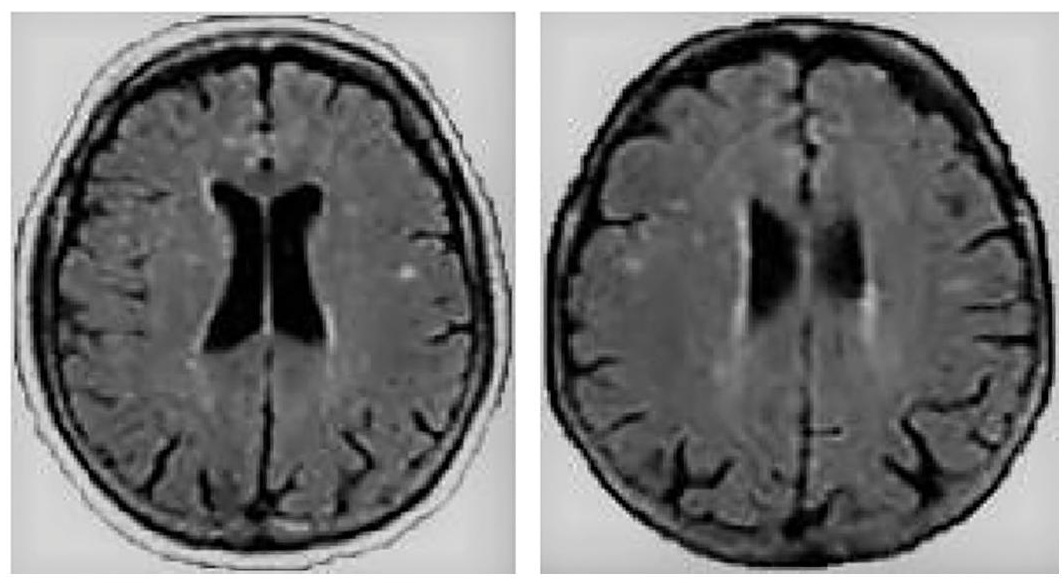
Figure 6.9 rsfMRI bipolar disorder image.
6.7.6 Schizophrenia
Schizophrenia was a potential disconnection disease characterized by false believe, hallucinations, thinking disorder, sleep disorder, poor hygiene. The underlying symptom of Schizophrenia was functional disconnectivity between brain regions. Schizophrenia have changes in DMN network in frontal and parietal regions shown in the bold signal, Figure 6.10. For schizophrenic patients, the rsfMRI shoes the decreased functional connectivity between medial frontal cortex and precuneus region of the brain. It is identified that there is a spatial difference in the DMN in schizophrenia patients and the DMN region shows higher frequency variations in early phase of schizophrenia. Figure 6.11 represents the pathological alterations in schizophrenia of rsfMRI Images. Red indicates elevated regional activity and blue represents suppressed regional activity [13, 14].

Figure 6.10 rsfMRI Bold signal of schizophrenia.
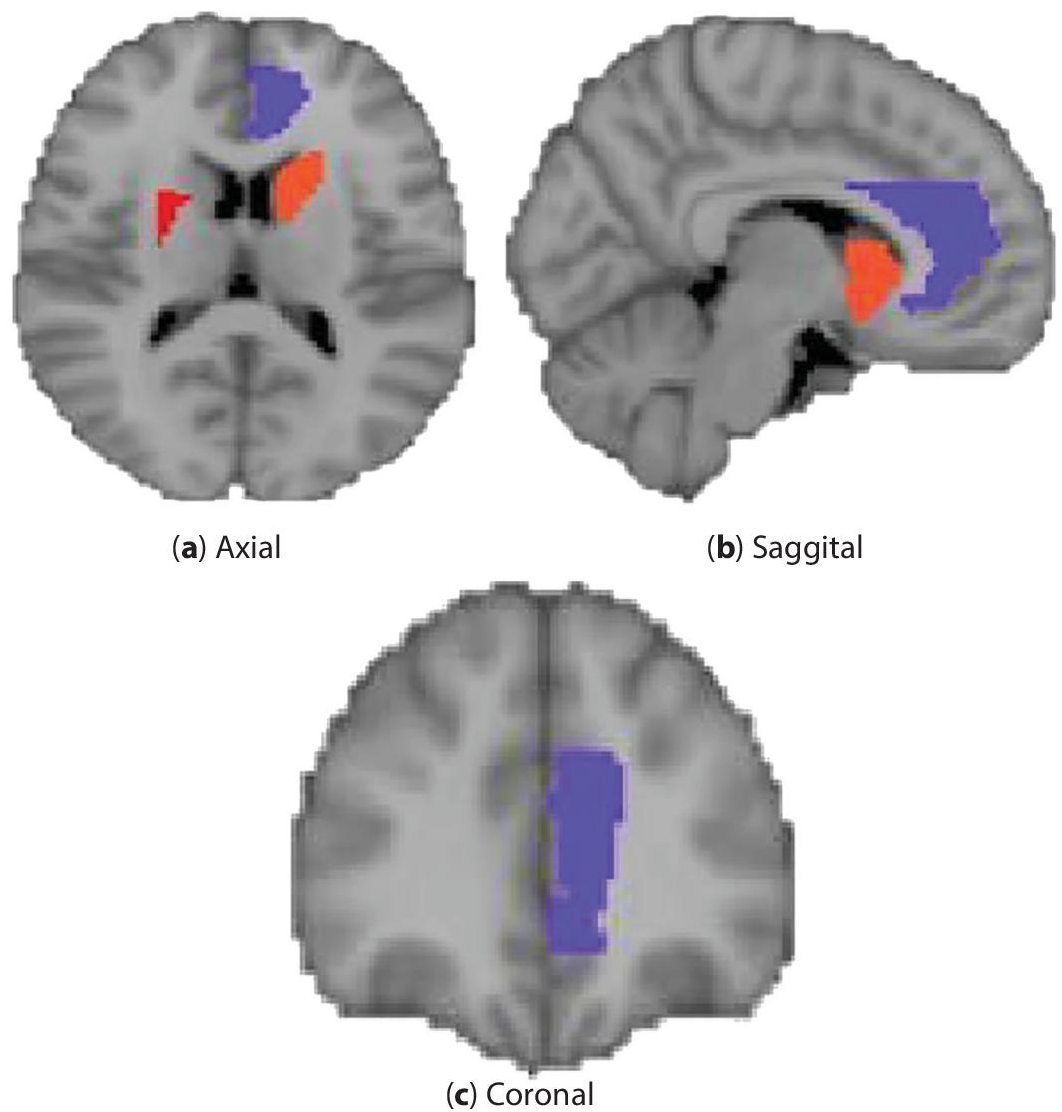
Figure 6.11 rsfMRI of schizophrenia.
6.7.7 Attention Deficit Hyperactivity Disorder (ADHD)
ADHD is a neurological disorder and it is characterized by loss of attention, hyperactivity, excessive talking, loss of physical movements and behavioral changes. ADHD patients have the rsfMRI image with low frequency fluctuation and regional homogeneity. ADHD patients have abnormal brain activity of in cerebellar areas. Figure 6.12 shows the rsfMRI image of ADHD. Red color in the image shows the low frequency changes in the brain [8, 17].
6.7.8 Multiple System Atrophy (MSA)
MSA is a neurological disorder characterized by dysfunction, slow movement, cerebellar features and postural variability. Figure 6.13 shows the area of brain affected by MSA.MSA is a rare disease, and resting-state functional connectivity used to analyze the patients with MSA. Overlap of frontal lobe, superior and middle gyri and prefrontal cortex is reported in resting-state connectivity in MSA. There is an increased regional homogeneity in right frontal area and decreased regional homogeneity in left areas. Changes in parietal lobule and posterior cingulate also examined in rsfMRI. Decreased fronto parietal and parieto-cingulate connectivity was associated with MSA [16]. Bold signal variation of Multiple System Atrophy is shown in Figure 6.14.
6.7.9 Epilepsy/Seizures
It is a neurological illness, activity of the brain become aberrant which results in seizer, weakness of nerves and loss of consciousness. Symptoms of epilepsy are anxiety, confusion, jerking of arms and legs and fear. Patient with epilepsy have a seizure symptom frequently. Abnormal activity observed in one region of the brain is called focal seizure. Focal seizures of two types. In one type of seizure patient not loss their consciousness they have symptoms like loss of smell, emotions, feel, sound and also have involuntary movement in the body. On second type of seizure, patient loss their consciousness. Epilepsy and seizures occur due to heredity, head injury, change in brain function, brain infection, brain cell death. Figure 6.15 represents the Epilepsy and Seizure rsfMRI image. BOLD signal analysis [26] of the rsfMRI image is shown in the Figure 6.16.
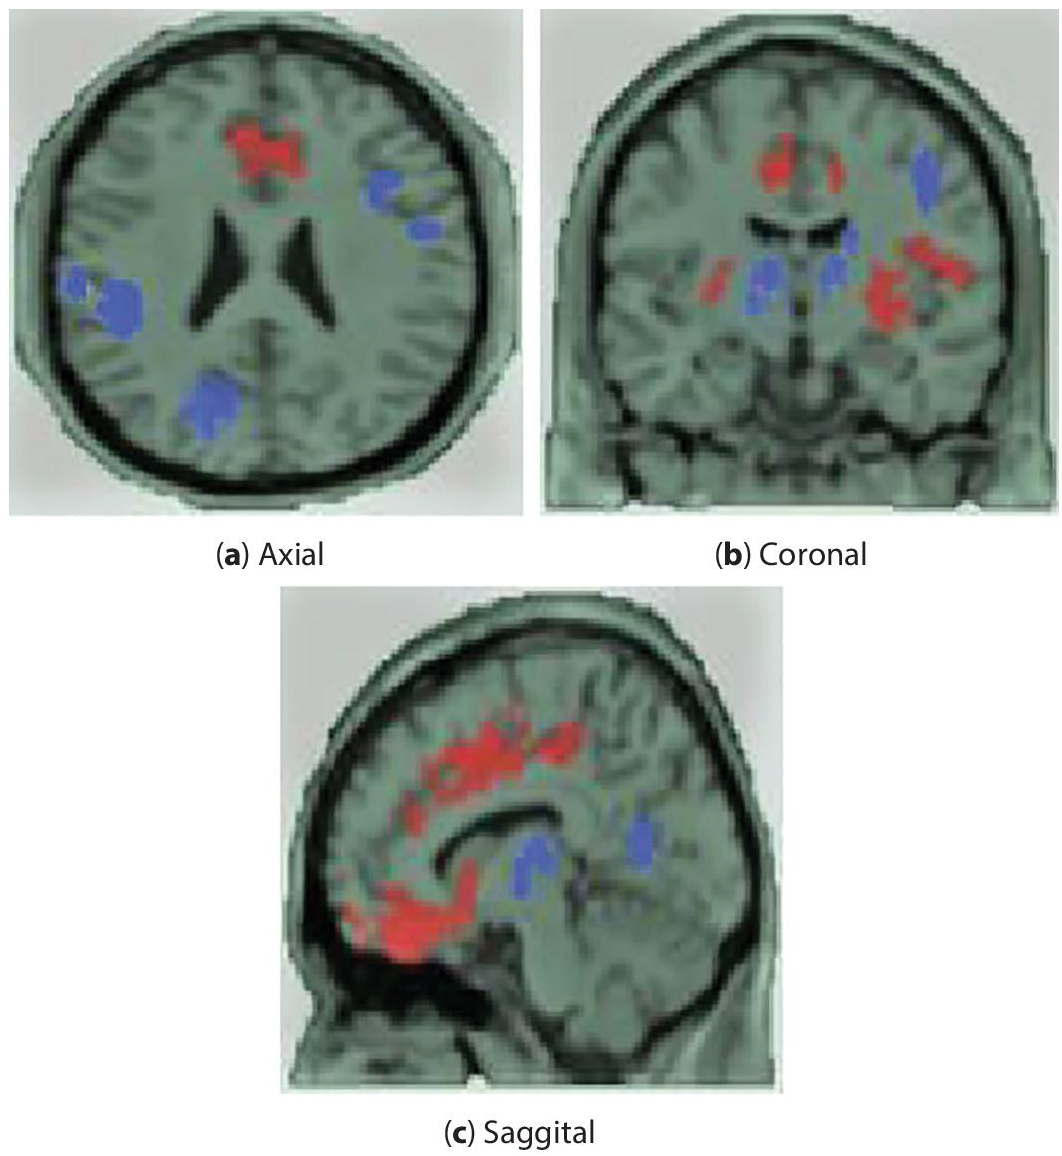
Figure 6.12 rsfMRI image of ADHD.

Figure 6.13 rsfMRI image of multiple system atrophy.

Figure 6.14 Bold signal of multiple system atrophy.

Figure 6.15 rsfMRI image of epilepsy and seizures.
6.7.10 Pediatric Applications
RS-fMRI used to solve multiple pediatric diseases. rsfMRI identify immature forms of Resting state network in infants to determine incorporating regions identified in older children and adult’s longitudinal analysis is performed during neonatal period for the infants. Resting State Network difference were recognized between infants and those born prematurely using rsfMRI. It shows the reduced long-range and improved short-range correlations in the network. rsfMRI has been used to explore changes in Resting State Network of pediatric disease [1].
6.8 Resting-State Functional Imaging of Neonatal Brain Image
Infancy brain development is the most important and critical stage in their life. Infants need sustained development in the functional connectivity of the brain at rest, it is absorbed using rsfMRI shown in the Figure 6.17. Functional connectivity used to analyze cognitive process of different brain region. rsFMRI studies help us find the immature brain development and different brain injuries of the infants.

Figure 6.16 rsfMRI image and its corresponding BOLD signal of seizure and epilepsy.
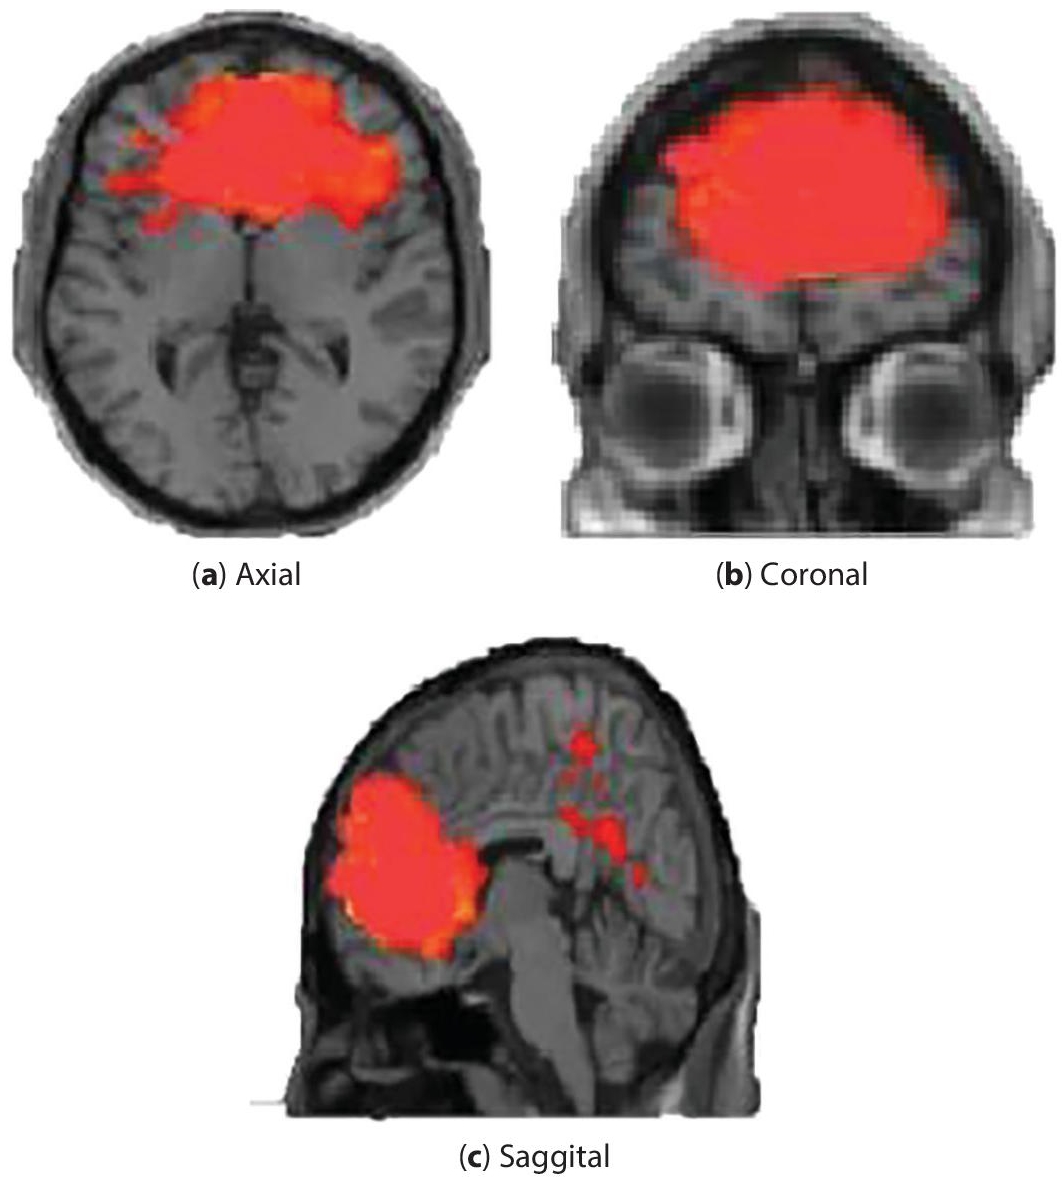
Figure 6.17 rsFMRI of infant brain.
6.9 Different Groups in Brain Disease
rsfMRI may be used for various clinical applications, mainly in neurological or psychiatric disorders. Functional abnormalities of different disease states are studied using rsfMRI. Table 6.3 shows the different groups of rsfMRI patterns of brain diseases or conditions [16, 18].
6.10 Learning Algorithms for Analyzing rsfMRI
Machine learning and deep learning techniques play a vital role in analyzing the rsfMRI data. Various supervised and unsupervised learning algorithms analyze the rsfMRI image and identify the different neurological disorders. Unsupervised learning algorithm discover spatial, reproducible pattern and latent factors of resting-state functional MRI images. Supervised learning is used to classify and analyze different brain disorders, hereditary disorders, psychiatric disorders, brain development etc., Image should be preprocessed before applying the algorithm. Figure 6.18 shows some preprocessing techniques used to process the rsfMRI [28].
Table 6.3 Different groups of resting-state MRI patterns of brain diseases or conditions.
| Disease | Finding in rsfMRI |
|---|---|
| Alzheimer | Reduced correlations, anticorrelations in the DMN and reduced local connectivity. |
| Mild cognitive impairment | Decreased correlations, anticorrelations within the DMN |
| Fronto-temporal dementia | Salience network- Decreased correlations |
| Multiple sclerosis | Somatomotor network- Decreased correlations |
| Amyotrophic Lateral Sclerosis | Decreased connectivity in DMN and somatomotor network |
| Depression | Reduced corticolimbic connectivity, increased connectivity within the DMN, Reduced connectivity among DMN and caudate |
| Bipolar | Reduced corticolimbic connectivity |
| Post-Traumatic Stress Disorder | Reduced connectivity in the DMN |
| Schizophrenia | Reduced correlations within the DMN. Improved connectivity within the DMN |
| ADHD | Reduced connectivity and anticorrelations within the DMN |
| Autism | Reduced connectivity in the DMN |
| Epilepsy | Reduced connectivity in different networks and Decreased connectivity within the DMN |
| Blindness | Decreased connectivity in visual cortices, sensory and multimodal regions |
| Chronic pain | Reduced/improved connectivity in the salience network, Reduced connectivity in attention networks |
| Coma/vegetative state | Reduced DMN connectivity in impaired consciousness |
| Generalized anxiety disorder | Improved connectivity between different control network Reduced connectivity in salience network |

Figure 6.18 Preprocessing methods for rsfMRI analysis.
Following supervised learning methods are used to analyze the image after preprocessing
- Linear models
- Ridge regression
- LASSO regression
- Elastic-Net regression
- Logistic regression
- Support vector machine (SVM)
- Linear SVM
- Kernelized SVM
- Decision tree
- Random forest
- Gradient tree
- Deep learning
- Fully connected network
- Convolutional network
Unsupervised algorithms used for analyze the image is
- Clustering
- K-means
- Spectral
- Hierarchical
- Gaussian model
- Latent models
- Decomposition methods
- Markov model
- Non-linear model
- Local linear
- Autoencoders
6.11 Conclusion and Future Directions
rsfMRI has delivered novel understandings on the brain network. Synchronous spontaneous BOLD fluctuations of various Resting State Network detects various neurological and Psychiatric disorders. Numerous clinical applications are presently examined and take presurgical planning for different brain disorders. rsfMRI is a non-invasive technique so it does not need patient cooperation. Functional and structural connectivity of brain network is analyzed accurately using different learning algorithms.
The growth of rsfMRI techniques creates an innovative knowledge in the fields of neurology, neuroscience and psychiatry. Enhanced medical applicability moves rsfMRI scanner to multimodal inspections. Impulsive variations of the BOLD signal are correlated with Electroencephalogram, the electron grid records local field and slow cortical potential. Using near infrared spectroscopy spontaneous fluctuations observed using resting-state functional connectivity analyses. Advancement is necessary to analysis different analytical methods and to increase the efficiency in detecting varies brain disease.
References
- 1. Lee, M.H., Smyser, C.D., Shimony, J.S., Resting-state fMRI: A review of methods and clinical applications. AJNR Am. J. Neuroradiol., 34, 10, 1866–1872, Oct. 2013.
- 2. Alves, P.N., Foulon, C., Karolis, V. et al., An improved neuroanatomical model of the default-mode network reconciles previous neuroimaging and neuropathological findings. Commun. Biol., 2, 1–14, 2019.
- 3. de la Iglesia-Vaya, M., Molina-Mateo, J., Escarti-Fabra, M.J., Kanaan, A.S., Marti-Bonmati, L., Brain connections – Resting state fMRI functional connectivity, novel frontiers of advanced neuroimaging, Jan 9th 2013. Available: https://www.intechopen.com/chapters/41878
- 4. Li, X., Guo, N., Li, Q., Functional neuroimaging in the new era of big data. Genom. Proteomic. Bioinform., 17, 4, 393–401, 2019.
- 5. Hohenfeld, C., Werner, C.J., Reetz, K., Resting-state connectivity in neuro-degenerative disorders: Is there potential for an imaging biomarker? NeuroImage Clin., 18, 849– 870, Mar.16, 2018.
- 6. Phinyomark, A., Ibáñez-Marcelo, E., Petri, G., Resting-state fMRI functional connectivity: Big data preprocessing pipelines and topological data analysis. IEEE Trans. Big Data, 3, 4, 415–428, Dec. 2017.
- 7. Gordon, E., Rohrer, J.D., Fox, N.C., Advances in neuroimaging in fronto temporal dementia. J. Neurochem., 138, Suppl 1, 193–210, Aug 2016.
- 8. Tang, C., Y.Wei, J., Zhao, J.N., Different developmental pattern of brain activities in ADHD: A study of resting-state fMRI. Dev. Neurosci., 40, 3, 246–257, 2018.
- 9. Proudfoot, M., Bede, P., Turner, M.R., Imaging cerebral activity in amyotrophic lateral sclerosis. Front. Neurol., 9, 1–13, Jan. 2019.
- 10. Lígia, C., Carlos, S., Elie, C., Diogo, T.-C., Neuroimaging correlates of depression—Implications to clinical practice. Front. Psychiatry, 10, 703, 2019.
- 11. Ramasamy, M.D., Periasamy, K., Krishnasamy, L., Dhanaraj, R.K., Kadry, S., Nam, Y., Multi-disease classification model using Strassen’s half of threshold (SHoT) training algorithm in healthcare sector. IEEE Access, 9, 112624– 112636, 2021.
- 12. Lee, M.H., Smyser, C.D., Shimony, J.S., Resting-state fMRI: A review of methods and clinical applications. Am. J. Neuroradiol., 34, 10, 1866–1872, Oct 2013.
- 13. Kalmady, S.V., Towards artificial intelligence in mental health by improving schizophrenia prediction with multiple brain parcellation ensemble-learning. NPJ Schizophr., 5, 1, 1–11, 18 Jan. 2019.
- 14. Lottman, K.K., Gawne, J.T., Nina. Kraguljac, V., Jeffrey. Killen, F., Meredith. Reid, A., Lahti, C.A., Examining resting-state functional connectivity in first-episode schizophrenia with 7T fMRI and MEG. NeuroImage Clin., 24, 1–10, 2019.
- 15. Dhanaraj, R.K. et al., Random forest bagging and X-means clustered antipattern detection from SQL query log for accessing secure mobile data. Wirel. Commun. Mobile Comput., 2021, 1–9, 2021.
- 16. Uddin, L.Q. and Karlsgodt, K.H., Future directions for examination of brain networks in neurodevelopmental disorders, in: Journal of Clinical Child and Adolescent Psychology: The Official Journal for the Society of Cinical Child and Adolescent Psychology, American Psychological Association, division 53, vol. 47, 2018.
- 17. Sudre, G., Choudhuri, S., Szekely, E., Bonner, T., Goduni, E., Sharp, W., Shaw, P., Estimating the heritability of structural and functional brain connectivity in families affected by attentiondeficit/hyperactivity disorder. JAMA Psychiatry, 74, 76–84, 2017.
- 18. Sripada, C.S., Kessler, D., Angstadt, M., Lag in maturation of the brain’s intrinsic functional architecture in attention-deficit/hyperactivity disorder. Proceedings of the National Academy of Sciences of the United States of America, vol. 111, pp. 14259–64, 2014.
- 19. Yan, C.G., Wang, X.D., Zuo, X.N., Zang, Y.F., DPABI: Data processing & analysis for (RestingState) brain imaging. Neuroinformatics, 14, 339–351, 2016.
- 20. Laird, A.R., Eickhoff, S.B., Li, K., Robin, D.A., Glahn, D.C., Fox, P.T., Investigating the functional heterogeneity of the default mode network using coordinate-based meta-analytic modeling, in: The Journal of Neuroscience: the Official Journal of the Society for Neuroscience, vol. 29, pp. 14496–505, 2009.
- 21. Chandraprabha, M. and Dhanaraj, R.K., Machine learning based pedantic analysis of predictive algorithms in crop yield management. 2020 4th International Conference on Electronics, Communication and Aerospace Technology (ICECA). 2020 4th International Conference on Electronics, Communication and Aerospace Technology (ICECA), 2020, November 5.
- 22. Binnewijzend, M.A., Schoonheim, M.M., Sanz-Arigita, E., Wink, A.M., van der Flier, W.M., Tolboom, N., Adriaanse, S.M., Damoiseaux, J.S., Scheltens, P., van Berckel, B.N., Barkhof, F., Resting-state fMRI changes in Alzheimer’s disease and mild cognitive impairment. Neurobiol. Aging, 33, 9, 2018–28, 2012.
- 23. Mohammadi-Nejad, A.-R., Mahmoudzadeh, M., Hassanpour, M.S., Otto, F.W., Neonatal brain resting-state functional connectivity imaging modalities. Photoacoustics, 10, 1–19, 2018.
- 24. Phinyomark, A., Ibáñez-Marcelo, E., Petri, G., Resting-state fMRI functional connectivity: Big data preprocessing pipelines and topological data analysis. IEEE Trans. Big Data, 3, 4, 415–428, 1 Dec. 2017.
- 25. Sathish, R. and Kumar, D.R., Proficient algorithms for replication attack detection in wireless sensor networks—A survey, in: 2013 IEEE International Conference ON Emerging Trends in Computing, Communication and Nanotechnology (ICECCN), IEEE, pp. 1–7, 2013, March.
- 26. Boerwinkle, A.L., Vedantam, A., Lam, S., Wilfong, A.A., Curry, D.J., Connectivity changes after laser ablation: Resting-state fMRI. Epilepsy Res., 142, 156–160, 2018.
- 27. Ries, A., Spectral analysis of resting-state fMRI BOLD signal in healthy subjects and patients suffering from major depressive disorder, 2019.
- 28. Khosla, M., Jamison, K., Ngo, G.H., Kuceyeski, A., Sabuncu, M.R., Machine learning in resting-state fMRI analysis. Magn. Reson. Imaging, 64, 101–121, 2019.
Note
- *Corresponding author: [email protected]