Introduction to this format
Tests of advanced numerical data interpretation are one of the most difficult forms of numerical reasoning test. Although these questions share a similar format with the graduate-level questions in the previous chapters, this range is benchmarked at a higher level. These questions are more difficult since at least two or more calculations – or more – are needed typically per question. These are not necessarily complex calculations.
The questions are designed to mirror the type of numerical problems that managers face in the workplace and are set within an organisational context. So you are being assessed on applying your numeracy skills to business data. Many of the practice questions are set within the context of a (fictitious) international company called Conglomerate plc. From the table(s)/graph(s) presented you must ‘find’ the data you need to answer the question.
Guidance for advanced data interpretation practice tests
The practice questions appear in sets of 4–6. Each of these is followed by its respective answer explanations.
Start off by deciding what data you need and which of the graphs and/or tables contains it. Then locate the specific data that you need.
You are advised to:
- aim for roughly 1–2 minutes per question since questions can have 1, 2, 3 or more calculation stages;
- check your answers against the answer explanations that follow the test once you have completed all the questions;
- do this before you move on to the next test so that you can apply anything you have learnt immediately – this will aid your memory;
- use a calculator to answer the questions.

- For this question type the number of calculations in a question is high, which greatly increases the opportunity for error.
- Keep things simple whenever possible so that you can focus on getting the calculation correct.
- Don’t go for an answer just because it is the closest to your own calculation. The question will specify if you need to round up an answer.
- Don’t be distracted by complex business language, the size of the figures or the measurement units. Nine times out of ten the measurement units will be constant throughout the question and answer.
- If you can get the right answer by doing a rough calculation then by all means do so.
- You can in some cases simplify things for yourself – for example, focus on the one-to-nine digits in each figure rather on the zeroes (tens, hundreds, thousands, millions even) that follow the digits.
- You can also simplify matters by working to one decimal point, thus cutting down on the number of digits you need to write down and manipulate.
Advanced data interpretation practice test 1
| Conglomerate plc turnover by world region | 2006 (£ millions) | 2007 (£ millions) | 2008 (£ millions) |
|---|
| Asia-Pacific | 280.8 | 282.3 | 292.2 |
| UK | 479.3 | 482.5 | 477.9 |
| North America | 341 | 352.7 | 364.5 |
| South America | 180.3 | 133.9 | 86.7 |
| Rest of world | 139.2 | 162.2 | 174.7 |
| Total | 1,420.6 | 1,413.6 | 1,396.0 |
| Conglomerate plc worldwide turnover by market sector | 2006 (£ millions) | 2007 (£ millions) | 2008 (£ millions) |
|---|
| Retail | 314.5 | 318.2 | 321.9 |
| Leisure markets | 173.1 | 164.6 | 161.8 |
| Packaging | 469.2 | 474.9 | 467.6 |
| Food markets | 411.6 | 403.1 | 392.3 |
| Other markets | 52.2 | 52.8 | 52.4 |
| Total | 1,420.6 | 1,413.6 | 1,396.0 |
Conglomerate plc projected UK regional sales (£ millions) for 2009

| 1 | How many world regions and market sectors have shown an annual turnover increase for the years 2007 and 2008? |
| (A) 1 world region; 1 market sector |
| (B) 1 world region; 2 market sectors |
| (C) 2 world regions; 1 market sector |
| (D) 2 world regions; 2 market sectors |
| (E) 3 world regions; 1 market sector |
| 2 | Which market sector and which world region have shown the lowest absolute change between 2006 and 2008? |
| (A) South America, Retail |
| (B) Asia-Pacific, Packaging |
| (C) Other markets, Packaging |
| (D) UK, Other markets |
| (E) UK, Packaging |
| 3 | What approximate percentage change in UK regional sales is predicted from 2008 to 2009? |
| (A) None of these |
| (B) 43% decrease |
| (C) 43% increase |
| (D) 75% decrease |
| (E) 75% increase |
| 4 | What is the absolute difference (in £ millions) between the highest and the lowest performing market sectors (highest and lowest turnovers) between 2006 and 2008? |
| (A) £7.4 million |
| (B) £19.3 million |
| (C) £26.7 million |
| (D) £29.3 million |
| (E) £30.7 million |
| 5 | What are the total projected sales for 2009 in the Northern and Southern regions? |
| (A) £140.5 million |
| (B) £158.2 million |
| (C) £190.5 million |
| (D) £198.1 million |
| (E) £273.4 million |
Review your answers to practice test 1
| 1 | Answer (E) is correct: 3 world regions; 1 market sector
Where’s the information I need? Look in: Conglomerate plc turnover by world region and Conglomerate plc worldwide turnover by market sector tables.
Count up the number of regions and sectors that have increased between 2006 and 2007, 2007 and 2008:
Asia-Pacific, North America, Rest of World = 3 world regions
Retail = 1 market sector |
| 2 | Answer (D) is correct: UK, Other markets
Where’s the information I need? Look in: Conglomerate plc turnover by world region and Conglomerate plc worldwide turnover by market sector tables.
Calculate the difference between the 2006 and 2008 figures for each world region and each market sector: |

Absolute change means that you can ignore where the change has been an increase or a decrease.
| Asia-Pacific = 292.2 – 280.8 = 11.4
UK = 477.9 – 479.3= –1.4
North America = 364.5 – 341 = 23.5
South America = 180.3 – 86.7 = 93.6
Rest of world = 174.7 – 139.2 = 35.5
Retail = 321.9 – 314.5 = 7.4
Leisure markets = 161.8 – 173.1 = – 11.3
Packaging = 467.6 – 469.2 = –1.6
Food markets = 392.3 – 411.6 = –19.3
Other markets = 52.4 – 52.2 = 0.2 |
| 3 | Answer (B) is correct: 43% decrease
Where’s the information I need? Look in: Conglomerate plc turnover by world region table and Conglomerate plc projected UK regional sales (£ millions) for 2009 graph. |
| Step 1: The 2008 figure for the UK, £477.9 million, can be read directly from the Conglomerate plc turnover by world region table. |
| Step 2: Find the sum of the projected UK regional sales figures:
London total + Southern total + Northern total
75.3 + 115.2 + 82.9 = 273.4 |
| Step 3: Find the difference:
477.9 – 273.4 = 204.5 |
| Step 4: Turn this into a percentage:
100% × 204.5/477.9 = 43% (rounded up) |
| 4 | Answer (C) is correct: £26.7 million
Where’s the information I need? Look in: Conglomerate plc worldwide turnover by market sector table. |
| Step 1: You need to calculate the difference in sales for each market sector between 2006 and 2008. This has already been done for Question 2. The most profitable sector is Retail (£7.4 million increase in sales). The least profitable sector is Food markets (£19.3 million drop in sales). |
| Step 2: Difference = 19.3 + 7.4 = £26.7 million |
| 5 | Answer (D) is correct: £198.1 million
Where’s the information I need? Look in: Conglomerate plc Projected UK regional sales (£ millions) table.
Add the projected sales for the Northern and the Southern regions: £82.9 + £115.2 = £198.1 million |
Advanced data interpretation practice test 2
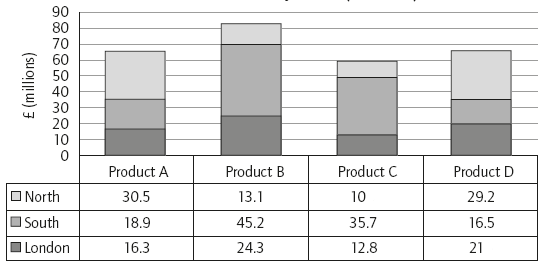
Product A, B, C sales in Year X for Conglomerate plc

| Conglomerate plc world regions operational source | New customer packaging sales for 2008 ($100,000s) |
|---|
| Asia-Pacific | 7.2 |
| Europe | 5.3 |
| North America | 4.2 |
| South America | 8.1 |
| Rest of world | 3.5 |
Conglomerate plc total packaging sales ($100,000s) for
2008 (including new customer packaging sales)
| 1 | The worldwide target for Product A sales is $18 million. From sales levels in Year x, by how much approximately do Product A sales need to increase to reach this target? |
| (A) $20,000 |
| (B) $200,000 |
| (C) $0.4 million |
| (D) $0.6 million |
| (E) $0.8 million |
| 2 | Which two regions together have combined Product A, B and C sales in Year x that are less than $22 million? |
| (A) Rest of world, North America |
| (B) Europe, South America |
| (C) Europe, North America |
| (D) North America, South America |
| (E) Europe, Rest of world |
| 3 | What are the total new customer packaging sales for 2008? |
| (A) $2.38 million |
| (B) $2.63 million |
| (C) $2.83 million |
| (D) $2.88 million |
| (E) $3.83 million |
| 4 | Which region’s individual packaging sales has the highest percentage of new customer sales in 2008? |
| (A) Asia-Pacific |
| (B) Europe |
| (C) North America |
| (D) South America |
| (E) Rest of world |
| 5 | What is the ratio of European to Rest of world total packaging sales in 2008? |
| (A) 2:9 |
| (B) 9:2 |
| (C) 1:9 |
| (D) 9:1 |
| (E) 4:1 |
Review your answers to practice test 2
| 1 | Answer (D) is correct: $0.6 million
Where’s the information I need? Look in: Product A, B, C sales in Year x graph.
Step 1: Find the sales in Year x for Product A ($100,000s): 23.6 + 33.7 + 45.3 + 29.5 + 42.2 = 174.3
174.3 (in $100,000s) = $17.4 million |
| Step 2: Find the difference:
$18 million – $17.4 million = $0.6 million |
| 2 | Answer (C) is correct: Europe, North America
Where’s the information I need? Look in: Product A, B, C sales in Year x graph.
Step 1: Calculate (in $100,000s to keep things simple) the total Product A, B and C sales for each world region shown:
Asia-Pacific = 23.6 + 65.5 + 59.2 = 148.3
North America = 33.7 + 24.8 + 34.6 = 93.1
South America = 45.3 + 31.6 + 52 = 128.9
Europe = 29.5 + 21.5 + 39 = 90
Rest of world = 42.2 + 57.4 + 46.8 = 146.4 |
| Step 2: The two regions with the lowest sales (Europe, North America) are those that when combined have sales less than $22 million ($9,000,000 + $9,300,000 = $18,300,000). |
| 3 | Answer C) is correct: $2.83 million
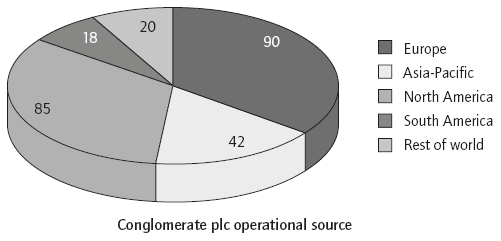
Where’s the information I need? Look in: Conglomerate plc world regions operational source table.
7.2 + 5.3 + 4.2 + 8.1 + 3.5 = $2.83 million |
| 4 | Answer (D) is correct: South America
Where’s the information I need? Look in: Conglomerate plc world regions operational source table and Total packaging sales pie chart.
Calculate the percentage of new business per region:
Asia-Pacific = 100% × 7.2/42 = 17.1%
North America = 100% × 4.2/85 = 4.9%
South America = 100% × 8.1/18 = 45%
Europe = 100% × 5.3/90 = 5.9%
Rest of world = 100% × 3.5/20 = 17.5% |
| 5 | Answer (B) is correct: 9:2
Where’s the information I need? Look in: Total packaging sales pie chart.
90:20 = 9:2 |
Advanced data interpretation practice test 3
Retail sales for Product A (£10,000s)

Telecommunications company
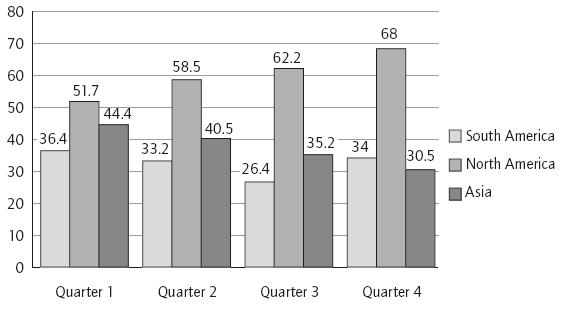
UK sales 2008 by market (£ millions)
Telecommunications company
non-UK sales of Products A, B, C and D 2008 (£ millions)
| 1 | In which two months is there the same difference between the high street and retail sales for Product A? |
| (A) January, February |
| (B) January, August |
| (C) February, August |
| (D) None of these |
| (E) April, May |
| 2 | In which month were high street retail sales higher than retail park sales for Product A? |
| (A) None of these |
| (B) January |
| (C) February |
| (D) July |
| (E) August |
| 3 | Between which months did both the retail park and high street sales of Product A fall? |
| (A) February to March |
| (B) March to April |
| (C) April to May |
| (D) May to June |
| (E) June to July |
| 4 | In 2008 what is the difference between the UK and Asian sales (to the nearest £ million)? |
| (A) £113 million |
| (B) £123 million |
| (C) £133 million |
| (D) £143 million |
| (E) £153 million |
| 5 | In which two quarters were the total non-UK sales the same? |
| (A) Quarter 1, Quarter 2 |
| (B) Quarter 1, Quarter 3 |
| (C) Quarter 1, Quarter 4 |
| (D) Quarter 2, Quarter 3 |
| (E) Quarter 3, Quarter 4 |
| 6 | Due to increasing inflation, 2009’s quarterly non-UK sales are predicted to be 3%, 4%, 5% and 6% higher than the respective 2008 quarters. What is the total sales prediction for 2009? |
| (A) £544.4 million |
| (B) £555.5 million |
| (C) £566.6 million |
| (D) £577.7 million |
| (E) £588.8 million |
Review your answers to practice test 3
| 1 | Answer (E) is correct: April, May
Where’s the information I need? Look in: Retail sales for Product A (£10,000s) graph.
Work out the differences, as follows: |
| Jan | 5.1 | 7.5 | 2.4 |
| Feb | 12.5 | 15 | 2.5 |
| March | 15.3 | 22.7 | 7.4 |
| April | 20.4 | 30.1 | 9.7 |
| May | 14.9 | 24.6 | 9.7 |
| June | 15.1 | 17.8 | 2.7 |
| July | 15.6 | 24.4 | 8.8 |
| August | 17.3 | 19.9 | 2.6 |
| 2 | Answer (A) is correct: None of these
Where’s the information I need? Look in: Retail sales for Product A (£10,000s) graph.
The line graph for Retail park sales is above the line graph for high street retail sales for each month shown. |
| 3 | Answer (C) is correct: April to May
Where’s the information I need? Look in: Retail sales for Product A (£10,000s) graph.
Review this to establish when the line graph for Retail park sales and the line graph for high street retail sales are both sloping downwards. |
| 4 | Answer (B) is correct: £123 million
Where’s the information I need? Look in: Telecommunications company – non-UK sales graph and Telecommunications company – UK sales 2008 by market (£ millions) graph. |
| Step 1: Find the totals for UK sales and Asian sales:
UK sales: 82.8 (North) + 116.3 (South) + 74.4 (London) = £273.5 million
Asian sales: 44.4 + 40.5 + 35.2 + 30.5 = £150.6 million |
| Step 2: Find the difference (to the nearest £ million):
£273 million – £150 million = £123 million |
| 5 | Answer (C) is correct: Quarter 1, Quarter 4
Where’s the information I need? Look in: Telecommunications company – non-UK sales graph.
Calculate the quarterly totals:
Quarter 1 = 132.5
Quarter 2 = 132.2
Quarter 3 = 123.8
Quarter 4 = 132.5 |
| 6 | Answer (A) is correct: £544.4 million
Where’s the information I need? Look in: Telecommunications company – non-UK sales graph. |
| Step 1: Add the relevant percentage increase to the relevant quarters:
Quarter 1: 132.5 × 10³% = 136.48
Quarter 2: 132.2 × 10⁴% = 137.49
Quarter 3: 123.8 × 10⁵% = 129.99
Quarter 4: 132.5 × 10⁶% = 140.45 |
| Step 2: Add up these totals = £544.4 million |
Advanced data interpretation practice test 4
Conglomerate plc UK function

Conglomerate plc worldwide turnover
| 2006 (£ millions) | 2007 (£ millions) | 2008 (£ millions) |
|---|
| Retail | 358.9 | 342.1 | 321.9 |
| Packaging | 162.3 | 164.1 | 161.8 |
| Food | 441.4 | 466.0 | 467.6 |
| Leisure | 358.2 | 377.6 | 392.3 |
| Other markets | 59.4 | 62.7 | 52.4 |
| Total turnover | 1,380.2 | 1,412.5 | 1,396 |
| 1 | What is the difference between the total costs for the four quarters and the yearly budget? |
| (A) | £1.5 million |
| (B) | £1 million |
| (C) | £750,000 |
| (D) | £250,000 |
| (E) | £150,000 |
| 2 | Which area’s quarterly costs have the highest discrepancy with the yearly budget? |
| (A) | Sales/marketing |
| (B) | Production |
| (C) | Operations |
| (D) | Overheads |
| (E) | Rent/office expenses |
| 3 | Which of the following statements is true? |
| (A) | Quarter 1 contributed the most to the budget overspend |
| (B) | Production has the highest yearly budget |
| (C) | Operational costs have been increasing between Quarter 1 and Quarter 4 |
| (D) | Worldwide turnover was highest in 2008 |
| (E) | Worldwide turnover for all three years combined was less than £4,100 million |
| 4 | Which of the following contributed the highest percentage to worldwide turnover between 2006 and 2008? |
| (A) | Retail |
| (B) | Packaging |
| (C) | Food |
| (D) | Leisure |
| (E) | Other markets |
Review your answers to practice test 4
Answer (E) is correct: £150,000
| 1 | Where’s the information I need? Look in: Conglomerate plc UK functions table. |
| Step 1:
Calculate the total costs for the four quarters:
Quarter 1 = 33.9
Quarter 2 = 35
Quarter 3 = 37.8
Quarter 4 = 36.8
Total = 143.5 |
| Step 2: Compare with the yearly budget to find the difference: 142
143.5 –142 =1.5 (in £100,000’s) = £150,000 |
| 2 | Answer (B) is correct: Production
Where’s the information I need? Look in: Conglomerate plc UK functions table.
Calculate the differences between budget and cost for each function:
Sales/marketing: 12 (budget) – 10.6 = 1.4
Production: 35 (budget) – 37.5 = –2.5
Operational: 64 (budget) – 65 = –1
Overheads: 7 (budget) – 6.6 = 0.4
Rent/office expenses: 24 (budget) – 23.8 = 0.2 |
| 3 | Answer (C) is correct: Operational costs have been increasing between Quarter 1 and Quarter 4
Where’s the information I need? Look in: Conglomerate plc worldwide turnover (to year end) table and Conglomerate plc UK function table.
Taking the statements one at a time: |
| (A) | Quarter 1 contributed the most to the budget overspend.
FALSE – Calculate the totals for each quarter:
Quarter 1 = 33.9
Quarter 2 = 35
Quarter 3 = 37.8
Quarter 4 = 36.8
It is Quarter 3 where the most has been spent. |
| (B) | Production has the highest yearly budget.
FALSE – Operations has the highest yearly budget. |
| (C) | Operational costs have been increasing between Quarter 1 and Quarter 4.
TRUE – You can see this visually from scanning the chart of figures. If you did this before going through some of the other statements (particularly statement (A)) then well done you! |
| (D) | Worldwide turnover was highest in 2008.
FALSE – Worldwide turnover was highest in 2007. |
| (E) | Worldwide turnover was less than £4,100 million.
FALSE – Worldwide turnover = £1,380.2 + £1,412.5 + £1,396 = £4,188.7 million |
| 4 | Answer (C) is correct: Food
Where’s the information I need? Look in: Conglomerate plc worldwide turnover (to year end) table.
Think through what the question is really asking. You can reinterpret the question as ‘which had the highest sales worldwide?’ Hence you just need to total the sales for each:
Retail’s total sales 2006–2008 = 1,022.9
Packaging’s total sales 2006–2008 = 488.2
Food’s total sales 2006–2008 = 1,375
Leisure’s total sales 2006–2008 = 1,128.1
Other market’s total sales 2006–2008 = 174.5 |
Advanced data interpretation practice test 5
Female packaging employees 2008
(at Pennon location)
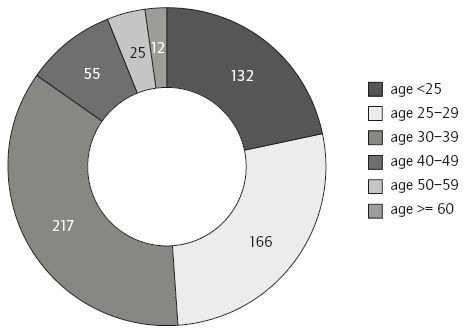
Male packaging employees 2008
(at Pennon location)

Conglomerate plc employees by function 2006–2008
| | 2006 | 2007 | 2008 |
|---|
| Retail | 3,580 | 3,973 | 3,855 |
| Logistics | 1,425 | 1,511 | 1,636 |
| Packaging | 1,672 | 1,487 | 1,622 |
| Food | 1,561 | 1,509 | 1,588 |
| Leisure | 2,451 | 2,486 | 2,121 |
| Total | 10,689 | 10,966 | 10,822 |
| 1 | Which age band for packaging employees at Pennon contains the highest ratio of male to female employees? |
| (A) <25 years |
| (B) 25–29 years |
| (C) 30–39 years |
| (D) 40–49 years |
| (E) 50–59 years |
| 2 | What is the total number of employees under 30 years of age at the Pennon location? |
| (A) 367 |
| (B) 467 |
| (C) 647 |
| (D) 677 |
| (E) 766 |
| 3 | In 2008 there are two packaging sites: at Pennon and Asle. How many employees work at the Asle site? |
| (A) 276 |
| (B) 286 |
| (C) 296 |
| (D) 306 |
| (E) 315 |
| 4 | Which function has experienced the second largest change in staff numbers between 2006 and 2008? |
| (A) Retail |
| (B) Logistics |
| (C) Packaging |
| (D) Food |
| (E) Leisure |
| 5 | If the Retail profits in 2007 are £79.46 million what are the profits per Retail employee? |
| (A) £22,000 |
| (B) £20,000 |
| (C) £19,200 |
| (D) £2,200 |
| (E) £2,000 |
Review your answers to practice test 5
| 1 | Answer (E) is correct: 50–59 years
Where’s the information I need? Look in: Female packaging employees in 2008 (at Pennon location) pie chart and Male packaging employees in 2008 (at Pennon location) pie chart.
Calculate the ratio of male to female employees for each age band. |
The ratio of male to female employees for those aged 50–59 years is far higher than for any of the other age bands. You could perhaps have got to this answer by writing down the respective numbers of male and female employees and then comparing them visually.
| 2 | Answer (C) is correct: 647
Where’s the information I need? Look in: Female packaging employees in 2008 (at Pennon location) pie chart and Male packaging employees in 2008 (at Pennon location) pie chart. |
| Age <25 | Age 25–29 |
|---|
| Female | 132 | 166 |
| Male | 199 | 150 |
| 3 | Answer (B) is correct: 286
Where’s the information I need? Look in: Conglomerate plc employees by function table and Male and Female packaging employees pie charts. |
| Step 1: The total number of Packaging employees in 2008 is 1,622. |
| Step 2: Find the total number of employees at the Pennon site:
607 females + 729 males = 1,336 |
| Step 3: Find the difference:
1,622 – 1,336 = 286 employees |
| 4 | Answer (A) is correct: Retail
Where’s the information I need? Look in: Conglomerate plc employees by function 2006–2008 table.
Work out each function’s changes in staff numbers between 2006 and 2008:
Retail = 3,855 – 3,580 = 275 more employees
Logistics = 1,636 – 1,425 = 211 more employees
Packaging = 1,622 – 1,672 = 50 fewer employees
Food = 1,588 – 1,561 = 27 more employees
Leisure = 2,121 – 2,451 = 330 fewer employees
The question asks about the difference, so where there have been more or fewer employees. The second largest difference is Retail. |
| 5 | Answer B is correct: £20,000
Where’s the information I need? Look in: Conglomerate plc employees by function table. This shows that the number of Retail employees in 2007 was 3,973.
Profits per employee = £79,460,000/3,973 = £20,000 |
Advanced data interpretation practice test 6
Conglomerate plc share price (pence) against main competitor

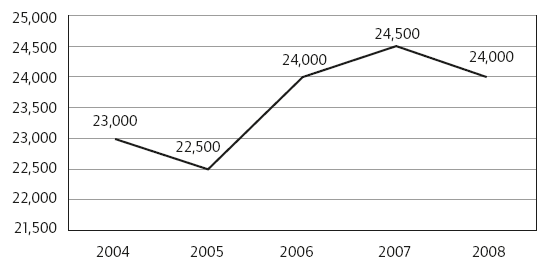
Conglomerate plc average graduate starting salary (in £)
Average UK salary by function (2008)
| Function | UK industry – Average Director salary (£1,000s) | UK industry – Average graduate starting salary (£1,000s) |
|---|
| Engineering/IT | 78.5 | 24.1 |
| Operations | 74.8 | 23.6 |
| Marketing | 75.4 | 22.4 |
| Finance | 89.2 | 23.5 |
| Corporate | 91.5 | 25.1 |
| 1 | Over the six-year period what is the range of the price difference between the Conglomerate plc share price and its main competitor? |
| (A) 0–150p |
| (B) 0–125p |
| (C) 0–100p |
| (D) 0–75p |
| (E) 0–50p |
| 2 | How many Conglomerate plc shares would a speculator with £33,000 be able to buy at the 2006 share price? |
| (A) 220,000 |
| (B) 22,000 |
| (C) 2,200 |
| (D) 220 |
| (E) 22 |
| 3 | If the same absolute downward trend in starting salaries between 2007 and 2008 continued between 2008 and 2009, what would the Conglomerate plc 2009 average graduate starting salary be? |
| (A) £24,500 |
| (B) £24,000 |
| (C) £23,500 |
| (D) £23,000 |
| (E) £22,500 |
| 4 | What is the average graduate starting salary across the five years shown? |
| (A) £22,200 |
| (B) £23,200 |
| (C) £23,500 |
| (D) £23,600 |
| (E) £24,500 |
| 5 | In which UK industry functions are there the greatest and the least difference between Director and graduate salaries? |
| (A) Corporate (greatest); Operations (least) |
| (B) Finance (greatest); Operations (least) |
| (C) Corporate (greatest); Marketing (least) |
| (D) Finance (greatest); Marketing (least) |
| (E) Engineering/IT (greatest); Operations (least) |
| 6 | What would the average Finance Director salary be in euros (to the nearest €100)? Use an exchange rate of €1.12 to the £. |
| (A) €93,900 |
| (B) €95,900 |
| (C) €97,900 |
| (D) €99,900 |
| (E) €101,900 |
Review your answers to practice test 6
| 1 | Answer (A) is correct: 0–150p
Where’s the information I need? Look in: Conglomerate plc share price (pence) against main competitor graph.
This range can be obtained by finding the largest gap between the two lines on the graph. This gives you readings of 275p compared to 125p.
275 – 125 = 150 |
| 2 | Answer (B) is correct: 22,000
Where’s the information I need? Look in: Conglomerate plc share price (pence) against main competitor graph. The average 2006 share price is £1.50.
Number of shares = 33,000/1.5 = 22,000 |
| 3 | Answer (C) is correct: £23,500
Where’s the information I need? Look in: Conglomerate plc average graduate starting salary (2003–2008) graph. |
| Step 1: Calculate the decrease in starting salary between 2007 and 2008:
£24,500 – £24,000 = £500 decrease |
| Step 2: Deduct this amount from the 2008 starting salary:
£24,000 – £500 = £23,500 |
| 4 | Answer (D) is correct: £23,600
Where’s the information I need? Look in: Conglomerate plc average graduate starting salary (2003–2008) graph.
Calculate the average:
(£23,000 + £22,500 + £24,000 + £24,500 + £24,000)/5 = £23,600 |
| 5 | Answer (A) is correct: Corporate (greatest); Operations (least)
Where’s the information I need? Look in: Average UK salary by function (2008) table.
Calculate the differences between Director and graduate salaries for each industry function:
Engineering/IT = 78.5 – 24.1 = 54.4
Operations = 74.8 – 23.6 = 51.2
Marketing = 75.4 – 22.4 = 53
Finance = 89.2 – 23.5 = 65.7
Corporate = 91.5 – 25.1 = 66.4 |
| 6 | Answer (D) is correct: €99,900
Where’s the information I need? Look in: Average UK salary by function (2008) table.
The table gives you the average Finance Director salary (£89,200). Convert this into euros:
£89,200 × €1.12 = €99,904 |
Advanced data interpretation practice test 7
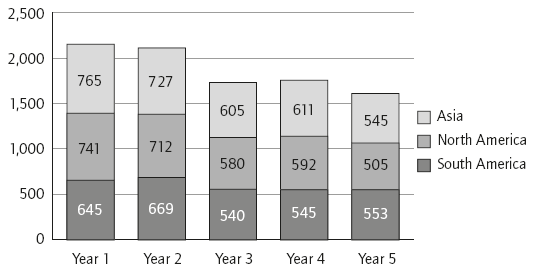
Sales by region (£100,000s)
Conglomerate plc UK staff 2008 by function and qualification

| 1 | In which year was there a greater than 10% drop in regional sales? |
| (A) Year 1 |
| (B) Year 2 |
| (C) Year 3 |
| (D) Year 4 |
| (E) Year 5 |
| 2 | What are the total Asian sales across Years 1–5 in euros using an exchange rate of €1.11 to the £ (to the nearest € million)? |
| (A) €361 million |
| (B) €353 million |
| (C) €341 million |
| (D) €333 million |
| (E) €323 million |
| 3 | What were the total sales for North America across the five years in £ millions? |
| (A) £313 million |
| (B) £318 million |
| (C) £320 million |
| (D) £321 million |
| (E) £323 million |
| 4 | Which function has 22.4% of the total graduate employees? |
| (A) Corporate |
| (B) Finance |
| (C) Marketing |
| (D) Engineering/IT |
| (E) Operations |
| 5 | What percentage of total Engineering and IT employees are non-graduates? |
| (A) 40% |
| (B) 41% |
| (C) 42% |
| (D) 43% |
| (E) 44% |
Review your answers to practice test 7
| 1 | Answer (C) is correct: Year 3
Where’s the information I need? Look in: Sales by region (£100,000s) graph.
The graph shows that there are three possible periods when there has been a year-on-year decrease in regional sales:
Year 2 = 100% × (2,108 – 2,151)/2,151 = 2% decrease
Year 3 = 100% × (1,725 – 2,108)/2,108 = 18.2% decrease
Year 5 = 100% × (1,603 – 1,748)/1,748 = 8.3% decrease |
| 2 | Answer (A) is correct: €361 million
Where’s the information I need? Look in: Sales by region (£100,000s) graph. |
| Step 1: Calculate the total Asian sales across all five years:
765 + 727 + 605 + 611 + 545 = 3,253 |
| Step 2: Convert to euros:
3,253 × €1.11 = 361 (€ millions) |
| 3 | Answer (A) is correct: £313 million
Where’s the information I need? Look in: Sales by region (£100,000s) graph.
Calculate the total North American earnings across all five years:
741 + 712 + 580 + 592 + 505 = 3,130 or £313 million |
| 4 | Answer (D) is correct: Engineering/IT
Where’s the information I need? Look in: Conglomerate plc UK staff 2008 by function and qualification graph. |
| Step 1: Find the total number of graduate employees:
284 + 251 + 182 + 259 + 178 = 1,154 |
| Step 2: Find the percentage of graduate employees within each function:
Corporate: 284/1,154 × 100% = 24.6%
Finance: 251/1,154 × 100% = 21.8%
Marketing: 182/1,154 × 100% = 15.8%
Engineering/IT: 259/1,154 × 100% = 22.4%
Operations: 178/1,154 × 100% = 15.4%
Alternatively, a much quicker calculation is to find 22.4% of 1,154 = 259, and then see which sector has that number |
| 5 | Answer (D) is correct: 43%
Where’s the information I need? Look in: Conglomerate plc UK staff 2008 by function and qualification graph.
There are 306 non-graduates working in Conglomerate’s Engineering and IT functions. |
| Step 1: Find the total Engineering and IT employees:
259 + 306 + 149 = 714 |
| Step 2: Find the percentage that are non-graduates:
306/714 = 43% (to the nearest whole per cent) |