
After completing this chapter, you will be able to
Understand PowerPivot for Excel and PowerPivot for SharePoint.
Understand how PowerPivot extends Excel functionality with Data Analysis Expressions.
Create PowerPivot workbooks in Excel 2010.
Publish PowerPivot workbooks to SharePoint 2010.
Set up a periodic data refresh to a PowerPivot-enabled workbook in SharePoint 2010.
As explained in Chapter 1, you can understand business intelligence (BI) as activities and practices that use fact-based support systems to improve the business decision-making process. Traditionally, those fact-based support systems have often been data-driven analytics and reporting tools developed by database administrators (DBAs) and developers, such as standard reports, scorecards, and applications.
Clearly, the DBAs and developers from an IT department cannot handle all that demand. An IT department has only so many resources and must focus on the most important projects. It’s likely that IT has been able to satisfy only a small fraction of the BI demand.
So, what happens with all that demand that does not make it onto IT’s plate? Usually, those projects get done without involving IT at all. The users cobble up solutions themselves—and they can do a good job if they use the right tools. In other words, they are already performing self-service BI. Self-service BI is a way for business users to easily access the data that they need to create the necessary reports and analysis themselves, without involving IT personnel at their company.
While many tools exist that business or information workers can reach for to help meet their BI needs, it’s Microsoft Excel that they use most often. A large number of today’s business decisions are based on information stored in Excel workbooks. Unfortunately, this popular approach has a few caveats:
It’s fairly common to share those workbooks by email or in a file share. This can potentially raise security issues.
It’s hard to ensure that everybody working with a given workbook is using the same version, because access to such files is rarely monitored or controlled.
Refreshing existing workbooks with new data can be a lot of work—and potentially, it’s work that should be done often.
Many times the data sources for those workbooks can be used without IT’s knowledge.
As a consequence, a natural—and inevitable—tension exists between users, who want to get things done quickly, and the IT department, which wants control. There is nothing wrong with either side’s approach; that’s just how things are.
To address the needs from the business users, while simultaneously keeping the needs of the IT department in mind, Microsoft developed PowerPivot for Excel and PowerPivot for SharePoint. Together, these applications represent Microsoft’s implementation of self-service Business Intelligence.
PowerPivot may not solve all the problems, but it is paradigm shift that gives powerful BI capabilities to business analysts that they can develop themselves. Here are a few such capabilities that PowerPivot brings to the table:
Adding more powerful tools for the users in Excel . Tasks that used to take hours now take only minutes (or even seconds), and some tasks that were simply impossible are now possible. For example, PowerPivot makes it possible to work with millions of rows in an Excel workbook.
Scheduled, automatic report refresh . You can configure the workbooks to refresh automatically and periodically without human intervention.
Transparency for IT . After a workbook has been published to a SharePoint location, everything happens within the realm of IT. That way, IT controls the security of the workbooks through SharePoint, can control which data sources are being used by the PowerPivot workbooks, and can learn which workbooks are actually being used and by whom, and so on.
PowerPivot for Excel is an add-in for Microsoft Excel 2010. It includes a modified version of the SQL Server Analysis Services engine. It plugs this powerful and fast data-crunching engine into Excel, greatly enhancing the capabilities of the most-used client available. Instead of dimensional modeling, users work with tables. Instead of Multidimensional Expressions (MDX) queries, users work with Data Analysis Expressions (DAX), a language that resembles Excel’s Formulas language.
Similarly, PowerPivot for SharePoint integrates the SQL Server Analysis Services 2008 R2 engine with SharePoint 2010. PowerPivot for SharePoint gives users the ability to securely share, manage, and refresh workbooks stored in SharePoint, while giving IT the control necessary for managing security and learning about workbook usage.
PowerPivot’s history started with two internal Microsoft papers by Amir Netz in 2006, who was then an Architect in the SQL Server Analysis Team.
The first paper introduced the concept of a BI “sandbox,” which was conceived as a product that would allow BI applications to be created in a much easier way—in a controlled environment that would include relational databases, multidimensional databases, and a reporting tool. While the paper helped to shape PowerPivot from concept to product, many of the original ideas changed. For example, in the original paper, Microsoft Access was the client application, not Excel, but nevertheless, many of Netz’s ideas formed the essence of PowerPivot.
The second paper was about an in-memory BI engine. The business idea was to take advantage of the market trends in computer hardware (such as reduced RAM prices and increased adoption of multi-core processors) that would allow this in-memory engine to be feasible. In fact, the in-memory engine would make some of the ideas in the first paper possible.
Eventually, Microsoft created a small incubation team to explore the ideas in the papers. This incubation team spent the SQL Server 2008 R2 development cycle writing specifications, plans, code, and tests for the product that eventually became PowerPivot. PowerPivot for Excel 2010 and PowerPivot for SharePoint, currently in their first version, were released in May 2010 as part of the Microsoft SQL Server 2008 R2 release.
If you are considering using Excel 2010 to crunch data, you should use PowerPivot. It is a free download. PowerPivot for Excel enhances Excel’s capabilities in many different ways:
It provides the ability to work with complex data in a relational way, using tables.
It uses the in-memory Analysis Services Engine, the VertiPaq engine, to work with huge amounts of data without the limitations of Excel.
It offers many ways to acquire data. You can gather data from many different data sources—from relational databases such as SQL Server, Oracle, Teradata, cubes in SQL Server Analysis Services, text files, and data feeds, and you can even copy and paste! This data is then embedded into the workbook.
It provides an easy way to work with the data embedded in the workbook by using DAX, which is a powerful expression language to define calculations. DAX is designed to be similar to Excel formulas, for ease of use, but adds greater processing power that can work with large amounts of data.
Note
Appendix B, provides a list of DAX functions, along with brief explanations of each.
After you have created PowerPivot workbooks by using your desktop Excel application, you’ll probably want to:
Share them with other users in a secure and reliable way
Refresh them periodically and automatically
Make sure that all the workbook’s users see its most current version
Turn your workbook into a web-based BI application, viewing and interacting with it in the browser
Empower the IT professionals with tools to assist with the management of the PowerPivot workbooks
PowerPivot for SharePoint is designed to meet the requirements of all the preceding scenarios, giving you a way to share, refresh, and update workbooks in a secure way that adheres to IT security policies while enabling users to interact with the content of the workbooks from their browsers.
PowerPivot for Excel 2010 is a managed Excel add-in that is part of the SQL Server 2008 R2 release. Microsoft offers it as a free download, available at http://www.powerpivot.com/download.aspx .
Starting with the 2010 release, Excel comes in two versions: a 32-bit version and a new 64-bit version. PowerPivot also comes in 32-bit and 64-bit versions—and your versions should match. So if you are using the 32-bit version of Excel, you should install the 32-bit version of PowerPivot, and if you are using the 64-bit version of Excel, install the 64-bit version of PowerPivot.
Note
If you are working with large amounts of data, you should use the 64-bit version. The 32-bit version is limited to 2 GB of memory for Excel processes, and because PowerPivot runs within the Excel process, it would actually have somewhat less than 2 GB of available memory. The memory limit of the 64-bit version of both Excel and PowerPivot is essentially all the memory available on your computer.
To get started with PowerPivot and the examples in this chapter, perform the steps in the following procedure.
Install Excel 2010 from the Office suite along with the Office Shared Features. The Office Shared Features include Visual Studio Tools for Office (VSTO) 4.0, which is a prerequisite for using PowerPivot for Excel.
Download and install PowerPivot for Excel, available at http://go.microsoft.com/fwlink/?LinkId=207852 .
Install SQL Server 2008 R2. You can use an existing SQL Server 2008 or 2008 R2 instance.
For the examples in this chapter, you will use the relational database from the “Microsoft Contoso BI Demo Dataset Retail Industry.” You can download the Contoso sample database (ContosoBIDemoBAK.exe) from http://go.microsoft.com/fwlink/?LinkId=214637 . After downloading the file, run it to extract the relational backup file.
Open SQL Server Management Studio and connect to your SQL Server 2008 instance, and then restore the Contoso relational backup database that you downloaded and extracted in the preceding step.
After you have installed both Microsoft Excel 2010 and PowerPivot for Excel, you’ll see a new PowerPivot tab on the Excel ribbon, as shown in the following illustration.

On the PowerPivot tab, click PowerPivot Window. A new window opens with the PowerPivot ribbon, as shown in the following illustration. Using the PowerPivot window, you can import data from various sources, manage relationships, filter, and create calculated columns with DAX.

PowerPivot for SharePoint must be installed by an IT professional because the installation requires administrative access to servers. Installing PowerPivot for SharePoint is potentially a very complex task, depending on the configuration of your SharePoint farm. Fortunately, some good white papers have been published, which describe the setup process in detail. These include:
“PowerPivot for SharePoint—Single Server Installation” ( http://msdn.microsoft.com/en-us/library/ff963565.aspx )
“PowerPivot for SharePoint—Existing Farm Installation” ( http://msdn.microsoft.com/en-us/library/gg144594.aspx )
When you have successfully installed both Microsoft Excel 2010 and PowerPivot for Excel and have the Contoso relational database ready for use, you are ready to create a BI application with PowerPivot. The first step is to import the data.
There are many places from which you might want to import data, including the following:
A relational database (SQL Server, Oracle, Teradata, DB2, and so on)
A cube (SQL Server Analysis Services database)
A Reporting Services report
A data feed
Text files
Windows Azure Marketplace DataMarket
Data stored in your clipboard
The following sections explore some of these methods in more detail.
To import data from a relational database, you need to identify the database, make a connection to it, and select the data you want. You can practice these steps in the following procedure.
On the Home tab of the PowerPivot window, click From Database, as shown in the following illustration, and then click From SQL Server.
The Table Import Wizard starts. Fill in the Server Name field with the server name and instance of the SQL Server you want to access (or select a database from the drop-down list).
From the Database Name drop-down list, select the ContosoRetailDW database you installed earlier, as shown in the following illustration, and then click Next.
In the next wizard screen, to import data from the selected relational database, you can choose to either select from a list of tables and views or write a custom SQL query to retrieve the data. For this exercise, select the Select From A List Of Tables And Views To Choose The Data To Import option, as shown in the following illustration.
The Select Tables And Views page shows a list of tables. Select the check boxes next to the DimChannel, DimDate, DimGeography, DimProduct, DimProductCategory, DimProductSubcategory, DimPromotion, DimStore, FactInventory, and FactSales tables. You can see some of these tables selected in the following illustration.
On the Select Tables And Views page, you can also click either Select Related Tables or Preview & Filter. Clicking Select Related Tables selects tables that have relationships with the table or tables you have already selected; clicking Preview & Filter displays the first 50 rows of the currently selected table, looking similar to the following illustration. This view can be useful when you want to verify that a selected table is indeed the table you want to import. Selecting or deselecting the check boxes in the header row lets you select or exclude columns from this view.
Close the Preview page shown in the preceding figure, if you opened it, and then, in the Select Tables And Views dialog box, click Finish.
At this point, PowerPivot for Excel sends a command to the VertiPaq engine to create the PowerPivot data store, which is an Analysis Services in-memory database, retrieving the data you specified from the relational SQL Server data source you selected.
After the import operation starts, you can see the quantity of rows imported as the VertiPaq engine processes the tables. PowerPivot for Excel also tries to import any existing relationships between the tables being imported.
When the operation completes, on the Import Summary dialog box, click Close.


Notice that the PowerPivot window fills with the data you imported, as shown in the following illustration. The tables are organized as separate tabs, each accessible from the bottom of the window just like a typical Excel worksheet.

Choose one of the sheets—that is, one of the tables—to see all its columns and rows. At the bottom of the PowerPivot for Excel window is a Records field, which shows you how many rows that particular table has loaded. The FactSales table, for example, has more than three million rows—and all that data is available. You can scroll through it seamlessly, thanks to the VertiPaq engine, which uses a columnar technology to achieve high compression rates and processing power. When you scroll, apply filters, or perform calculations, PowerPivot for Excel sends queries in the background (known as tabular queries) to the VertiPaq engine, which retrieves the results amazingly fast.
Released in October 2010, Windows Azure Marketplace DataMarket (referenced hereafter as Azure DataMarket, for simplicity) is a service with which developers and information workers can easily discover, purchase, and manage premium data subscriptions (some of these data subscriptions are free; some are not) that reside in the Windows Azure platform. By bringing data with a wide range of content from authoritative commercial and public sources together into a single location, Azure DataMarket is perfect for PowerPivot users who want to enrich their applications in innovative ways.
To accommodate this new service from Microsoft, PowerPivot for Excel was updated from its first version—partly to provide users with a better experience when using Azure DataMarket and partly to optimize connections to the Azure DataMarket data feeds. The changes implemented are relatively small but should make a significant difference for those of you who plan to work with data from Azure DataMarket data feeds.
Note
Even if you do not have the updated version of PowerPivot installed, you can still connect and use the Azure DataMarket data feeds by using the standard data feed user interface. It might just take a little more effort to use the feeds that way.
Before you can start using Azure DataMarket, you must have a registered account. You can register your Windows Live ID account for free here: https://datamarket.azure.com/register/ .
To import data from Azure DataMarket, you can perform the steps in the next exercise.
On the Home tab of the PowerPivot for Excel window, click From Azure DataMarket, as shown in the following illustration.
On the Connect To An Azure DataMarket Dataset page of the Table Import Wizard, fill in the Azure DataMarket Dataset URL field with the address for the dataset that you want to import data from. In the Security Settings box, copy your account key into the Account Key field. (Your account key is available at the My Data page, in the Account Keys section at the Azure DataMarket website, when you subscribe to a dataset.) For illustrational purposes, we will import data from the 2006–2008 Crime in the United States (Data.gov) dataset at https://api.datamarket.azure.com/Data.ashx/data.gov/Crimes/ , as shown in the following illustration. The Crime dataset subscription is free of charge.
Alternatively, from the Azure DataMarket Dataset webpage, you can elect to open a query in PowerPivot (from a drop-down menu). A dialog box appears that asks you to open or save the query. If you choose to save, PowerPivot saves an Atom file at a location you specify. The Atom file contains the query information; you can use it in the Azure DataMarket Dataset URL field in the Table Import Wizard by clicking Browse and navigating to the file’s location.
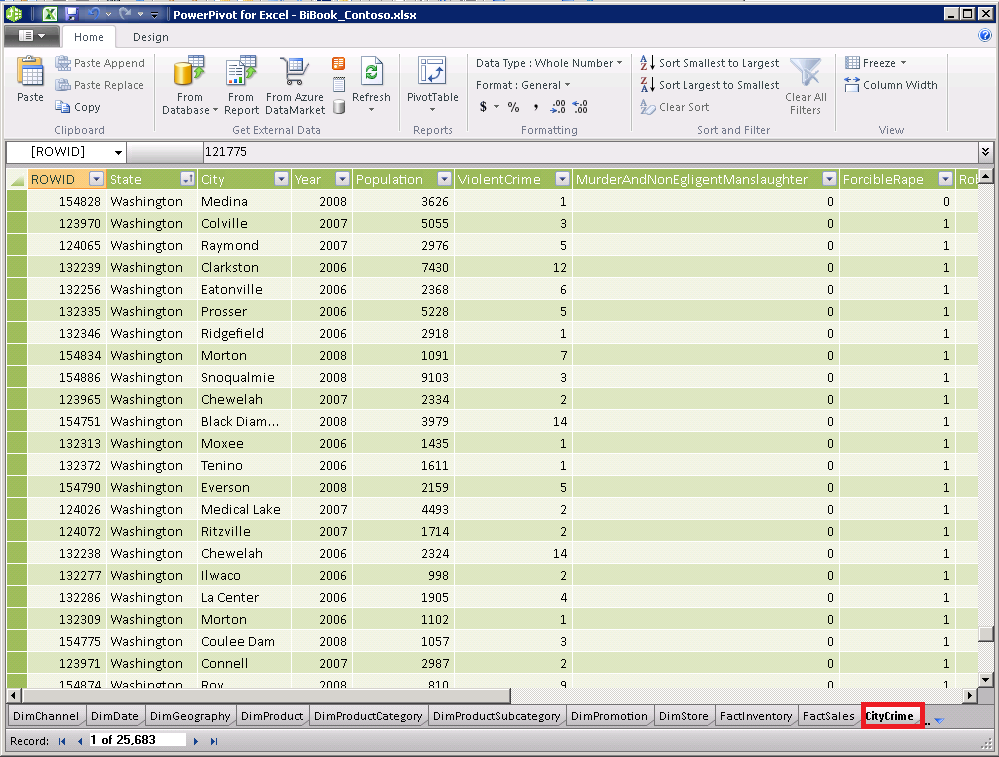
PowerPivot imports the data from the Crime dataset and makes it available on a new tab in the PowerPivot window, as shown in the following illustration.


You can also import data into PowerPivot for Excel by pasting it from the clipboard. PowerPivot can use any data that is in a tabular format, which includes tables copied from a webpage. When you click Paste on the Home tab of the PowerPivot window, the Paste Preview dialog box opens, as shown in the following illustration. Paste Preview lets you view the data that will be copied as a new table. While still in Paste Preview, you can choose to use the values of first row as the columns headers.

After importing some data, you can start to enhance the data and get it ready for analysis. This section explores a few basic PowerPivot for Excel 2010 features, such as creating relationships and calculations with DAX.
Note
The subjects of DAX and data analysis with PowerPivot are large topics and deserve their own book. A full explanation is out of scope for this book, but you can find a more complete and in-depth view of DAX and PowerPivot for Excel features in the book PowerPivot for Excel 2010: Give Your Data Meaning (Redmond: Microsoft Press, 2010), by Marco Russo and Alberto Ferrari.
PowerPivot for Excel was designed to look and work as much like Excel as possible, so if you’re familiar with Excel, you will find actions such as sorting and filtering data and moving and renaming columns in the PowerPivot windows both natural and intuitive. You might also notice some differences. For example, the Design tab in the PowerPivot window provides more operations that you can perform on the table, such as refreshing the data in the table (or all tables), and hiding, adding or deleting columns, as shown in the following illustration. You can also create and manage relationships between tables, as discussed in the next section.

A relationship is an association or a connection between two tables. When you create a relationship between two tables, you are defining a way to navigate from one table to another by connecting a single record in one table to one or more records in another table. Relationships are a fundamental concept of relational databases—but not a concept available in Excel. This is one of the key differences between PowerPivot workbooks and regular Excel workbooks: Excel does not offer a mechanism to relate different tables.
Depending on the data source used to acquire your data, PowerPivot can automatically get relationships (and related tables) for you. For example, if you connect to a relational database such as a SQL Server, PowerPivot can import related tables for you from that database. When PowerPivot cannot retrieve table relationships automatically (as when importing data from a Data Feed or a text file), PowerPivot for Excel provides ways for you to define them.
You can create a relationship between two tables as follows: Select the column in the table that contains the “many” side, and then right-click and select Create Relationship from the context menu. Also, you can define a relationship by selecting the column you want to use and clicking Create Relationship (see the preceding illustration) in the Relationships group on the Design tab of the PowerPivot window, as shown in the following illustration. This example creates a relationship between tables imported from Azure DataMarket on the web and data imported from a relational database.

DAX formulas are designed to be as similar as possible to Excel formulas. Just as in Excel, all DAX formulas begin with an assignment operator, such as an equals sign (=), but DAX works with tables (as in a database) rather than with cells arranged in a tabular fashion. The main difference between Excel formulas and DAX is that DAX never uses cell coordinates (B2, C3, and so on). Also, DAX does not work with cell ranges. To work with ranges, you can use DAX functions to apply filters to narrow down the data you are interested in.
Here is a simple example of a DAX formula:
=FactSales[SalesAmount]-FactSales[TotalCost]
This calculation defines the Margin column in the sample workbook by subtracting the TotalCost column from the SalesAmount column, which yields a profit-margin value.
PowerPivot evaluates the DAX expression for each row of the FactSales table and populates the FactSales[Margin] column with the result, as shown in the following illustration.

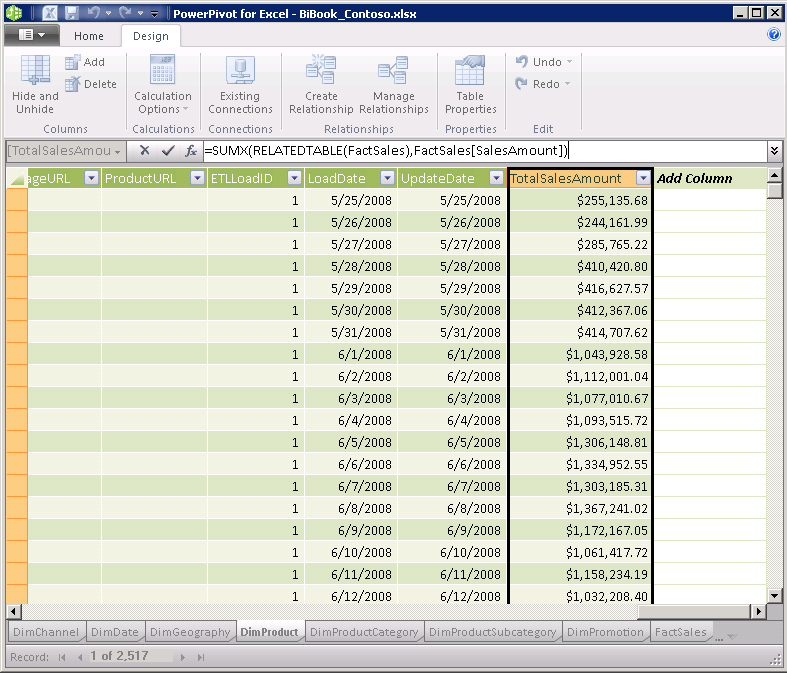
Here’s a slightly more complex DAX formula:
=SUMX(RELATEDTABLE(FactSales),FactSales[SalesAmount])
In the preceding formula, the DAX expression calculates a value for each row from the DimProduct table by scanning the rows in the FactSales for the current row, retrieving the SalesAmount, and performing a summation of the SalesAmount. In other words, this DAX formula filters the FactSales table that corrensponds to the product of the current row at DimProduct table and aggregates the SalesAmount value, as shown in the following illustration.
Appendix B, provides a list of all available DAX functions along with a short description of each. For more information about DAX, see the “Data Analysis Expressions in PowerPivot for Excel 2010” white paper and sample workbook available for download at http://www.microsoft.com/downloads/en/details.aspx?displaylang=en&FamilyID=1ae63bfb-c303-44e3-ae44-7413d499495d .
You can consider PivotTables and PivotCharts as the two features that make Excel an excellent BI client tool. Using these features, you can analyze large amounts of data in a quick and easy way—and PowerPivot takes advantage of both features. PowerPivot provides different ways to insert various combinations of PivotTables and PivotCharts into a workbook. You can access these features from the PowerPivot window or from the PowerPivot tab on the Excel ribbon as shown, respectively, in the following illustrations.


The options in those two menus provide easy and convenient ways to insert a single PivotTable, a single PivotChart, or a combination of PivotTables and PivotCharts into a PowerPivot workbook.
A single PivotTable is the most basic configuration. The following illustration shows a new PowerPivot PivotTable before adding any fields. Notice that, for the PowerPivot PivotTable and for the PowerPivot PivotCharts (in the succeeding illustration), the PowerPivot field list is shown instead of the standard Excel field list.

Selecting PivotChart inserts a single PivotChart in your workbook, as shown in the following illustration. PowerPivot also creates a PivotTable on a separate sheet that contains the data that the PivotChart uses. This additional sheet’s name follows a standard naming convention: “Data for Sheet <x> Chart<y>.” For this example, we inserted a PivotChart named Chart1 in the Sheet2 sheet, which created a new sheet named “Data for Sheet2 Chart1.” (See the following illustration.) This naming scheme can help you browse from the PivotTable that contains the support data back to the PivotChart (as long as you neither rename the PivotChart’s sheet nor move the PivotChart to a different sheet).

The following illustration shows a PowerPivot PivotChart displaying Total Sales By Country from the Contoso database.

After creating a PowerPivot workbook by using PowerPivot for Excel, you’ll likely want to share it with others in your department or organization. Your workbook becomes much more useful when others can use it.
In Excel, click the File tab on the Excel ribbon.
Click Save & Send, as shown in the following illustration.
In the Save & Send section, click Save To SharePoint.

If you are publishing to a SharePoint site that has PowerPivot for SharePoint installed, you should publish it to the PowerPivot Gallery. The PowerPivot Gallery is a special PowerPivot-enabled SharePoint document library with additional functionality that goes above and beyond the features available in standard SharePoint 2010 document libraries.
PowerPivot Gallery is a visually rich SharePoint document library installed with PowerPivot for SharePoint. Its enhanced visual presentation aids in interpreting the data in each sheet of PowerPivot workbooks in the Gallery, as shown in the following illustration.

Clicking a specific sheet in a PowerPivot workbook opens the workbook in the browser, where you can analyze it further, as shown in the following illustration.

PowerPivot for SharePoint provides a data-refresh feature that can automatically retrieve updated data from the external data sources you used to build the workbook originally. Any PowerPivot workbook owner can schedule data refresh for workbooks saved to the PowerPivot Gallery or to any other PowerPivot-enabled SharePoint document library. The following illustration shows the drop-down menu that opens the data-refresh schedule page.

PowerPivot Gallery offers another way to get to the data-refresh feature: To schedule a data refresh through the PowerPivot Gallery, SharePoint users who have Contributor permission can click the Calendar icon shown for each workbook in a PowerPivot Gallery.
Note
When a user does not have sufficient privileges on the workbook, the Calendar icon is not available on the page.
The following illustration shows the icon that opens the data-refresh schedule definition page.

The following illustration shows the initial view of the schedule definition page. To start setting up a data-refresh schedule, click Enable. This makes the page active so that you can fill in the values you want to use.

The Manage Data Refresh page has six sections, as described in the following table.
|
Section |
General description |
|---|---|
|
Data Refresh |
Enable or disable a data-refresh schedule. |
|
Schedule Details |
Define the frequency and timing details of a data refresh. |
|
Earliest Start Time |
Specify the earliest start time for a data refresh. |
|
E-mail Notifications |
Specify email addresses of the users to be notified in the event of data-refresh failures. |
|
Credentials |
Provide the required credentials for refreshing data on your behalf. |
|
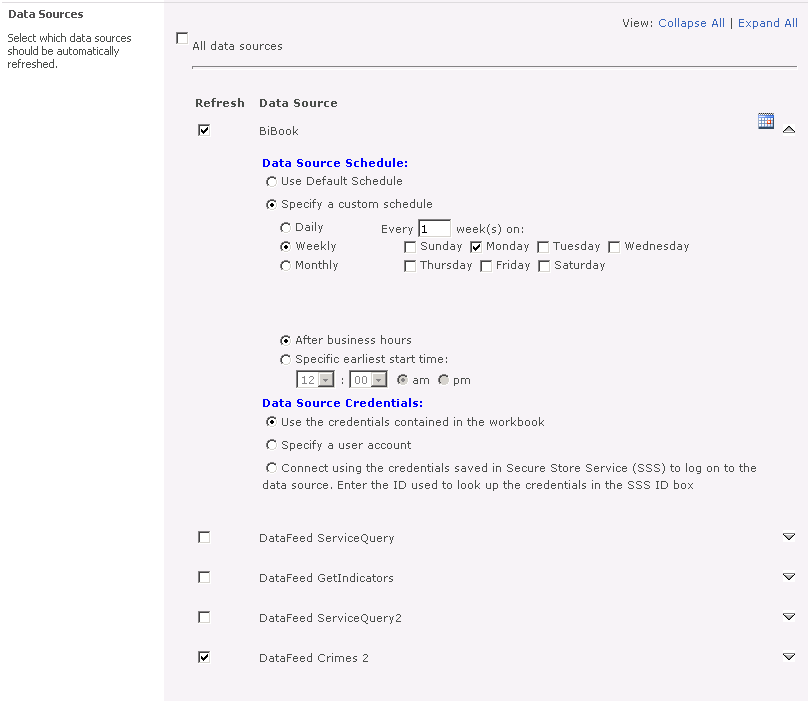
Data Sources |
Select which data sources should be automatically refreshed. You can also use this section to create custom schedules that vary for each data source or to specify credentials for connecting to the data source. |
To enable or disable a data-refresh schedule, select or clear the Enable check box on the Manage Data Refresh page. When Enable is selected, you can edit all parts of the data-refresh schedule. When Enable is not selected, the page is read-only and you’re essentially freezing the data, meaning that after you click OK, subsequent data-refresh operations for that workbook cannot occur.
In the Schedule Details section, you can specify the frequency and timing details of the data refresh by choosing one of the following options:
Daily
Weekly
Monthly
Once
Using the Daily option, you can schedule a data refresh to occur every n day(s), every weekday, or on specific days of the week.
If you select the Also Refresh As Soon As Possible check box, data gets refreshed as soon as the server can process it. This refresh occurs in addition to the periodic data-refresh schedule and is available for periodic schedules only (that is, daily, weekly, and monthly schedules). Select this check box when you want to verify that the data refresh runs properly. For example, you might not know whether data credentials are configured correctly. This option provides a way to test the data refresh before its scheduled execution time. In short, checking the Also Refresh As Soon As Possible option refreshes the workbook as soon as possible once; subsequently, the workbook refreshes following your periodic schedule specification.

The Weekly option is for scheduling data refresh on a weekly basis, such as every n week(s) or on specific days of the week.

You can use the Monthly option data-refresh schedule to run either on a specific day of the month or on the first, second, third, or last specific day of the week every n month(s).

The Once option schedules a one-time data-refresh operation that runs as soon as the server can process the request. After the data refresh completes, the system disables this schedule. Notice that the Also Refresh As Soon As Possible check box is not available for this option.

In the Earliest Start Time section, you specify details about when you prefer data refresh to occur. You can enter a specific time before which data refresh should not start, or you can choose to refresh data after business hours. This page does not determine the time at which the data refresh actually starts; instead, the schedule is queued and processed based on available resources. For example, if the server is busy with on-demand queries (which take precedence over data refresh jobs), the server waits to refresh your data until those queries have been processed. You can also choose to run a data-refresh operation after business hours. The administrator of the PowerPivot Service Application for your organization determines the definition of “business hours.”

In this section of the page, you can specify email addresses for individuals or groups who should be notified when a data refresh fails. You can receive notifications of successful data-refresh operations through the regular SharePoint alerting system for email notification. (The basis of the alert would be a new file added to the target document library.)

PowerPivot for SharePoint uses the SharePoint Secure Store Service to store any credentials used in data refresh. In the Credentials section of the schedule page, the schedule owner can specify the Windows credentials that are used to refresh data on his or her behalf. Any data source that uses trusted or integrated security is refreshed using these credentials. For the data refresh to succeed, the selected credentials should have access to the data sources for this workbook. You can choose from one of the following options:
Use an account preconfigured by the administrator (the service application’s unattended data-refresh account).
Use a specific Windows user name and password.
Use a predefined Secure Store Service target application ID that stores the Windows credentials you want to use.
Both the PowerPivot unattended data-refresh account and the predefined Secure Store Service target application ID must be set up by a SharePoint administrator in Central Administration. Because these credentials are shared among all users, this option is typically used where additional credentials are required for data access. A good example is when all the data sources use SQL Server authentication (that is, the actual user names and passwords are on each data source). In this case, the unattended execution account can be a low permission service account. Due to the way data refresh uses Windows accounts, it is normally not a good idea to have the unattended execution account be someone’s primary user account, because anyone can impersonate that user if he or she accesses data by using a trusted connection.

A schedule owner can also choose to type the Windows user credentials to be used on the data refresh. These credentials are securely stored in SharePoint’s Secure Store Service.

The third option lets a schedule owner specify credentials previously saved in a Secure Store Service Target Application. To use this option, you must enter the Target Application ID used to look up the credentials in the Secure Store Service. The Target Application ID specified must be a group entry, and both the interactive user and the PowerPivot System service account must have read access.

Note
Setting up and maintaining Secure Store Service is outside the scope of this book. For more information about Secure Store Service, see the following TechNet and MSDN articles:
“Configure the Secure Store Service (SharePoint Server 2010)” at http://technet.microsoft.com/en-us/library/ee806866.aspx
“PowerPivot for SharePoint – Existing Farm Installation” at http://msdn.microsoft.com/en-us/library/gg144594.aspx
A workbook can have many data sources that have different characteristics. As shown in the following illustration, you can choose to create a data-refresh schedule using different options for each data source.

The schedule definition page provides options for choosing the data sources to be refreshed and when to refresh them. It also provides fields for specifying database credentials or other non-Windows credentials used on the database connection. You must select at least one data source to save the schedule. The data source’s credentials are not used for impersonation but are instead included on the connection string as UserName and Password. These credentials override those used on the connection string for the original data import.
As shown in the following illustration, different settings are available for each data source. You can specify a custom schedule data source, or you can use the general schedule specified for the workbook.
Note
The only modifiable elements in the connection string are the UserName and Password elements. To edit any of the other elements—for example, to change the source server name—you must download the workbook to your desktop, edit it using the PowerPivot Excel add-in, and then republish it to SharePoint.
The PowerPivot Management Dashboard provides administrators responsible for the server side of PowerPivot with the capabilities they need to understand usage patterns of the PowerPivot workbooks in SharePoint and to take appropriate actions. For example, the growing size of a particular workbook may indicate the need to acquire more memory. You can access the PowerPivot Management Dashboard by browsing to SharePoint’s Central Administration and then clicking General Application Settings, as shown in the following illustration.

The Dashboard page appears as shown in the following illustration.

The PowerPivot Management Dashboard can be broken down into the main areas (Web Parts) described in the following table.
|
Web Part |
Description |
|---|---|
|
Infrastructure—Server Health |
Provides information about infrastructure; it shows the CPU and memory usage for the PowerPivot Analysis Services service. It also contains a histogram of overall query response for the PowerPivot service application. |
|
Workbook Activity |
Provides a high-level representation of the number of users, the number of queries sent to a workbook, and the size of the workbook over time. |
|
Actions |
Allows an administrator to configure PowerPivot-specific settings within a SharePoint farm. |
|
Data Refresh |
Provides a breakdown of the recent activities and recent failures for PowerPivot data refresh in SharePoint. |
|
Reports |
Enables administrators to view source Excel workbooks and databases used by the PowerPivot Management Dashboard. |
This section of the PowerPivot Management Dashboard provides indicators of the server’s health. It does so through the following indicators:
Query Response Times
Average Instance CPU
Average Instance Memory
Activity
Performance
As shown in the following illustration, the Query Response Times view is the default view of the Server Health Web Part. The purpose of this chart is to provide a quick overview so that you can determine whether the majority of the queries are running as expected or whether they are running too slowly.

When query response time increases, you will want to determine which queries are running slowly, and why.
The following table summarizes the default query response time definitions. These definitions can be modified by selecting Central Administration | General Application Settings | PowerPivot | Configure Service Application Settings.
|
Category |
Definition (in milliseconds) |
|---|---|
|
Trivial |
0 < time < 500 |
|
Quick |
500 < time < 1000 |
|
Expected |
1000 < time < 3000 |
|
Long |
3000 < time < 10000 |
|
Exceeded |
>= 10000 |
Switching to the Average Instance CPU view in the Server Health Web Part shows the CPU load on the SharePoint Application Server that has PowerPivot installed, as shown in the following illustration.

The preceding illustration shows that for this SharePoint Application Server, CPU load is not an issue because, on average, it’s using less than one percent of the CPU’s capacity.
Memory can become a concern for your environment because the PowerPivot VertiPaq engine loads the workbook in memory. As the number of users and the size of their workbooks grow, they require an increasing portion of the server’s memory. Taking a quick look at the Average Instance Memory view, you can easily see when more memory is being used over time, as shown in the following illustration.

Although you can toggle between the Infrastructure—Server Health Activity and Performance views, you can get an even better view of this data by using the Workbook Activity and Server Health reports directly. To do that, click in either the Workbook Activity or the Server Health workbook located in the Reports area of the PowerPivot Management Dashboard. (See the second illustration in the section Monitoring with PowerPivot for SharePoint.)
This area contains two parts: a Chart section and a List section.

This Chart Web Part is a Silverlight control that displays a bubble chart. The chart’s axes represent the number of users and the number of queries sent to a workbook. A sliding bar indicates the date. As you move the pointer over each bubble, the name of the corresponding workbook and the number of users connected to that workbook display, along with the number of queries sent to the workbook. Also, as you move the date sliding bar, the bubble size indicates how the workbook has grown over time.

The PowerPivot data-refresh mechanism performs many activities in the background. In the PowerPivot Management Dashboard, you will find a section dedicated to reporting the recent data-refresh–related activities in the environment
As the name suggests, this Web Part shows recent data-refresh activity in the environment. It reports the most recent PowerPivot workbook data refreshes, along with the time each refresh completed and its duration, as shown in the following illustration.
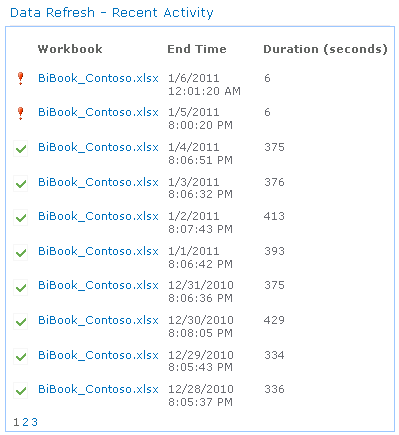
Clicking a workbook in the Recent Activity report redirects you to that workbook’s data-refresh history page, where you can find details about the failure. The following illustration shows the data-refresh history page for the BiBool_Contoso.xlsx workbook.


This chapter briefly introduces you to PowerPivot for Excel and PowerPivot for SharePoint. It provides guidance on creating a PowerPivot workbook, importing data from various data sources, and mashing them up using DAX. This chapter also demonstrates how to publish a PowerPivot workbook to SharePoint and how to schedule data refreshes, and it explains how IT professionals can manage PowerPivot for SharePoint by using the PowerPivot Management Dashboard. To learn more about PowerPivot, you can look for books dedicated to PowerPivot for Excel and to PowerPivot for SharePoint. You can also find more information by referencing the following resources:
The official MSDN blog at http://blogs.msdn.com/powerpivot .
Rob Collie’s blog at http://www.powerpivotpro.com (for PowerPivot for Excel). Rob Collie was a Program Manager in the Analysis Services team that worked on PowerPivot for Excel.
Dave Wickert’s blog at http://www.powerpivotgeek.com (for PowerPivot for SharePoint). Dave Wickert is a Program Manager on the Analysis Services team, working on PowerPivot for SharePoint.