
Lesson 12
Debugging Code
A bug is a programming error that makes a program fail to produce the correct result. The program might crash, display incorrect data, or do something completely unexpected such as delete the wrong file.
In this lesson you learn how to use the excellent debugging tools provided by Visual Studio's IDE to find bugs in C#. You learn about different kinds of bugs and you get to practice debugging techniques on some buggy examples that you can download from the book's website.
Deferred Techniques
Unfortunately, at this point in the book you don't know enough about writing code to be able to understand and fix certain kinds of bugs. For example, a program crashes if it tries to access an array entry that is outside of the array, but you won't learn about arrays until Lesson 16.
So why does this lesson cover debugging when you don't even know all of the techniques you need to cause and fix certain kinds of bugs? It makes sense for two reasons.
First, the previous lesson was the first part of the book where you were likely to encounter bugs. Whenever I teach beginning programming, students start seeing bugs as soon as they write code that performs calculations like those covered in Lesson 11. These kinds of bugs are easy to fix if you know just a little bit about debugging, but they can be extremely frustrating if you don't.
Second, it turns out that you don't need to know more advanced techniques to learn simple debugging. Once you learn how to track down simple bugs, you can use the same techniques to find more advanced bugs. (If you learn to swim in 3 feet of water, you can later use the same techniques to swim in 10 feet or 100 feet of water.)
Later, when you know more about C# programming and can create more advanced bugs, that same knowledge will help you fix those bugs. When you know enough to have array indexing errors, you'll also know enough to fix them.
Debugging Then and Now
Back in the bad old days, programmers often fixed bugs by staring hard at the code, making a few test changes, and then running the program again to see what happened. This trial-and-error approach could be extremely slow because the programmer didn't really know exactly what was going on inside the code. If the programmer didn't have a good understanding of what was really happening, the test changes often didn't help and may have even made the problem worse.
Visual Studio's IDE provides excellent tools for debugging code. In particular, it lets you stop a program while it's running and see what it's doing. It lets you follow the program as it executes its code one line at a time, look at variable values, and even change those values while the program is still running.
The following sections describe some of Visual Studio's most useful debugging tools.
Setting Breakpoints
A breakpoint stops code execution at a particular statement. To set a breakpoint, open the Code Editor and click the gray margin to the left of the line of code where you want to stop. Alternatively, you can place the cursor on the line and press F9.
The IDE indicates the breakpoint by displaying a red circle in the left margin and highlighting the line of code in red. Figure 12.1 shows a breakpoint set on the following line of code:
decimal grandTotal = subtotal + salesTax + shipping;
If you run the program now, execution stops when it reaches that line. You can then study the code to see what it's doing.
The debugger provides an edit-and-continue feature that lets you modify a stopped program's code. You can add new statements, remove existing statements, declare new variables, and so forth. Unfortunately, the debugger gets confused if you make certain changes, and you'll have to restart your program. But sometimes you can make small changes without restarting.
To remove a breakpoint, click the red breakpoint circle or click the line and press F9 again.
Reading Variables
It's easy to read a variable's value while execution is stopped. Simply hover the mouse over a variable and its value appears in a popup window.
For example, consider the order summary program shown in Figure 12.2. The program is supposed to add a subtotal, 9% sales tax, and shipping costs to get a grand total. You don't have to be Neil deGrasse Tyson to realize that something's wrong in Figure 12.2. If you're really paying a total of $204.50 for a $19.95 purchase, you need to find a new place to shop.

To debug this program, you could place a breakpoint on a line of code near where you know the bug occurs. For example, the line of code containing the breakpoint in Figure 12.1 calculates the grand total. Because the total displayed in Figure 12.2 is wrong, this seems like a good place to begin the bug hunt. (You can download the Sales Tax Calculator program from the book's website and follow along if you like.)
When the code is stopped, you can hover the mouse over a variable to learn its value. If you hover the mouse over the variables in that line of code, you'll find that subTotal is 19.95 (correct), shipping is 5 (correct), and salesTax is 179.55 (very much incorrect). Figure 12.3 shows the mouse hovering over the salesTax variable to display its value.

Now that you know the bug is lurking in the variable salesTax, you can hover the mouse over other variables to see how that value was calculated. If you hover the mouse over the variables in the previous line of code, you'll find that subTotal is 19.95 (still correct) and taxRate is 9.
You may need to think about that for a bit to realize what's going wrong. To apply a tax rate such as 9%, you divide by 100 and then multiply. In this case, taxRate should be 0.09, not 9.
Having figured out the problem, you can stop the program by opening the Debug menu and selecting the Stop Debugging command, by clicking the Stop Debugging button on the toolbar, or by pressing Shift+F5.
Now you can fix the code and run the program again to see if it works. The following line shows the incorrect line of code (I scrolled it out of view in Figure 12.3 so it wouldn't be a complete giveaway):
const decimal taxRate = 9M;When you run the program again, you should get the correct sales tax ($1.80) and grand total ($26.75). In a more complicated program, you would need to perform a lot more tests to make sure the program behaved properly for different inputs, including weird ones such as when the user enters “ten dollars” for the subtotal or leaves the shipping cost blank. This example isn't robust enough to handle those problems.
Stepping Through Code
Once you've stopped the code at a breakpoint, you can step through the execution one statement at a time to see what happens. The Debug menu provides four commands that control execution:
- Continue (F5)—Makes the program continue running until it finishes or it reaches another breakpoint. Use this to run the program normally after you're done looking at the code.
- Step Into (F11)—Makes the program execute the current statement. If that statement calls a method, execution stops inside that method so you can see how it works.
- Step Over (F10)—Makes the program execute the current statement. If that statement calls another piece of executable code, the program runs that code and returns without stopping inside that code (unless there's a breakpoint somewhere inside that code).
- Step Out (Shift+F11)—Makes the program run the current routine until it finishes and returns to the calling routine (unless it hits another breakpoint first).
In addition to using the Debug menu or shortcut keys, you can invoke these commands from the toolbar.
Normally the program steps through its statements in order, but there is a way to change the order if you feel the need. Right-click the line that you want the code to execute next and select Set Next Statement from the context menu. Alternatively, you can place the cursor on the line and press Ctrl+Shift+F10. When you let the program continue, it starts executing from this line.
Setting the next statement to execute is useful for replaying history to see where an error occurred, re-executing a line after you change a variable's value (described in the “Using the Immediate Window” section later in this lesson), or to jump forward to skip some code.
Note that you can jump to only certain lines of code. For example, you can't jump to a comment or other line of code that doesn't actually do anything (you can't set a breakpoint there either), you can't jump to a different method, you can't jump at all if an error has just occurred, you can't jump to a variable declaration unless it also initializes the variable, and so forth. C# does its best, but it has its limits.
Using Watches
Sometimes you may want to check a variable's value frequently as you step through the code one line at a time. In that case, pausing between steps to hover over a variable could slow you down, particularly if you have a lot of code to step through.
To make monitoring a variable easier, the debugger provides watches. A watch displays a variable's value whenever the program stops.
To create a watch, break execution, right-click a variable, and select Add Watch from the context menu. The bottom of Figure 12.4 shows a watch set on the variable subtotal. Each time the program executes a line of code and stops, the watch updates to display the variable's current value.

The Watch window also highlights variables that have just changed in red. If you're tracking a lot of watches, this makes it easy to find the values that have just changed.
Using the Immediate Window
While the program is stopped, the Immediate window lets you execute simple commands. The four most useful commands that this window supports let you view variable values, evaluate expressions, set variable values, and call methods.
To view a variable's value, simply type the variable's name and press Enter. (Optionally, you can type a question mark in front if it makes you feel more like you're asking a question.)
The following text shows the Immediate window after I typed in the name of the variable subtotal and pressed Enter:
subtotal
19.95
To evaluate an expression, simply type in the expression and press Enter. You can include literal values, variables, properties, constants, and just about anything else that you can normally include inside an expression in the code.
The following text shows the Immediate window after I typed an expression and pressed Enter:
taxRate * subtotal
179.55
To set a variable's value, simply type the variable's name, an equals sign, and the value that you want to give it. The new value can be a literal value or it can be the result of an expression. After you press Enter, the Immediate window evaluates whatever is on the right of the equals sign, saves it in the variable, and then displays the variable's new value.
The following text shows the Immediate window after I typed a statement to give the grandTotal variable a new value and pressed Enter:
grandTotal = subtotal + salesTax
199.50
Finally, to call a method, simply type the method call into the Immediate window and press Enter. Don't forget to add parentheses to the method call even if the method takes no parameters. The Immediate window calls the method and displays any returned result. If the method has no return value, the Immediate window displays “Expression has been evaluated and has no value.”
The following text shows the Immediate window after I executed the grandTotalTextBox's Clear method:
grandTotalTextBox.Clear()
Expression has been evaluated and has no valueTry It
If you look closely at Figure 12.5, you'll see that this program has a serious problem. One tofu dinner at $13.95 each probably shouldn't add up to $142.65. If you look a little more closely, you'll also see that the grand total doesn't add up properly.
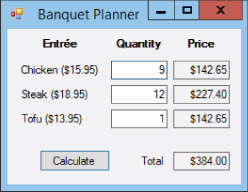
In this Try It, you debug this program. You set breakpoints and use the debugger to evaluate variable values to figure out where the code is going wrong.
Lesson Requirements
In this lesson, you:
- Use the debugger to fix this program. To follow along in the debugger, download this lesson's material from the book's website and open the “Try It 12” solution.
- Run the program and experiment with it for a bit to see what seems to work and what seems to be broken. This should give you an idea of where the problem may lie.
- Set a breakpoint in the code near where you think there might be a problem. In this case, the tofu dinner cost calculation is wrong so you might set a breakpoint on this line:
decimal priceTofu = tofuCost * numTofu; - Run the program so it stops at that breakpoint. Hover the mouse over different variables to see whether their values make sense.
- Step through the code, watching each line closely to see what's wrong.
- Fix the error.
- Run the program again and test it to make sure the change you made works. Try setting two of the quantities to 0 and the third to 1 to see if the program can correctly calculate the nonzero value.
- Repeat these steps until you can't find any more problems.
Step-by-Step
The first two lesson requirements for this Try It are fairly straightforward so they aren't repeated here. The following paragraphs discuss the solution to the mysterious problem, so if you want to try to debug the program yourself, do so before you read any further.
Ready? Let's go.
The following code shows how the program works. The bold line is where I set my breakpoint. If you stare at the code long enough, you'll probably find the bug, so don't look too closely or you'll spoil the surprise. Remember, the point is to practice using the debugger (which will be your only hope in more complicated programs), not to simply fix the program.
// Calculate the prices for each entree and the total price.
private void calculateButton_Click(object sender, EventArgs e)
{
    const decimal chickenCost = 15.85M;
    const decimal steakCost = 18.95M;
    const decimal tofuCost = 13.95M;
    // Get inputs.
    int numChicken = int.Parse(chickenQuantityTextBox.Text);
    int numSteak = int.Parse(steakQuantityTextBox.Text);
    int numTofu = int.Parse(tofuQuantityTextBox.Text);
    // Calculate results.
    decimal total = 0;
    decimal priceChicken = chickenCost * numChicken;
    total += priceChicken;
    decimal priceSteak = steakCost * numSteak;
    total += priceSteak;
    decimal priceTofu = tofuCost * numTofu;
    total += priceTofu;
    // Display results.
    chickenPriceTextBox.Text = priceChicken.ToString("C");
    steakPriceTextBox.Text = priceSteak.ToString("C");
    tofuPriceTextBox.Text = priceChicken.ToString("C");
    totalTextBox.Text = total.ToString("C");
}- Run the program so it stops at that breakpoint. Hover the mouse over different variables to see whether they look like they make sense.
- If you run to the breakpoint and hover the mouse over the variables, you'll find that most of them make sense; the values
numChicken = 9,priceChicken = 142.65, and so forth.
- If you run to the breakpoint and hover the mouse over the variables, you'll find that most of them make sense; the values
- Step through the code, watching each line closely to see what's wrong.
- While the program is stopped on the breakpoint, the variable
priceTofuhas value0because the code hasn't yet executed the line that sets its value. Press F10 to step over that line and you'll see thatpriceTofuis13.95as it should be. So far, you haven't found the bug.If you continue stepping through the code, watching each line carefully, you'll eventually see the problem in this line:
tofuPriceTextBox.Text = priceChicken.ToString("C");Here the code is making the tofu price
TextBoxdisplay the valuepriceChicken!
- While the program is stopped on the breakpoint, the variable
- Fix the error.
- This bug is easy to fix. Simply change the offending line to this:
tofuPriceTextBox.Text = priceTofu.ToString("C");
- This bug is easy to fix. Simply change the offending line to this:
- Run the program again and test it to make sure the change you made works. Try setting two of the quantities to 0 and the third to 1 to see if the program can correctly calculate the nonzero value.
- If you run the program again, all should initially look fine. If you reproduce some calculations by hand, however, you may find a small discrepancy in the chicken prices.
- You can see the problem more easily if you set the quantities of steak and tofu to 0 and the quantity of chicken to 1. Then the program calculates that the price of one chicken dinner (at $15.95 each) is $15.85.
- If the program still has problems, run through these steps again.
- Having found another bug, run through the debugging process again. Set a breakpoint on the line that calculates
priceChickenand hover over the variables to see if their values make sense.If you're paying attention, you'll see that the value of the constant
costChickenis15.85, not15.95as it should be. - Fix the constant declaration and test the program again.
- Having found another bug, run through the debugging process again. Set a breakpoint on the line that calculates
Exercises
Putting debugging exercises in a book can be a bit strange. If the book includes the code, you can stare at it until you see the bugs without using the debugger, and that would defeat the purpose.
For that reason, this section only describes the programs containing the bugs and you'll have to download the buggy programs from the book's website at www.wrox.com/go/csharp24hourtrainer. The corrected versions are named after their exercises, for example, “Exercise 12-1 Fixed.” Modified lines are marked with comments.
- Debug the Temperature Converter program shown in Figure 12.6. (Hint: 0° Celsius = 32° Fahrenheit and 100° Celsius = 212° Fahrenheit.)

- Debug the Distance Converter program shown in Figure 12.7. (After you fix this one, notice that using constants instead of magic numbers would make fixing these bugs easier and might have avoided them from the start. Also note again that duplicated code is a bad thing. You learn how to fix that in Lesson 20.)

- The Picture Resizer program is supposed to zoom in on a picture when you adjust its
TrackBar. Unfortunately, when you move theTrackBar, the picture seems to shrink and move to a new location. Debug the program. - Debug the Tax Form program, which performs a fictitious tax calculation based on a real one. It's an ugly little program, but it's probably the most realistic one in this lesson. (Hint: For the program's initial inputs, the tax due should be $290.00.)
- The Play Tone program is supposed to let the user play tones between 1000 Hz and 10,000 Hz for durations between 0.1 and 2.0 seconds. Unfortunately, for durations of 1.0 seconds or longer, the program plays a short click, and for durations under 1.0 seconds the program crashes. Download and debug the program.
- [Games] When you scroll the Orbit program's scrollbar from 0 to 359 degrees, the program moves an image of the Earth around an image of the sun. Unfortunately, the Earth jumps all over the place and it sometimes falls off the bottom and right edges of the form. Download and debug the program.
- [Games] The Satellite program uses a
Timerto make a picture of a satellite orbit the Earth. Unfortunately, the satellite sometimes moves off the bottom of the form. Download and debug the program. - [Games, WPF] The Rotate Image program lets the user load and rotate an image. (The code shows how to load an image at run time and prevent WPF from resizing it, so it's worth looking at for that alone.) Unfortunately, when the user changes the slider's value from 0 to 359 degrees, the image rotates only a tiny amount. Download and debug the program.
- [Graphics] The Draw Star program is supposed to draw a five-pointed star. (This book doesn't have enough room to say a lot about drawing graphics, but this example can help you get started.) Unfortunately, the program draws an upside-down pentagon. Download and debug the program.
- The Equal Shares program takes as inputs a money amount and a number of people. It then calculates the amount of money you should give each person to divide the money evenly. Unfortunately, the program crashes. Download and debug the program so it doesn't crash and so it displays the shares as a currency value.
- The Interest Calculator program uses the formula F = P * (1 + R)N to calculate the future value of a savings account where F is the future value, P is the initial principle, R is the annual interest rate, and N is the number of years. Unfortunately, the program has two problems. First, it won't compile because of some data type errors. Second, once you get it to compile, it indicates that a $1,000 investment at 5% interest for 10 years ends with a total value of more than $60 billion. (If you know of an investment that can turn my $1,000 into $60 billion in 10 years, please let me know!) Download and debug the program.
- In finance, the Rule of 72 lets you approximate the number of years it takes to double an investment at a particular interest rate. If the annual interest rate is R, then the rule says it will take approximately T = 72 / R years to double an investment. (The Rule of 70 and the Rule of 69.3 are similar except they use values other than 72. Different versions are closest for different interest rates.)
The exact formula for calculating doubling time is T = Ln(2) / Ln(1 + R). The advantage of the Rules is that you can approximate them in your head. (I would have a harder time dividing into 69.3 than 70 or 72, but at least you can divide into 69.3 with a simple accounting calculator that doesn't do logarithms.)
The Doubling Time program takes as input an interest rate and calculates the results of the Rules of 72, 70, and 69.3, plus the exact formula. The results for a 6% interest rate are 12.00, 11.67, 115.50, and 0.36 years, respectively. Download and debug the program.