
Chapter 12
Protocol Analyzer Operation and Troubleshooting
In this chapter, you will learn about the following:
- Understanding Protocol Analyzers
- Capture Adapters
- Analyzer placement
- Protocol Analyzer Features
- Channel selection and scanning
- Protocol decodes
- Peer map functions
- Conversation analysis
- Filtering: capture and display
- Expert functions
- Performance analysis
- Reporting capabilities
- Protocol Analysis Operation
- VoWiFi analysis using a protocol analyzer
- Multiple-channel protocol analysis using multiple adapters and aggregation software
- Roaming analysis
- Distributed Protocol analysis and remote packet capture
- Wired Protocol analysis for WLAN troubleshooting
- Wired and Wireless Analysis used together
- System Logs
- How system logs from wireless network equipment such as wireless controllers, access points and RADIUS servers, can aid the troubleshooting process.
Along with a spectrum analyzer (discussed in Chapter 11), a protocol analyzer is an essential tool for troubleshooting wireless networks. In this chapter, you will learn how wireless protocol analyzers place wireless network adapters into a special mode known as RF monitor mode. Wireless analyzers can be configured either to capture traffic on a fixed channel or to perform a channel scan. After configuring and starting a wireless capture, the many different features of a protocol analyzer will aid the network analyst in troubleshooting by helping them select the traffic of interest quickly and easily and point them in the right direction of a problem.
Expert systems can often be the starting place for analysis, highlighting network events that have been detected in the capture. These events can often lead to packets of one particular conversation being selected or a new more focused capture being started, filtering out any unnecessary traffic. Once the analyst has selected just the packets of interest, the final step in our troubleshooting methodology is to perform some sort of conversation analysis, looking for anything that is different from the expected protocol behavior.
For VoWiFi, a protocol analyzer can be an effective tool to troubleshoot problems. Many problems with VoWiFi networks result from poor roaming. This chapter will discuss the different features wireless analyzers provide to help troubleshoot VoWiFi and roaming issues. In particular, we will examine how the use of multichannel aggregation solves the problem of capturing a client’s roam between two access points operating on separate channels.
Distributed analysis allows for a system-wide approach to network analysis, allowing data to be collected across an entire facility, as well as at remote locations. This approach can save both time and money in resolving network problems, as well as allowing for a 24/7 Wireless Intrusion Protection System to operate around the entire organization.
Sometimes to successfully troubleshoot a problem, you need more information than can be obtained from an 802.11 wireless analyzer. In this case, you may need to look at the analysis of the wired network and at system log files.
Understanding Protocol Analyzers
Protocol analyzers provide network visibility into exactly what traffic is traversing a network. Protocol analyzers capture and store network packets, providing you with a protocol decode for each packet captured, which is a readable display showing the individual fields and values for each packet. The power of a protocol analyzer is that it allows you to see exactly which packets different network devices are transmitting and who they are being transmitted to. Protocol analysis is sometimes the only way to troubleshoot a difficult problem.
Many different software products can be classed as protocol analyzers. Table 12-1 lists some of the common 802.11 wireless protocol analyzers.
Table 12-1: Common protocol analyzers
| Vendor | Product |
| WildPackets | OmniPeek |
| Network Instruments | Observer |
| NetScout | Sniffer |
| Cace Technologies | AirPcap and Wireshark |
| TamoSoft | Commview for WiFi |
| Fluke | AirMagnet WiFi Analyzer |
| Motorola | AirDefense Mobile |
All these products are broadly classed as protocols analyzers because they capture and decode packets, but what they do with this packet information and how they display it depends upon their primary purposes and goals.
Products such as OmniPeek, Observer, Sniffer, and Wireshark started their life as wired Ethernet analyzers and since the publication of the 802.11 standard have adapted their product portfolio to include wireless LAN analysis. These products are your traditional network analysis and troubleshooting tools. Packet analysis, protocol decodes, fault analysis, and network forensics tend to be the strengths of these analyzers. These traditional analyzers also have an advantage of being able to capture traffic from the wired network as well. Why and when you might want to capture traffic from both the wireless and wired network simultaneously will be discussed in more detail later in the chapter.
Unlike the traditional protocol analyzers mentioned earlier, AirMagnet and AirDefense Mobile were created with the sole purpose of monitoring wireless communication and can only capture 802.11 wireless packets. Although at the heart of these products is packet capture and decoding, the default view is often an overview of the wireless environment, showing the overall security and health of your wireless environment. Because of the way these products operate, it might be more accurate to think of them as a portable Wireless Intrusion Detection System (WIDS). Interestingly, both of these vendors have also developed an enterprise-wide Wireless Intrusion Protection System (WIPS). WIPS will be discussed later in this chapter when discussing distributed wireless analysis.
All these products have more or less the same set of features as each other, but factors such as how these features are implemented, their usability, and what information is reported help us classify them. For example, you can get at the packet decodes in WIDS tools; however, it is not always so easy to filter and search them as it might be with your more traditional analyzers. Conversely, although traditional analyzers have many of the same security features such as rogue device detection, they are not always as easy to implement, and reporting is not always as clear as for portable WIDS solutions.
Although the vendors of these products may see each other as competitors, as wireless consultants, we have both a traditional analyzer and a mobile WIDS in our wireless tool kits and often find that they complement each other well. A mobile WIPS is ideal when trying to gain a quick but informative view of the wireless environment, alerting us to any areas of concern. When troubleshooting a known problem, the more traditional analyzers allow for fast and effective packet analysis. These two tools, along with a good spectrum analyzer, complete our analysis and troubleshooting tool kit and are sufficient for getting to the bottom of most wireless network problems.
Capture Adapters
Ethernet analyzers utilize a computer’s network interface card (NIC) by placing it into promiscuous mode, which instructs the card to pass all packets it receives up to the kernel instead of just the packets that are addressed to it. Promiscuous mode does not prevent normal network operation. For wireless network analysis, promiscuous mode is no longer good enough. This mode would require the wireless card to be associated to an access point and would not capture all wireless frames in the environment. By default, many wireless NIC drivers will not pass up 802.11 management and control frames and therefore would not be visible in the protocol analyzer. 802.11 wireless networks are half-duplex, and wireless NICs cannot listen (receive packets) while transmitting. Because of these issues, wireless analyzers place the NICs into a special mode called RF monitor mode; in this mode, the card becomes a passive monitoring device and cannot transmit, and therefore normal wireless network operation is disabled. In RF monitor mode, wireless NICs listen to all 802.11-encoded signals on the channel on which they are currently monitoring.
To be able to place a wireless NIC (adapter) in RF monitor mode, network analyzer vendors have to write a customized driver. Therefore, once you have chosen your network analyzer, you must also get a supported wireless adapter. Most vendors have a list of supported adapters on their websites, listing the wireless adapters for which they have written custom drivers. This list is normally limited by which wireless chip set vendors will release their Hardware Abstraction Layer (HAL) code to the analyzers’ vendors, allowing them to write the customized driver.
Having installed your chosen wireless analyzer, you must then install the customized driver for your wireless NIC. Some vendors provide driver installation wizards that step you through the process, as pictured in Figure 12-1. Other vendors require you to carry out the process manually by using the instructions available from their “getting started” guides.
Figure 12-1: CommView for WiFi driver installation wizard

It is important to understand that when you install the customized driver, you are completely replacing the wireless NIC’s driver. The new driver should only stop the wireless adapter from working as normal when capturing packets. Once the capture is stopped, the NIC should be reenabled, and normal operation should be restored.

Although installing an analyzer driver should not prevent normal wireless operation while not in RF monitor mode, the analyzer vendor’s main focus when writing its driver is wireless capture and not network connectivity. Unlike wireless adapter vendors, analyzer vendors are not as interested in keeping their drivers up-to-date with the latest features, as long as they can still capture traffic. When using your adapter for network connectivity, you will often find that wireless adapters using analysis drivers do not work as well and do not support all the features that would be available in the most up-to-date drivers supplied by the adapter’s vendor. It is therefore recommended that you use a separate adapter for wireless capture from the one you use for wireless network connectivity.
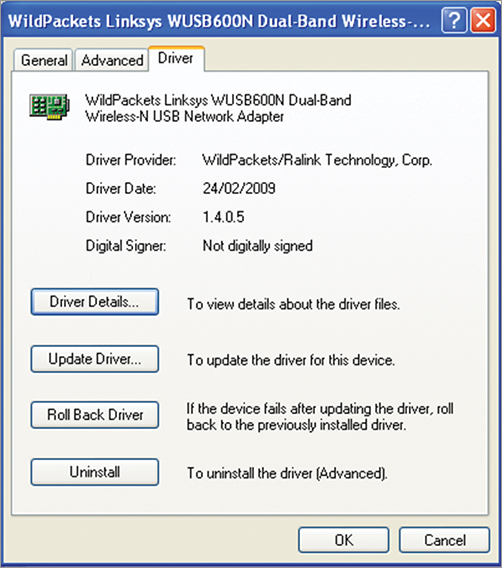
Figure 12-2 pictures the Driver tab of the wireless adapter’s Properties dialog box in Windows. From here you can roll back a driver if you want to uninstall the analysis driver and revert to the one supplied by adapter’s vendor. It is also from this dialog box that you can manually install a customized driver by clicking the Update Driver button. If you are ever unsure which driver you have installed, notice the Driver Provider information, as shown in the example in Figure 12-2.
Figure 12-2: Driver tab of the wireless adapter Properties dialog box
Some vendors produce their own dedicated wireless capture adapters, an example being Cace Technologies’ AirPcap adapter. The sole purpose of these devices is to be passive monitors. These adapters need no driver other than the one they are supplied with.
Analyzer Location
Identifying the correct location to place a network analyzer is an essential step in performing successful wireless network analysis. Incorrect placement of the wireless analyzer can lead to false conclusions being made. For example, if you are capturing traffic too far away from the source and destination, you might see a lot of corrupted frames; however, the intended recipient may not be experiencing any frame anomalies.
An access point acts as the central point in an 802.11 wireless network, and all traffic must flow through the access point. Therefore, placing the analyzer as close to the AP as possible will allow the wireless analyst to observe the RF environment from the same perspective as the AP. In this scenario, if the analyzer reports a corrupted frame, it is more than likely that the AP also saw the frame as corrupted.
When capturing packets with a low signal strength transmitted by a client from the edge of a BSS area, it is important to account for a difference in the quality of the receive radios and antennas used by the analyzer to those of the access point. If an access point has a better-quality RF receiver with a lower receiver sensitivity threshold, it could be receiving the packets correctly while the analyzer is reporting corrupted frames. In this scenario, you should look to see whether the access point acknowledges the corrupted frames. If the access point is sending acknowledgments for the frames, you can assume that it received them uncorrupted.
Placing the wireless analyzer as close to the AP as possible often proves to be the best solution. Although there are particular scenarios where this would not be the case, for example, when troubleshooting a problem that affects users in only one particular area, it would probably be best to monitor from the problem area.
Many different brands of wireless network analyzers are available, each with their own set of features. This section aims to outline some of the common features found in wireless analyzers; however, this section is not a minimum requirement list and by no means will all the features mentioned here be in all analyzers. Therefore, it is strongly recommend that you try an analyzer before you buy one. Most vendors provide evaluation and demo versions of their products, which allow you to discover which features they support and whether they can provide you with the required information.
Choosing the right options when configuring a new wireless packet capture is one of the main criteria for successful protocol analysis, because incorrect configuration can prevent the analyzer from capturing the required packets. The common capture options available will be discussed later in this section.
Following a structured troubleshooting methodology can help you perform effective network analysis. The following is an example of such a methodology:
1. Identify a suspect device, protocol, application, or conversation.
Like any sort of investigation, protocol analysis needs to start with some leads, and some of these might lead to dead ends, but sometimes they might lead to the problem. When troubleshooting as a result of a reported problem, you may already have some leads or suspects. For example, if the problem is that users cannot receive their emails, you can start your analysis with a suspect mail server and email protocol. However, sometimes you may not know of any particular problem but are performing proactive analysis to identity any problems before they impact the users. In this scenario, when you do not have any suspects, the analyzer’s expert system may be a good place to start your analysis. The expert system will identify applications and conversations where network problems and events have been identified.
2. Having identified a suspicious device, protocol, or conversation, you will then select just the traffic that is of interest. This can be done through the use of display and capture filters.
3. Once the traffic of interest has been selected, conversation analysis can take place. One of the goals of conversation analysis is to identify any unexpected behavior. This does of course mean that you have to know what the expected behavior is and understand how the protocols on your network should operate. Identifying unexpected behavior may involve analyzing protocol decodes.
The features mentioned in the previous methodology will be described in this section of the chapter. By using these features along with an understanding of the protocols described in this book, you can perform effective wireless network analysis.
Capture Options
When initiating a wireless capture, the analyst will be provided with several options. The options available will vary slightly from vendor to vendor, but there are a core set of options available in most products:
- Channel selection and scanning
- Buffer size
- Save to disk
- Packet slicing
These options will be discussed next in the following sections.
Channel Selection and Scanning
It is essential to understand that a wireless NIC can capture packets on only one channel at any given time, making channel selection the most important of the precapture options. Typically two options are available: fixed channel or channel scanning. Fixed channel analysis will lock the wireless NIC card onto one channel, enabling it to capture all 802.11-encoded traffic on the selected channel. When channel scanning is selected, the wireless NIC will capture traffic on all selected channels, spending a short amount of time on each channel before moving to the next one.
Fixed Channel
For troubleshooting a particular access point (AP) or station (STA), wireless scanning is not effective. This is because only the packets transmitted at the point in time when the analyzer was capturing on the AP’s or STA’s operating channel will be captured. The rest of the time the analyzer will be capturing packets on other channels, and therefore many packets from the required conversations will be missing. Fixed channel analysis is a much better choice when troubleshooting a particular AP or STA. Figure 12-3 pictures the wireless settings dialog box in Wireshark, showing the configuration for a fixed channel capture set to channel 1.
Figure 12-3: Wireshark channel selection

A 40 MHz, 802.11n channel can be selected by selecting the primary channel from the channel drop-down and selecting either a -1 or +1 channel offset to indicate that the secondary channel is either below or above the primary. How 40 MHz 802.11n channels are selected will vary across different vendors’ products.
Often an analyst will not know which channel a particular AP or STA is operating on and will therefore initially perform a channel scan in order to identify the correct channel.
Channel Scanning
Wireless scanning provides a good overview of the wireless environment, showing which wireless devices are transmitting on which channels and which security protocols they are using. Figure 12-4 shows the Channel Scanning Options dialog box in OmniPeek. From this dialog box, the channels required to be included in the scan can be selected. In a completely unknown environment, all channels will probably be selected in order to gain an understanding of the wireless environment. However, if you are scanning a known network, with the foreknowledge that all APs are configured on channels 1, 6, or 11, then only these channels need to be selected. This prevents the analyzer from wasting time monitoring channels that contain little or no traffic of interest to you.
Figure 12-4: OmniPeek’s Channel Scanning Options dialog box
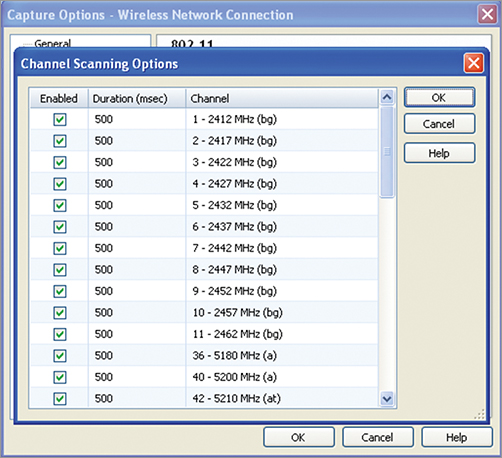
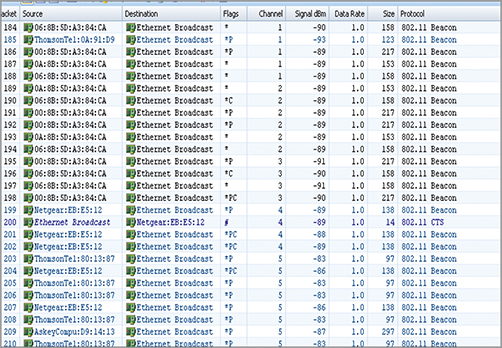
Another parameter that can be set when configuring channel scanning is the amount of time an analyzer will spend capturing on one particular channel before moving to the next. Figure 12-4 shows this duration set to the default value of 500 msec in OmniPeek. Figure 12-5 shows the packet’s view when channel scanning is enabled; notice how the analyzer jumps channels, capturing only a few packets per channel.
Country Code
Within a given frequency band, every country has its own regulations that govern which channels are allowed to be used. These regulatory authorities govern RF communication in terms of power, bandwidth and use; in the United States, for example, this is done by the Federal Communications Commission (FCC), and in the United Kingdom, it is regulated by OfCom. In the 2.4 GHz band, there are 11 channels available for use in the United States, but 13 are available in most countries across Europe.
Figure 12-5: Channel scan, packet view
After installing a customized analysis driver, you might find that you have the wrong number of channels available within your wireless analyzer. This is likely to be because the driver is configured with an incorrect country code. Often the country code or region can be changed in the advanced driver properties for the wireless adapter, as pictured in Figure 12-6.
Figure 12-6: Setting the country code/region

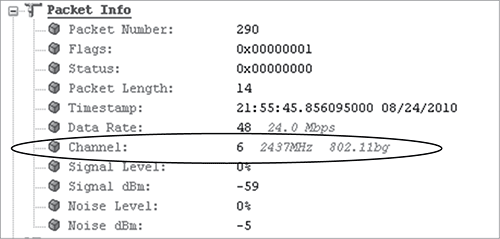
2.4 GHz Channel Overlap
Because the channels in the 2.4 GHz ISM band overlap, it is quite common to capture packets on channels other than the one on which they were originally transmitted. The channel a frame was captured on is displayed in the packet information at the top of every packet decode, as shown in Figure 12-7.
When performing a full channel scan in a multichannel architecture (MCA) environment that uses only channels 1, 6, and 11, do not be surprised when you capture packets on all 2.4 GHz channels.
Figure 12-7: Capture channel information
To determine the channel a frame was transmitted on, you need to start examining the packet decode. A 2.4 GHz AP advertises the channel the BSS is operating on in the Direct Sequence Parameter Set information element contained in the beacon and probe response frames, as shown in Figure 12-8. So, for beacon and probe response frames, the transmitted channel is right there in the packet. However, a bit more work is required if you are going to determine which channel other frame types were transmitted on, because the transmitted channel information is not recorded within the frame. The following three-step procedure can be used to determine the transmit channel of a 2.4 GHz packet:
1. Determine the BSSID from the packet in question. You can find this in the MAC header.
2. Find a beacon frame with a matching BBSID. This could be done using a filter or search.
3. Look up the BSS channel in the Direct Sequence Parameter Set information element.
Figure 12-8: Direct Sequence Parameter Set information element

This method works for all frames transmitted as part of a BSS. However, it is not possible to determine the channel of a probe request frame, because these frames are used for BSS discovery and are transmitted on all channels by stations performing active scanning. The BSSID in a probe response frame is set to the broadcast ID of all 1s.
Buffer Size
When configuring a wireless capture, as well as selecting your channel settings, another configuration option is the capture buffer size. The capture buffer is an allocation of memory (RAM) that will be reserved for your packet capture. This memory is used by your analyzer to store captured frames. Selecting the right buffer size will largely depend upon the amount of memory available in the computer running the analyzer software. The default behavior of network analyzers is to fill the capture buffer and stop capturing or to implement a ring buffer with a “first in, first out” policy. For short-term packet captures such as wireless environment channel scans, the analyzer’s default buffer size is normally sufficient. On busy networks, if you find the capture buffer is being filled too quickly, one option is to increase the buffer size; just make sure that there is enough computer memory free to accommodate the extra buffer size, without compromising performance.
Save to Disk
If you need to capture packets over a sustained period of time, just selecting a large capture buffer will probably not provide enough storage, so the other option is to save the packets to disk. Captured packets are still placed into the capture buffer initially. Once the buffer is full or reaches a specified level, the packets are written to disk along with a date and time stamp applied to the end of the filename. These steps are repeated for the length of the capture.
Over a long period, these save-to-disk captures can produce many files. Some analyzers provide a forensic search facility for searching through a set of capture files (or trace files) and selecting just the packets that match the search criteria, displaying them in a new window. Save-to-disk captures are especially useful when trying to troubleshoot an intermittent problem. As an analyst, it can be amazing how, at the time when you are capturing packets, the problems just disappear, and everything works as it should. It is for situations like this when you want to leave a save-to-disk capture running and go for coffee. Just make sure there is someone around to record the time when the problem recurs.
Packet Slicing
Save-to-disk captures allow you to perform long-term packet captures; however, they can have the drawback of eating up your hard disk space. This is where packet slicing can help. Packet slicing allows you to just capture the first so many bytes of each packet, disregarding the rest of the frame. Often the only information we are interested in is the header information, and we do not have any interest in the data elements of the packets. This is especially the case on wireless networks when encryption is used and the data is unreadable. By using packet slicing, you can store a significantly larger number of packets to disk.
When encryption is used on a wireless network, the data element can sometimes still be of some use to the analyst, providing they know the encryption key. If a preshared key is used for encryption, some analyzers allow the key to be entered when configuring captures. The analyzer will then decrypt the packets in real time as they enter the capture buffer. When analyzing unencrypted packets, layer 2–7 header information is available. If you want to use packet slicing to remove the data element of a packet but still leave the MAC, IP, and TCP/UDP and application protocol headers in place, slicing packets at 128 bytes normally works quite well.
No Data for You!
A wireless analyst, who was hired to troubleshoot a slow response time for a bespoke application running on wireless handheld terminals, realized after analyzing the wireless network that this might be an application problem and wanted to troubleshoot the TCP responses. However, the network he was monitoring was encrypted with a WPA preshared key. Although the consultant had signed an NDA, the organization was reluctant to provide the key to the consultant because it was company policy to not allow company data on any machine that would be leaving the premises. The consultant was able to demonstrate that, through packet slicing, the analyzer could be configured to strip off the data elements to all packets, leaving only the IP and TCP header information he required. Satisfied that no company data would be stored, the IT manager entered the key in the analyzer’s configuration, enabling the analyst to solve the problem.
Protocol Decodes
At the very heart of protocol analysis are protocol decodes. Network analyzers can decode hundreds of network protocols, and these protocol decodes are used to decode the captured packets. Analyzing the detail within these packet decodes is often the last step in protocol analysis. Protocol analysis will often begin with looking for interesting or suspect protocols, devices, or events; these are often flagged by the expert features within analysis products. Next you can focus your analysis on just a particular device, protocol, or conversation, and finally, we can examine the packets and their decodes.
Protocol analyzer packet decode screens are traditionally split up into three areas: decode window, hex view, and ASCII view, as shown in Figure 12-9. Each of these three areas displays the captured packet. The decode window splits the packet down into its individual fields and displays a meaningful decode for each field. The hex view shows the raw hexadecimal value for each byte in the packet, and the ACSII view displays the ACSII character for each byte. The ASCII view is typically shown to the right of the hex view. If a protocol sends its data in clear text, the data will be readable in the ACSII view. Some analyzers also include an option to show EBCDIC encoding too.
Figure 12-9: Wireshark packet decode screen
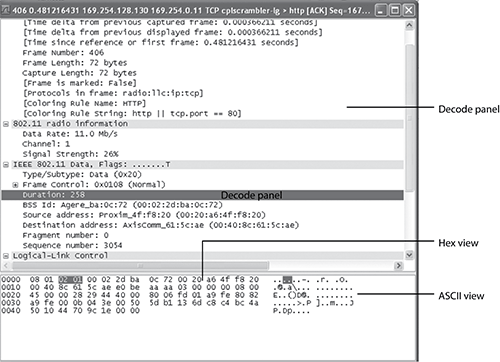
Figure 12-10 shows an example of an 802.11 protocol decode. The protocol decode window is arranged with the lower layers of the OSI seven layer model at the top; as you travel down the window, the layers go up. At the very top of the decode window is the packet information section, which displays information decoded about the packet by the analyzer such as packet number, length, and time stamp, as well as information passed up from the PHY layer such as signal strength, modulation type, and data rate.
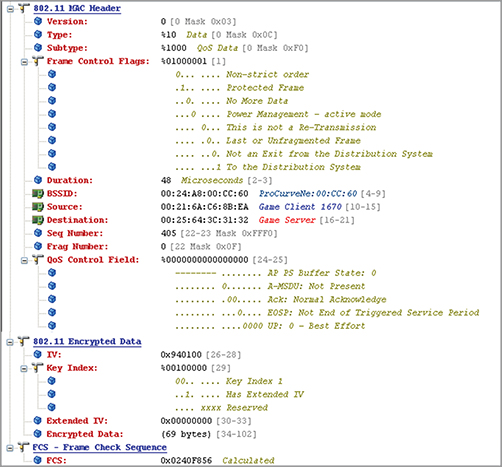
Following the packet information section, the packet decode begins. All 802.11 packets begin with a layer 2 (data link) MAC header. What follows depends upon whether the packet is encrypted. When no encryption is used, the next header will be the second Data-Link sublayer, the Logical Link Control (LLC). In Figure 12-10, this is followed by an IP header, followed by a TCP header, and finally followed by an application layer HTTP header. When encryption is used, the encryption header and encrypted data directly follow the MAC header, as shown in Figure 12-11.
Figure 12-10: Example decode of an unencrypted wireless frame

Figure 12-11: Example decode of an encrypted wireless frame
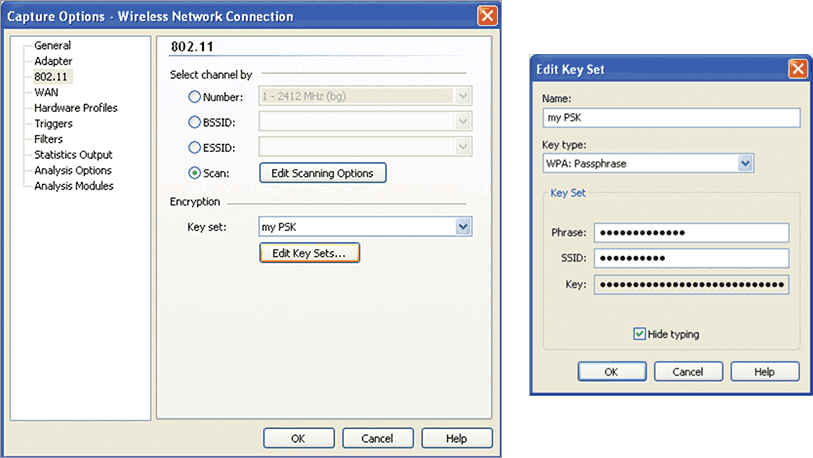
When a preshared key is used to encrypt traffic, such as WEP, WPA-PSK, or WPA2-PSK, some analyzers allow this key to be entered into the analyzer’s configuration, as shown in Figure 12-12. Once a preshared key is configured, the protocol analyzer can then decrypt packets, displaying the protocol decodes as if no encryption had been used.
Figure 12-12: Encryption key configuration
When reading protocol decodes, you see three pieces of information displayed: the field name, value, and decode, as identified in Figure 12-13. The field name is often a self-explanatory name, such as source address, SSID, or beacon interval, and this is followed by the field value. The field value can be displayed in either binary, hexadecimal, or decimal—whichever is the most appropriate for that field. Most vendors follow the convention shown in Figure 12-14: when just a number is displayed, it is a decimal value; when the value is preceded with a 0x, it is a hexadecimal value; and when preceded with a %, it is a binary value. The last piece of information is the field decode, which is an interpretation of the field value. Figure 12-12 shows a deauthentication reason code value of 2; the decode helpfully interprets the reason code 2, which is “Previous authentication no longer valid.”
Figure 12-13: Field decode information

Figure 12-14: Decode value interpretations

Peer Map Functions
A peer map is a visual representation of which STAs are communicating with each other. Lines between peers indicate communication. The peer map feature in OmniPeek, pictured in Figure 12-15, indicates the volume of traffic between the communicating peers through the thickness of the line joining them. A thicker line indicates more traffic has been communicated. You will also notice from Figure 12-15 that a dot is associated with each node; the size of the dot indicates the volume of traffic that each node has transmitted.
When troubleshooting network traffic, one of the first big questions that often needs to be answered is, “Where did the packets come from, and where are there going?” Both physical and logical peer maps can help you answer this question. The peer map shown in Figure 12-15 is a physical peer map.
Figure 12-15: OmniPeek peer map

Physical peer maps identify which physical devices (identified by their MAC address) are communicating. Physical peer maps draw lines between the source and destination MAC address within the MAC header. On a physical peer map, traffic addressed to or from a device on an external subnet will be shown as traveling to and from the default gateway/router.
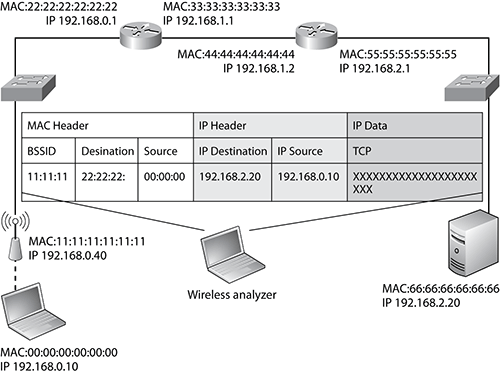
To help explain this, take a look at the simple network diagram shown in Figure 12-16. In this diagram, the wireless analyzer has captured a packet traveling between the wireless client and access point. The captured packet and its address fields are also pictured. Because the ultimate destination of this packet is a server on another network, as indicated by the destination IP address in the IP header, it is sent to the client’s default gateway. The default gateway is the client’s known route to other networks. So, when we look at the MAC header of this packet, the source address is 00:00:00:00:00:00, which is the client’s MAC address, and the destination address is 22:22:22:22:22:22, which is the router’s (client’s default gateway) interface on the network that contains the wireless network. On a physical peer map, this packet would cause a line to be drawn between these two MAC nodes.
Logical (layer 3) peer maps are also available. On an IP logical peer map, lines are drawn between the source and destination address in the IP header. So, the packet captured in Figure 12-16 would cause a line to be drawn between 192.168.0.10 (the wireless client) and 192.168.2.20 (the server).
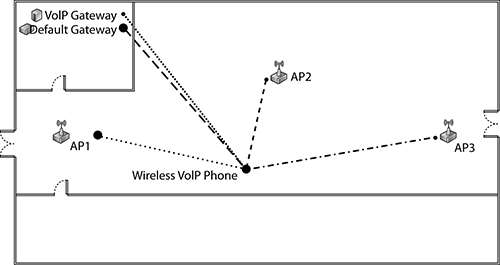
Peer map displays can be configured to make a much more readable display. Figure 12-17 shows a peer map created from a filtered packet capture showing only frames to and from a wireless VoIP handset. A floor plan background has been added, and the nodes have been named and placed on to the background. You can now clearly see that the VoIP handset has communicated with each of the access points in this room.
Figure 12-16: Example network diagram
Peer maps have many different features and configurations, which allows you to quickly identify and select the traffic you are interested in. For example, right-click a node to select and display all traffic addressed to or from the device, or alternatively click a line to bring up details of a particular conversation.
Figure 12-17: Example peer map display
Conversation Analysis
Often the final step of protocol analysis is analyzing an individual conversation. Most protocol analyzers have a conversation view, listing the individual conversations and their statistics such as the number of packet sent/received, the number of bytes sent/received, the duration, and the throughput. Figure 12-18 shows Wireshark’s conversation window. The conversation window can provide a good starting place when selecting the conversation or flow that you would like to analyze in more detail. Analyzers that include an expert system will also list any events or alarms, which have been detected by the expert system. Expert systems help identify which conversations need analyzing in more detail and will be discussed in more detail in the expert system section of this chapter.
Figure 12-18: Wireshark conversation window

Selecting just the traffic that you want to analyze is a key troubleshooting step. This may be one particular conversation, or it may be a set of conversations, such as all the conversations that one particular problematic station has had. Two main methods of packet selection are available:
- Display filters
- Select related
These methods hide any unwanted traffic from your analyzer’s display. Which of these are available to you will depend upon your preferred analyzer’s capabilities. Post capture filters will be described in more detail in the next section on filters. The select-related method allows the analyst to click or right-click a node, protocol, packet, or conversation in any screen within the analyzer and select the packets related to that object. For example, you can right-click a node in the peer map and select all packets transmitted to and from that node. Or in the protocol view, right-click the HTTP protocol, and select all the web traffic.
Having selected the conversation(s) of interest, you can then start to examine conversation flow and packet decodes. When performing this type of analysis, you are looking for any unexpected behavior or error messages. If you are going to be able to detect unexpected behavior, you need to know what the expected behavior is. It is at this point that knowing your protocols, and all you have learned in this book, becomes important.
If a user was experiencing network connectivity problems, you would want to understand the procedure a station would go through under normal conditions to connect to the network. For example, this might be as follows:
1. Network discovery
1.1 Probe request
1.2 Probe response
2. Open system authentication
2.1 Authentication message 1: open system request
2.1 Authentication message 2: authentication success
3. Association
3.1 Association request
3.2 Association response
4. EAP authentication
4.1 EAPoL START
4.2 EAP request: identity request
4.3 EAP response: identity response
4.4 EAP request: client challenge
4.5 EAP response: challenge response
4.6 EAP request: server challenge
4.7 EAP response: challenge response
4.8 EAP success
5. RSN four-way handshake
5.1 EAPoL KEY
5.2 EAPoL KEY
5.3 EAPoL KEY
5.4 EAPoL KEY
6. DCHP
6.1 Discover
6.2 Offer
6.3 Request
6.4 Acknowledge
If you know what the expected behavior is, you can then compare this to your captured packets and identify at what point it fails. Does the association fail? Are you not getting a response to the EAPol START message? There are many different places within in this procedure that a failure could occur. On an encrypted network, the DHCP packets in step 6 would be encrypted, making the DHCP messages unreadable. However, if the procedure up to the end of the four-way handshake had been successful but the client was not obtaining an IP address, you could correctly point the finger at the DCHP procedure, because you know this is the next expected behavior. If you wanted to analyze the DCHP procedure, this could be done with an Ethernet analyzer on the wired network.
Exercise 12-1
EAP Conversation Analyses
In this exercise, you will use a protocol analyzer to analyze a client’s authentication and association using EAP/802.1x. The following directions should assist you with the installation and use of WildPackets’ OmniPeek protocol analyzer demo software. If you have already installed OmniPeek, you can skip step 1.
1. A demo copy of OmniPeek Enterprise is included on the CD that comes with this book. Locate the file OmniPeek65ademo.exe. Double-click the installation file, and follow the installation prompts. You will need to be connected to the Internet to activate the license.
2. This exercise will use frame captures that are on the CD that comes with this book. If you want to use OmniPeek for live captures, you will need to install the proper drivers for your Wi-Fi radio card. Verify that you have a supported Wi-Fi card. You can find information about the supported drivers at www.wildpackets.com/support/downloads/drivers. Review the system requirements and supported operating systems. Install the proper driver for your Wi-Fi card.
3. From Windows, choose Start Programs WildPackets OmniPeek, and then click the OmniPeek icon. The OmniPeek application should appear.
4. Click the Open Capture File icon, and browse the book’s CD.
5. Open the packet capture file called EAPauth1.apc.
6. In the left column, click Capture Packets. Drag the Protocol column so that it can be viewed within the window.
7. Scroll down to packet 134; you will notice it is a probe request message. Examine the packet decode to see the requested SSID.
8. Packet 135 shows the probe response from the access point. Examine the packet decode, and find the matching SSID.
9. Right-click the probe response (packet 135), and select Insert Into Name Table.
10. In the resulting dialog box, enter the name AP, and choose a blue color from the color drop-down.
11. Click OK, and a second dialog box will appear. In this box, enter Client as the name, and pick a red color from the color drop-down; then click OK. You should now notice that the source and destination MAC addresses have changed to the AP and Client labels you have just given them. If you do not see these labels in the source and destination columns, then from the menu select View Display Format and make sure Show Address Names is selected.
In packets 147–154, you see the client open authentication and associate to the access point. In packet 155, the client initiates the EAP protocol exchange.
12. Follow the EAP exchange through. Was it successful?
13. Open EAPauth2.apc.
14. Find the EAP exchange in this file. Was it successful?
Filtering: Capture and Display
In a busy 802.11 wireless environment, an unfiltered packet capture will generate a large number of packets for analysis. The sheer quantity of data can make it very difficult to find the information you require. When dealing with large amounts of the data like this, filters become an essential analysis tool, allowing you to quickly locate the data you require. Filters can be configured to hide traffic that is of no interest to the analyst or to select only the interesting traffic. The three main methods for creating filters are as follows:
- Regular expression
- Proprietary scripting language
- Proprietary filter creation GUI
Which of these are available to you and what criteria can be used to create the filters will depend on your choice of analyzer. At a very basic level, you should be able to create filters on address, protocol, and port.
Filter Conditions and Operators
Address filters allow the selection of traffic based upon physical (MAC) or logical (Network layer) addresses. As well as individual addresses, address filters allow the use of wildcard entries that enable the selection of IP subnets. MAC address wildcard entries allow the analyst to filter on a particular vendor’s organizationally unique identifier (OUI). OUIs are the first three bytes of every MAC address and are uniquely assigned to vendors by the IEEE Registration Authority. For example, 00:1E:5D:*:*:* is assigned to Cisco-Linksys. If you only ever deploy one or two different vendors’ equipment, by filtering out their OUIs, you can quickly see whether there are any noncompliant devices in your RF environment.
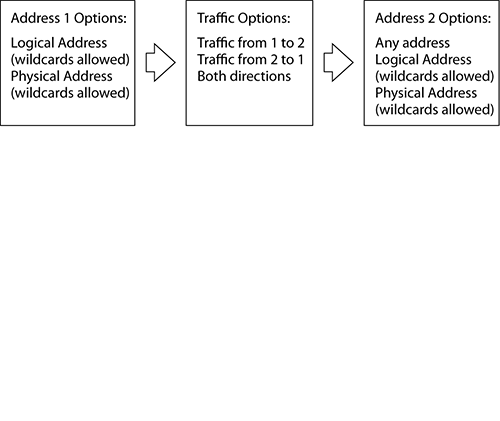
Having entered an address into a filter, the default behavior is to filter all traffic traveling to or from that address or subnet. However, address filters can be configured to filter only that traffic being sent to the configure address or from the configured address. Alternatively, you can just filter traffic traveling between two different addresses or subnets. Figure 12-19 shows the different address filter options.
Figure 12-19: Address filter options
Protocol and TCP/UDP port filters allow the analysis to focus their filters on a particular type of traffic. Protocol and port filters can be used in conjunction with address filters or separately. For example, you might want to look simply at all email traffic, or you might want to look at all email traffic from a particular server.
The address, protocol, and port are not the only criteria that can be used to create a filter condition. More advanced filters can be created through the use of other criteria. Some of the other common options available are shown here:
Value/Offset This is probably the most powerful filter criteria, allowing any byte or bit of a packet to be filtered on. The byte(s) to be filtered is referenced with an offset from the beginning of the packet. If less than one byte is of interest, a bit mask can be used to select the individual bits required. This is a great way of filtering on a particular flag within a packet. One word of warning: with offset filters, unless you are filtering on something generic within the MAC header, always use a protocol filter as well. For example, if you were filtering on the 35th byte offset in a beacon frame looking for the privacy flag being set, it is important you at look at the 35-byte offset only in beacons and not in all frames.
Pattern This matches a particular data pattern in ASCII or hex anywhere within the packet or between two configured offsets.
Length This filters packets that have a size between a minimum and maximum length.
Wireless Filters can be created based on 802.11 wireless conditions, such as channel, signal strength, data rate, and BSSID.
When combining multiple filter conditions, such as address and protocol within one filter, you can AND the conditions together, which will result in only the traffic that matches both the conditions being filtered. You can also OR the conditions together, which filters any traffic matching either of the conditions. A NOT operator can also be applied to a filter condition, resulting in any traffic that does not match the condition being filtered. Through the use of multiple conditions and operators, you can create complex and powerful filters.
Applying Filters
When applying filters, a choice can be made to either collect packets matching the selected filters or to reject packets matching the selected filters. Filters can be applied at capture time, or they can be applied after the capture as display filters.
Capture Filters
Capture filters are applied to the packet stream before the packets enter the capture buffer. Anything filtered out at capture time is not stored and therefore cannot be recovered later. Capture filters can make your packet captures more readable by removing unneeded traffic.
Wireless captures can become crowded by beacon and probe request/response messages. This is because access points send beacon frames typically every 100ms, and clients will often transmit probe request messages searching for new and better access points, even when associated. If beacon and probe request messages are not of interest, then filtering them out at capture time will provide for a cleaner capture window, allowing the needed information to be found more easily. When performing a long-term capture and saving the packets to disk, an unfiltered capture can needlessly eat away at your hard drive space. By only saving the packets of interest through capture time filtering, you reduce the risk of filling your hard drive.
Display Filters
Display filters or post-capture filters provide a way of hiding from view unwanted packets. An advantage of display filters is that the packets are only hidden and can be retrieved if required. When you are not sure what information you will require and system resources are not a problem, capturing everything and using display filters to home in on what you need can often be the best approach. This way, if you filter out some data that you later discover you need, you can just remove the filter.
Expert Functions
Expert analysis is the automatic detection of network events, errors, and problems by an analyzer. Expert analysis is a term used by the more traditional protocol analysis vendors, whereas the WIDS vendors tend to refer to their expert analysis as a set of alarms. There are two types of expert analysis, threshold-based and heuristic-based. An explanation of these two types follows.
Threshold-Based
Threshold-based expert analysis collects network statistics and compares them to configured threshold values. When the statistics exceed the configured threshold, an expert event is triggered, and a notification is sent. An example of a threshold-based expert event would be “Too many retransmissions,” where the threshold value is configured to trigger this event when retransmissions reach an unacceptable level. A good default value for this event may be three retransmissions within a 10-second period. Although like all threshold-based expert events, the value should be tweaked to match the network and wireless environment being monitored. Figure 12-20 pictures the expert setting in OmniPeek.
Figure 12-20: OmniPeek event finder settings

If an expert event is triggering regularly and after investigation you believe it not to be an issue for your network, then you should change the threshold value to a more appropriate level for your network. There may even be some expert events and alarms that you want to disable because they are not appropriate for your environment. Having configured your expert settings, it is good practice to export a backup copy of the settings so that they can be easily reloaded if needed. When using a portable analyzer to monitor many different networks, the default expert settings will probably work well, because they have been designed by the vendors to work for typical network deployments. If you find yourself analyzing a group of networks on a regular basis, you could have expert event settings files for each network, which get reloaded for each network.
Heuristic-Based
Heuristic-based expert analysis looks for patterns in the traffic flow and compares them to a set of rules. Traffic that does not conform to these rules is reported. A good example of a heuristic-based expert event would be “Inefficient client,” which looks for clients sending data using only small packet sizes. Some expert events are a combination of both threshold-based and heuristic-based analysis.
Expert systems save network analysts time by automating some of the basic analysis tasks. The events report by the expert system provides a good starting place for further analysis and can point the analyst in the right direction of a problem.
Because of the large number of expert events or alarms that vendors implement, it is not always easy to know what every alarm is and how it is triggered. To help combat this, analysis tools contain a database of events/alarms with a description of the event and a possible mitigation technique. Figure 12-21 shows the alarm description window in AirDefense.
Figure 12-21: AirDefense alarms details

Wireless Policies
Many wireless analysis vendors allow the configuration of a wireless policy to be entered into the analyzer. Configuring a wireless policy is similar to the configuration of a wireless service on a wireless LAN controller. Wireless policies allow the analyst to specify the wireless network, which is analyzed in terms of the following:
- SSID
- Channel set
- Security mechanism (authentication and encryption)
- Vendor
Any traffic captured that does not conform to the configured policy will be reported. This can help identify misconfigured or rogue devices.
Performance Analysis
The main metrics used for measuring network performance are availability and throughput. Maintaining a wireless network that provides all users with the required throughput and a high level of availability is a difficult task. Many different factors affect wireless network performance, some of which are listed here:
- High volumes of associated clients to a single access point
- Clients communicating at low data rates because of physical distance from the access point
- Mixed modulation types and protection mechanisms
- Co-channel and adjacent channel 802.11 interfering devices
- Non-802.11 RF interference
- Inefficient roaming
- Physical environment: multipath, obstructions, and absorption
- Channel hops because of Dynamic Frequency Selection (DFS)
Poor network performance manifests itself in wireless network analyzers as follows:
- High level of retransmissions
- High level of corrupted packets
- Weak signal
- Excessive RTS/CTS packets
- Excessive data rate changes
- Too many clients associated to the same AP
- High wireless utilization
- Slow roaming times
Many of these performance-related issues will be detected by an analyzer’s expert system or a performance-related alarm in WIDS. Examples of the performance-related events and alarms that wireless analyzers can detect are shown in Figures 12-21 and 12-22.
Figure 12-22: AirDefense Mobile performance alarms
Reporting Capabilities
Most analyzers have some built-in reporting capabilities. This can be anything from creating an HTML report showing the same statistics, events, and graphs visible in the GUI to providing a full regulatory compliance report. Analyzers often provide different levels of reports, ranging from an executive summary report, which just provides the overall health, performance, and security of your wireless network, to a full detailed report, which includes statistics on the protocols, devices, and conversations observed on the network, plus all expert events and alarms that have been detected.
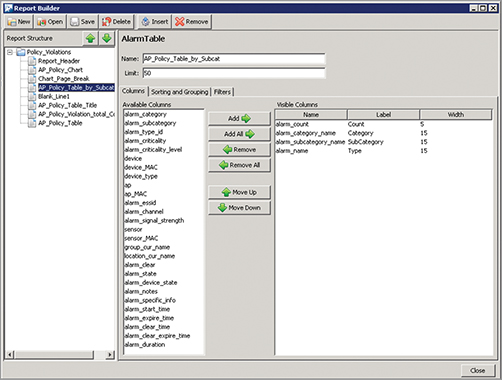
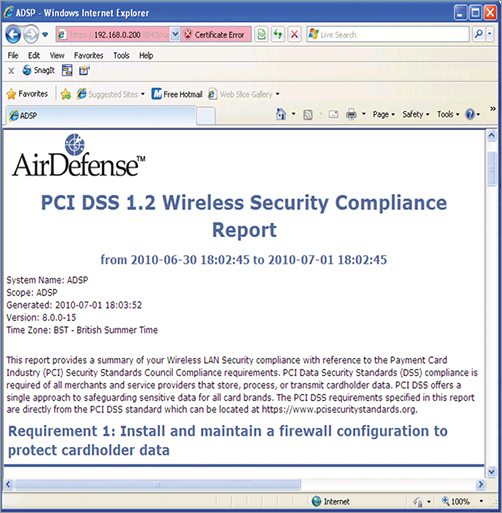
A WIPS is often the most comprehensive reporting tool, allowing the creation of custom reports through a report building wizard, as pictured in Figure 12-23. WIPS also have many report templates for different types of security and performance-related reports, these including ones that will be required for regulatory compliance, such as the PCI report pictured in Figure 12-24.
Figure 12-23: AirDefense Report Builder
PCI DSS
The Payment Card Industry Data Security Standard (PCI DSS) is a security standard defined by the Card Industry Security Standards Council. The aim of the standard is to help organizations that process card payments to prevent fraud. Organizations that process or store card details must be compliant with the standard.
The PCI DSS standard includes minimum security requirements for wireless networks and also requires that a test to detect the present of rogue wireless access points be carried out at least quarterly. For more information on the wireless requirements outlined by PCI DSS, a Security Standards Council document titled “Information Supplement: PCI DSS Wireless Guidelines” has been included on this book’s CD.
Figure 12-24: AirDefense PCI report
Many analyzers allow 24/7 monitoring captures to be performed. These captures work in one of two ways:
- By using a ring buffer, where the oldest packets are removed from the buffer in order to make way for the new ones coming in
- By only recoding the statistics about each packet, without storing the packets themselves
Although both of these methods throw away packets, the statistics about all packets are still recoded from whenever the capture was started.
The automated reporting capabilities of a network analyzer can be used along with a 24/7 monitoring capture to save an HTML-formatted report to an internal web server every five minutes. This will create an internal website showing the current status of the wireless network, which can be accessed by the whole networking team. Distributed analysis platforms often provide this functionally also through a dashboard view accessible from remote consoles or via a web GUI.
Understanding the common features of a protocol analyzer and the use of a basic troubleshooting methodology are great for troubleshooting many problems; however, there are some situations where you will find yourself requiring more advance analysis procedures and operations. One such situation is when analyzing a real-time application such as Voice over IP (VoIP), which requires Quality of Service (QoS) end-to-end across the entire network, not just the wireless segment. Often Voice over Wi-Fi (VoWiFi) problems are caused by problems with a voice handset roaming. Troubleshooting roaming problems is not easy when using a signal wireless capture adapter because the adapter can capture packets on only one channel at any given time. The solutions to these analysis problems will be discussed next in this section.
Any analyst will know that the worst type of problem to troubleshoot is an intermittent one. You can guarantee that when you are on-site performing a packet capture, everything will be operating perfectly. Distributed analysis can help solve this problem by giving the analyst the power to start a capture at a remote site at the time a problem occurs. Having the ability to monitor and troubleshoot your entire wireless environment from one central location can save valuable time and resources. The different distributed analysis architectures and their uses will be discussed in this section.
VoWiFi Analysis
As with all application-based protocol analysis, the level of VoWiFi analysis that can be performed if encryption is used on the wireless network will be limited. If you are not able to decrypt the packets, some analysis of VoIP calls and signaling will be able to be performed from the wired network.
Although we cannot analyze VoIP calls and their signaling on an encrypted network, we can still analyze two of the most import requirements for voice on a wireless network: QoS and fast efficient roaming. Roaming problems are one of the most common causes of dropped calls or glitches on a VoWiFi system. Analysis of roaming will be discussed in the “Roaming Analysis” section later in this chapter.
WMM Analysis
As you have already learned in previous chapters, QoS on a wireless network is achieved through the use of wireless multimedia (WMM). WMM-capable access points will advertise their WMM capabilities in beacon frame, as shown in Figure 12-25.
Figure 12-25: WMM Information Element

WMM needs to be configured on both the access point and the wireless VoIP handset. If correctly configured, wireless VoIP packets should be transmitted using QoS data frames. QoS data frames contain a QoS Control field in the 802.11 MAC header, as shown in Figure 12-26. By looking at the QoS Control field, you can confirm that the packet is being transmitted using the correct access category (AC). Voice traffic should be marked with a very high priority and therefore put in to the Voice access category, as pictured in the QoS Control field decode in Figure 12-27.
Figure 12-26: The 802.11 MAC header

Figure 12-27: QoS Control field decode
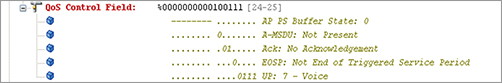
Figure 12-27 shows the TID (Traffic Identifier) subfield of the QoS Control field set to 7, indicating a UP (User priority) of 7; this UP is mapped to the Voice AC, as shown in the decode text. By creating a filter on the TID subfield of QoS Control field, you can identify all devices currently sending data using the voice AC. By doing this, you can check two things:
- That it is only our VoIP handsets using this high-priority AC
- To confirm how many VoIP calls are currently active in the BSS
Looking at the number of devices actively sending out voice AC traffic is a good way to identify the number of voice calls on an encrypted network. Tagging frames alone does not guarantee good voice quality because interference or bad wireless design can also affect call quality. What tagging does do is give your voice packets the best chance of getting to the access point fast enough to not cause an audible problem.
For our VoIP system to work successfully, you must ensure QoS end-to-end across the whole network. Network analysis confirming the operation of QoS over the wireless network is only half the job; you must also ensure the traffic prioritization is working across the whole network. This may involve analysis of the VoIP frames on the wired Ethernet network, confirming the Differentiated Services Code Point (DSCP) priority in the IP header and confirming that the 802.1Q VLAN tags are carrying the right priority across trunk connections.
If at any point across the network traffic priorities are not upheld, VoIP traffic could get held up behind large data packets, impacting the call quality. This can become a problem when all wireless traffic is being sent from an access point to a wireless LAN controller/switch in a propriety encrypted tunnel. Encrypting wireless traffic across the wired network in this way is a method commonly used by wireless LAN vendors to contain the wireless traffic until the wireless LAN controller has processed the packet through its own firewall and made a decision about its destination VLAN. This effectively makes the wireless LAN controller the network entry point for the wireless LAN packets. To help understand why this can be a problem when trying to ensure end-to-end QoS, let’s consider the network pictured in Figure 12-28.
Figure 12-28: Example path from access point to controller
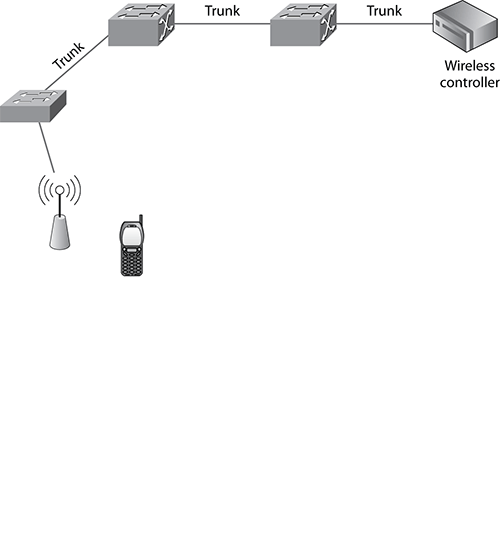
In the example network pictured in Figure 12-28, when the access point receives a VoIP packet from the wireless handset transmitted using the voice AC, it forwards this packet on to the wired network, and the UP priority should be honored in the Differentiated Services field in the IP header. When this packet traverses a trunk again, the priority should be honored in the VLAN tag. This will ensure the wireless VoIP packet has priority on the three trunk connections between the access point and controller, over other network traffic. However, when propriety layer 2 tunneling is used between the access point and the wireless controller, the entire wireless frame is encrypted and sent to the controller in a proprietary layer 2 frame. When this frame is received by a wired switch, it cannot read the priority identified in the IP header because it is encrypted and therefore treats the frame equally to all other network traffic. It is not until the frame is decrypted and forwarded by the wireless controller that the prioritization will be honored again across the network. Unfortunately, in the diagram shown in Figure 12-28, by that point, the packet has already traveled across three VLAN trunk connections and has been significantly delayed. It should be noted that this is only a problem when using layer 2 priority tunneling. When layer 3 tunneling is used, the priority from the inner frame can be transferred to the outer layer 3 frame. Most wireless vendors support the ability to use layer 3 tunneling. However a few wireless vendors default behavior is still for an access point to try and connect using layer 2 tunneling first.
Call Analysis
On unencrypted networks or on networks where you can enter a preshared key to decrypt the packets, you are able to analyze the call and signaling information of your VoIP conversations. Some network analyzers include special VoIP analysis features:
- Call list
- Call quality metrics (MOS and R-Factor)
- Signaling diagrams
- Call replay
- VoIP expert events
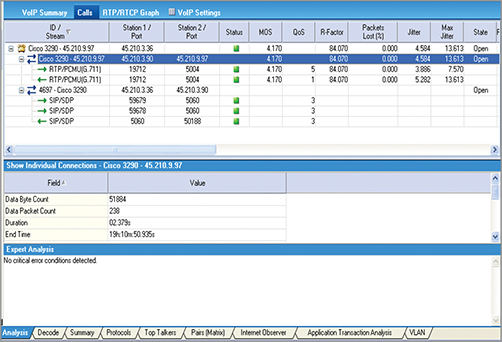
Figure 12-29 shows an example call list , which lists each call and its associated signaling. Quality metrics are also shown for each call.
Figure 12-29: Observer call list
The mean opinion score (MOS) is a value from 1 to 5 that indicates the perceived quality of a call. MOS scores were originally derived by playing a test message to a group of listeners who rated the quality of the message using the rating scheme shown in Table 12-2. The average rating is taken to be the MOS score for that particular communications medium.
Because protocol analyzers do not have lots of tiny people inside listening to each call, they are not able to calculate a true MOS score, and therefore the MOS score displayed by your protocol analyzer is what is called passive MOS. Passive MOS is calculated from another quality metric that you will see displayed in your protocol analyzer, called R-Factor. R-Factor is calculated from measurable information such as jitter (the variation in packet delay over time), packet loss, and latency. R-Factor is a value from 0 to 100. Table 12-3 shows the mapping between R-Factor and MOS.
Table 12-2: Mean opinion score
| MOS | Quality | Impairment |
| 5 | Excellent | Imperceptible |
| 4 | Good | Perceptible but not annoying |
| 3 | Fair | Slightly annoying |
| 2 | Poor | Annoying |
| 1 | Bad | Very annoying |
Table 12-3: R-Factor and MOS mapping
| R-Factor | MOS | Quality |
| 90 | 4.3 | Excellent |
| 80 | 4.0 | Good |
| 70 | 3.6 | Fair |
| 60 | 3.1 | Poor |
| 50 | 2.6 | Bad |
When the MOS and R-Factor values indicate poor call quality, the reason for this is often flagged by the analyzer’s VoIP expert events. Figure 12-30 shows an example of an analyzer’s display, showing VoIP expert events.
Many network analyzers can display a list of calls as shown in Figure 12-30; it is from here that many of an analyzer’s advanced VoIP features can be accessed, such as call playback, as pictured in Figure 12-31. The audio data is extracted from the VoIP packets and reconstructed into an audio file, which can be played to the analyst. The analyzer will honor the packet time stamps when reconstructing the audio, so the analyst can hear the effects of delay, packet loss, and jitter. This could end up sounding worse than it would to the actual end VoIP user because VoIP handsets have built-in jitter buffers that help mask the effects of delay and jitter from the user. Therefore, analyzer vendors allow a jitter buffer to be configured in the VoIP playback tools, which can be set to the same value as configured in the VoIP handsets. The analysts can then hear the calls as they would be perceived by the end users.
Figure 12-30: OmniPeek VoIP expert
Figure 12-31: Wireshark call playback
When a VoIP call is made, three main data flows occur. The first data flow is the signaling protocol that manages the VoIP session including establishing and tearing down the call. There are many different types of signaling protocol, including many propriety ones. Some commonly used signaling protocols are Session Initiation Protocol (SIP), H.323, and Cisco’s Skinny.
Voice information is encoded using a codec such as G.711 into Real Time Protocol (RTP) packets. A telephone call requires data to flow in both directions. Once a call is established, two RTP streams are created, one carrying voice packets from the caller and one carrying voice packets to the caller. Many analyzers provide advance features for analysis of both the signaling and RTP conversations, as pictured in Figures 12-32 and 12-33.
Because each direction of a call is carried in a unique RTP session, each RTP session will have its own quality metrics. When voice quality problems occur, you might find one direction has a good MOS score and the other direction is poor. You may have experienced this on your VoIP phone or your cell phone when you can hear the other person perfectly but they cannot hear you.
Figure 12-32: Wireshark signal analysis
If encryption is used and you cannot decrypt the wireless traffic but still want to get at the call and signaling information, you need to capture this information on the wired network by capturing the traffic traveling to and from the access point or wireless LAN controller. However, when looking at call quality metrics (such as MOS & R-factor), it must be remembered that, for packets flowing toward the wireless network, effects of access point queuing buffers, wireless contention, and transmission will not have been taken into account.
Figure 12-33: Wireshark RTP analysis

By comparing the wired traffic to the encrypted frames transmitted within the wireless cell, you can probably work out which encrypted frames belong to which call. By looking at the differences between the delay of these encrypted frames and packets captured on the wired side, you can work out whether any excessive delay is being introduced by the wireless network.
Multiple-Channel Protocol Analysis
One method of capturing traffic on different channels is to configure your wireless analyzer to perform channel scanning. The limitation of channel scanning is that the wireless capture adapter is capable of capturing packets on only one channel at a time and therefore only captures a snapshot of what is happening on each channel. Any sort of conversation analysis or detailed troubleshooting is impossible, because too many of the required packets will be missing. When performing conversation analysis, it is better to configure the wireless analyzer for a fixed channel. Problems with this approach occur when troubleshooting an MCA environment with roaming clients. Roaming analysis requires the use of multiple capture adapters. This can be achieved by using one of the following approaches:
Multiple Network Analyzers In an MCA environment, where the channel sets 1, 6, and 11 have been deployed, this approach would involve three separate analyzers on three separate laptops, with each analyzer configured for a different channel. This would produce three separate packet trace files.
Simultaneous Captures and Multiple Adapter Support Some analyzers support the ability to start simultaneous captures from different network adapters. The advantage of this approach is that you need only one protocol analyzer; however, you are still left with three separate capture files—one for each channel. One solution to this problem is a tool shipped with OmniPeek by WildPackets called Peekcat. Peekcat.exe is a command-line tool that concatenates trace files together into one file and can optionally merge packets by their time stamp.
Multichannel Aggregation Multichannel aggregation takes capture streams from multiple adapters and aggregates them together into one capture. Each adapter can be configured for a different channel. Figure 12-34 pictures the AirPcap solution from Cace Technologies, where three USB capture adapters are connected to the analyzer via a UBS hub. This method has one big advantage over the other two methods, which is that all packets are captured straight into one capture file, making for easy analysis of clients’ activities as they roam from access point to access point. Figure 12-35 pictures the configuration of OmniPeek’s multichannel aggregator.
Figure 12-34: AirPcap multichannel monitoring and roaming analysis

Figure 12-35: OmniPeek’s multichannel aggregator configuration
A white paper entailed “The Triple Blendy: Multi-Channel Capture for Mobile Clients” by Devin Akin is included on the CD of this book. This paper details the equipment you will require and provides step-by-step instructions on the configuration of a multichannel aggregated capture.
Roaming Analysis
Roaming is the method by which client stations move between RF coverage cells in a seamless manner. Client stations switch communications through different access points. Seamless communications for stations moving between the coverage zones within an extended service set (ESS) is vital for uninterrupted mobility. One of the most common issues that you’ll need to troubleshoot is problems with roaming. Roaming problems are usually caused by poor network design. Because of the proprietary nature of roaming, problems can also occur when radio cards from multiple vendors are deployed. Changes in the WLAN environment can also cause roaming hiccups.
Client stations, and not the access point, make the decision on whether to roam between access points. Some vendors may involve the access point or WLAN controller in the roaming decision, but ultimately, the client station initiates the roaming process with a reassociation request frame. The method by which client stations decide how to roam is entirely proprietary. All vendor client stations use roaming algorithms often based on multiple variables. The variable of most importance will always be received signal strength. As the received signal from the original AP grows weaker and a station hears a stronger signal from another known access point, the station will initiate the roaming process. However, other variables such as SNR, error rates, and retransmissions may also have a part to play in the roaming decision.
Because roaming is proprietary, a specific vendor client station may roam sooner than a second vendor client station as they move through various coverage cells. Some vendors like to encourage roaming, whereas others use algorithms that roam at lower received signal thresholds. In an environment where a WLAN administrator must support multiple vendor radios, different roaming behaviors will most assuredly be seen. For the time being, a WLAN administrator will always face unique challenges because of the proprietary nature of roaming.
The best way to ensure that seamless roaming will commence is through proper design and a thorough site survey. When designing an 802.11 WLAN, it is recommended that at least two APs should provide the desired minimum signal level in all roaming locations. The only way to determine whether proper design is in place is by conducting a coverage analysis site survey.
Roaming problems will occur if there is not enough overlap in cell coverage. Too little overlap will effectively create a roaming dead zone, and connectivity may even temporarily be lost. On the flip side, too much cell overlap will also cause roaming problems. For example, if two cells have 60 percent overlap, a station may stay associated with its original AP and not connect to a second access point even though the station is directly underneath the second access point. This can also create a situation in which the client device is constantly switching back and forth between the two or more APs. This often presents itself when a client device is directly under an AP and there are constant dropped frames.
Another design issue of great importance is latency. The 802.11-2007 standard defines the use of an 802.1X/EAP security solution in the enterprise. The average time involved during the authentication process can be 700 milliseconds or longer. Every time a client station roams to a new access point and 802.1X/EAP security solution has been deployed, reauthentication is usually required. The time delay that results from the authentication process can cause serious interruptions with time-sensitive applications. Protocols such as VoIP requires end-to-end delays of less than 150 milliseconds to maintain good quality. When roaming a station, performing a full 802.1x/EAP authentication can take as long as 500 milliseconds to reauthenticate. Many vendors have implemented fast secure roaming (FSR) solutions to keep the reauthentication time to less than 100 milliseconds. Currently, the implemented FSR solutions are proprietary, although the 802.11i amendment defines optional FSR.
Two new IEEE 802.11 amendments published in 2008 will ideally standardize fast secure roaming in the enterprise. 802.11k amendment has defined the use of radio resource measurement (RRM) and neighbor reports to enhance roaming performance. The 802.11r amendment also defines faster handoffs when roaming occurs between cells in a wireless LAN using the strong security defined in a robust security network (RSN).
Chapter 7 of the CWSP: Certified Wireless Security Processional Official Study Guide by authors David Coleman, David Westcott, Bryan Harkins and Shawn Jackman (Sybex, 2010) provides a full description of the proprietary FSR algorithms currently used and those defined by the 802.11k and 802.11r. Also, a white paper has been included on the CD of this book entitled “Robust Security Network (RSN) Fast BSS Transition (FT)” by Devin Akin. This is highly recommended reading. You will also find a brief description of FSR in Chapter 9 of this book.
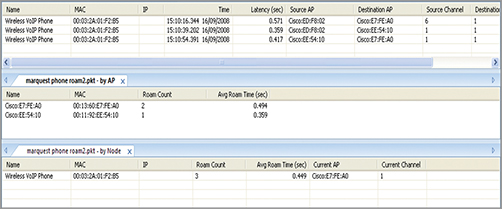
The best way to troubleshoot a roaming problem is to use an analyzer that supports multichannel aggregation and to configure one adapter for each of the channels used by the wireless network. If possible, follow a client around as it roams from access point to access point capturing its packets each time it roams. Filtering the capture to show just the packets to and from that particular client should allow you to quickly identify any roaming problems, including the time taken for each roam. Some analyzers have special displays that show roaming statistics. Figure 12-36 shows OmniPeek’s Roaming plug-in.
Figure 12-36: OmniPeek’s roaming plug-in
Ping-Pong Roaming
A wireless network was deployed in a very large sports center with the sole purpose of providing the staff with telephony services via VoWiFi handsets. After installing the access points, the center IT manager confirmed coverage by using laptop-based site survey software. Since rolling out the VoWiFi system, many complaints about long silences and dropped calls in certain areas of the center have been reported.
The sports center engaged the services of a wireless analyst to identify the problem. The analyst performed a channel aggregated capture, with three capture adapters configured for channels 1, 6, and 11 (matching the channel set used for the installed access points). Having configured a capture time filter to look at all traffic to and from a particular VoWiFi handset, the analyst followed the IT manager on a tour of the building while on a test call. The IT manager reported every occurrence of a problem with the call. In problem areas, the analyst observed the client roaming repeatedly between two access points.
The VoWiFi handsets were configured with a -75 dBm roaming threshold. Although the IT manager had confirmed wireless coverage, he had not confirmed that he had greater than -75 dBm coverage everywhere. In some areas between two of the installed access points, the client could not hear either access point at a signal strength greater than -75 dBm. The VoWiFi handset would realize that its current access point was below its roaming threshold and roam; having roamed, it would again realize that its current receive signal strength was below its roaming threshold and roam again. The handset would continue to ping-pong between the two access points until it moved close enough to one access point to receive a signal strength greater than -75 dBm.
The analyst correctly identified that the wireless network coverage was not designed for the chosen VoWiFi handsets; it had been designed following all the guidelines for a data network. Generally, as was the case in this network, VoWiFi networks require more access points than a data network. The problem was fixed by adding more access points in the areas where the signal strength was low, ensuring that in all places there was at least one access point that was greater than the roaming threshold.
Distributed Protocol Analysis
This chapter has so far focused on portable wireless analysis that utilizes wireless protocol analysis software installed on a laptop or tablet. The main limitation with using a portable analyzer is that an analyst must go on-site in order to capture data, and sending an engineer to remote sites can be an expensive exercise. It is not just remote sites that can be problematic for portable analysis; analyzing a network at a large site can involve a lot of walking, and just the process of collecting captures at different locations around the facility can take a full day, if not more.
By using portable analyzers, an analyst can only ever look at the wireless traffic at their current location; there is no way of seeing the wireless traffic across the whole network.
Distributed analysis addresses the limitations of portable analyses through the deployment of wireless sensors (or probes). Wireless sensors are remote capture devices that monitor the wireless environment and report their statistics/packets to an analyzer or server.
A variety of architectures exist for distributed analysis. The three most common architectures shown here will be described next:
- Wireless analyzer with remote capture probes
- Wireless analyzer with remote engines
- Centralized server with wireless sensors (WIPS)
Wireless Analyzer with Remote Capture Probes
Some analyzer vendors sell remote wireless probes. These devices look a lot like access points and are installed at remote locations. Instead of going on-site when a problem occurs, the analyst can simply launch their protocol analyzer, and instead of selecting a local adapter, they can select the remote probe as their capture adapter. The probe can be configured to perform a channel scan or configured to capture on a fixed channel. All the packets captured are sent across the network to the network analyzer.
The main disadvantage with this approach is that all the packets are sent back over the network, using up valuable network bandwidth. This can be a particular problem when connecting to a probe at a remote site over a low-bandwidth WAN link. To help alleviate some of this extra traffic from the network, many remote probes support hardware filtering, allowing capture-time filters to be applied, and therefore the probe only sends the traffic of interest back across the network.
Instead of using an analyzer vendor’s own probe, some wireless infrastructure vendors’ access points can be converted into remote capture adapters. Figure 12-37 pictures the Capture Options dialog box from OmniPeek; notice that as well as the option to capture from an RFGrabber (WildPackets’ own wireless probe), the option to use Aruba and Cisco access points as remote adapters is also available. To use a Cisco access point as a remote probe, you must first place the access point into sniffer mode. Figure 12-38 pictures the configuration for this on a Cisco Wireless LAN controller.
Many network analysis vendors now support wireless software agents, which are software-based remote probes that utilize the computer’s wireless adapter. Any computer can be turned into a remote probe by connecting to a supported USB wireless adapter and installing the software agent. This can be a cost-effective way of adding wireless analysis to small remote sites.
Figure 12-37: OmniPeek capture options dialog
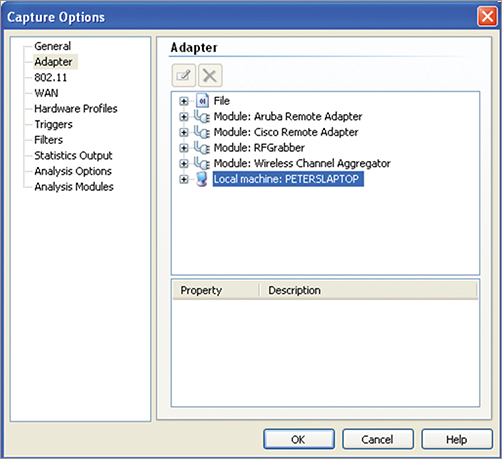
Figure 12-38: Cisco WLC access point configuration in sniffer mode
Wireless Analyzer with Remote Engines
As described earlier, the problem with remote capture probes is that they send all the traffic back over the network, using up valuable bandwidth on WAN links. Remote engines are software services that run on dedicated hardware or existing servers. Packet capture, filtering, decoding, and analysis are all performed on the engine. All packets are stored on the engine or attached storage. The analyst can connect to an engine, configure captures, and perform analysis from a console application. The console application has the same look and feel as a local portable analyzer, but only small screen updates are sent back across the network and not the packets.
For wireless capture, a supported wireless adapter can be connected to the engine. Multiple USB wireless adapters can be connected to a USB hub, which in turn can be connected to a remote engine. This engine can then be configured to use the multichannel aggregator and create a remote probe capable of capturing all wireless traffic within your remote environment. Alternately, some vendors provide dedicated intelligent wireless sensor hardware with a remote engine built-in.
Centralized Server with Wireless Sensors
The third deployment model is the one favored by Wireless Intrusion Protection Systems vendors. This model utilizes wireless sensors that monitor the wireless environment 24/7 and send their statistics to a centralized server. A consolidated view of wireless security and performance can be accessed from a console application. Figure 12-39 pictures the default dashboard view from Motorola AirDefense Enterprise.
Figure 12-39: Motorola AirDefense Enterprise dashboard
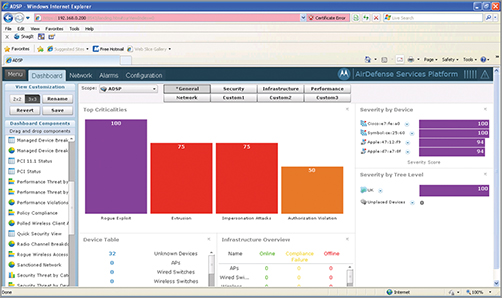
The primary purpose of a WIPS is to protect the network against potential security threats. For detailed information about how a WIPS protects against security threats, see Chapter 10 in the CWSP: Certified Wireless Security Processional Official Study Guide by David Coleman et al. (Sybex, 2010). As well as threat detection and prevention, WIPS also includes features to report the overall performance of a wireless network with detailed analysis and forensics software modules.
Wireless sensors can be a dedicated hardware device or a converted radio within a supported access point. A wireless sensor overlay network can be deployed to provide 24/7 monitoring of your wireless environment; as a rule of thumb, we say one sensor for every four access points. This 1:4 rule works well for analyzing and troubleshooting your existing wireless network, but when deploying a WIPS for security protection as well, more sensors may be required for areas where you do not currently have wireless coverage but are still at risk from rogue devices.
Converting one of the radios in a dual radio access point to be a dedicated wireless sensor removes the need to install both types of device, that is, wireless sensors and access points. Dual radio access points can support both 2.4 GHz clients and 5 GHz clients; however, when converting one radio to be a dedicated wireless sensor, the access point will only be able to support clients in one frequency band (either 2.4 GHz or 5 GHz). Because of this limitation, vendors such as Motorola supply tri-radio access points where one radio is used as a dedicated 24/7 wireless sensor and the other two radios provide wireless access, one at 2.4 GHz and the other at 5 GHz.
WIPS monitor the wireless environment and trigger alarms, which can in turn raise a notification against a whole host of different security and performance-related events. As well the detection of security events, a WIPS system can take action to mitigate the threat. For example, a sensor could turn from passive monitor to active transmitter and start transmitting deauthentication frames to nullify the risk from rogue devices; alternatively, if a rogue access point is detected as being connected to the wired network, the WIPS server could communicate with the switch via Simple Network Management Protocol (SNMP) and disable the port to which the access point is connected.
For the majority of the time, WIPS sensors perform channel scans, providing an overview of the wireless environment. However, advanced forensics and analysis features of WIPS software can fix the channel on a particular sensor, allowing it to capture all traffic from a particular station. Figures 12-40 and 12-41 show the Forensic Analysis and Live View modules from AirDefense where detailed analysis can be performed on a particular station. Many wireless sensors can be configured to perform full packet capture, which is very useful when troubleshooting a problem at a remote location. The captured packets either can be analyzed in the WIPS’s own analysis module or can be saved to a file and opened in your preferred network analyzer.
Figure 12-40: AirDefense forensic analysis

Figure 12-41: AirDefense live view
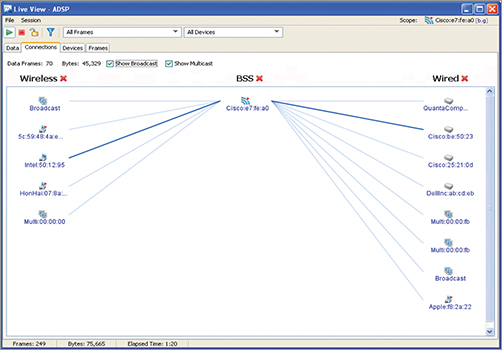
Wired Analysis
Wireless analysis alone will often not provide you with enough information, and analysis of the wired network is also required. This is especially the case when encryption is used on the wireless network. If you want to troubleshoot layer 3–7 protocols on an encrypted wireless network, you would either have to be able to decrypt the wireless traffic or capture the data in the wired network.
To capture data frames traveling to or from the wireless network, you must first identify where on the wired network the required traffic will be visible and second decide on how you are going to get access to the traffic. The obvious answer to the first question is the point where an access point connects to the wired LAN. Although placing an analyzer behind the access point will work for autonomous access points, it will be no good for access points that send all their packets back to a wireless controller/switch over an encrypted tunnel. In these cases, the best place would be the wireless controllers’ network uplink connection.
Having identified the best location for capturing your unencrypted data packets, you must now consider how you are going to get the packets into your network analyzer buffer. Where and how do you connect your network analyzer? If you wanted to place your analyzer behind an access point to monitor all traffic flowing to and from the access point, one easy option would be to place a network hub between the access point and its network connection. You would then connect your analyzer to the hub. Because a network hub forwards all packets out on all ports, you will see all traffic traveling to and from the access point. The main disadvantage with this method is that you have to break the access point’s network connection in order to place and remove the hub. When placing a hub in-line with a PoE powered access point, if there is not already a PoE injector between the hub and access point you will need to insert one.
It is getting increasingly hard to buy a true network hub. That is to say, not all hubs are hubs. Many modern devices that are sold as network hubs are really just small unmanaged switches and therefore do not forward all traffic out of all ports and are no good for network analysis. So if you have any old network hubs lying around, do not throw them away, because they are useful for network analysis, and you might find it hard to find another one.
Many 802.11n access points have gigabit Ethernet ports. When connected to a 10/100 Mbps network hub, 802.11n access points will autonegotiate down to a 100 Mbps half-duplex connection. For a highly utilized wireless network, this may cause a bottleneck and could result in dropped packets.
An alternative traffic access approach would be to span or mirror the switch port connected to the access point or controller. Having connected the network analyzer to a spare port on the network switch, port spanning (sometimes called port mirroring) can be configured to send a copy of all traffic traveling on the access point’s port on the switch to the analyzer’s switch port. Port spanning is often a good way to access the wireless controller’s traffic because disconnecting the wireless controller in order to place a network hub could potentially disrupt the entire wireless network. Because network hubs are only 10/100 Mbps half-duplex devices, it is very likely that they would not be able to cope with the volume of traffic traveling to and from the wireless controller on a large network.
The wireless controller might have more than one connection to the wired network. Some switch vendors allow multiple ports to be spanned onto the analyzer’s port, providing that the total volume of traffic does not exceed the bandwidth of the analyzer’s port. If the switch does not allow multiple ports to connect to one span port or the controller is physically connected to different switches, the alternative is to configure multiple span sessions and aggregate their captures together. In just the same way as with the multichannel aggregator, multiple Ethernet adapters can be configured to capture their packets into the same capture buffer.
One disadvantage of port spanning is the extra load added to the switch’s back plane. When spanning busy network connections, the extra traffic caused by port spanning could also cause the switch to drop packets. Typically, switch vendors allow only one or two span sessions per switch. An alternative approach is to use a network tap. Passive network taps sit in line and send a copy of the data to a separate port for the network analyzer. Network taps may at first sound a bit like going back to the idea of a hub; however, a tap is a dedicated device designed to provide monitoring tools access and has the following advantages:
- The traffic on 1 Gig and 10 Gig links can be accessed through a network tap.
- Because the device is a completely passive device, should the device fail, the link will continue to work.
- Network taps are designed to be permanently installed in locations where you would want to monitor regularly.
Wireless encryption does not render the wireless analysis useless, because all wireless specific information is still transmitted “in the clear.” All 802.11 management and control frames are transmitted unencrypted, and the 802.11 MAC header of every frame is also transmitted unencrypted. Therefore, wireless specific issues can still be effectively troubleshooted on encrypted networks.
802.11w: Protected Management Frames
The 802.11w amendment published by the IEEE in 2009 increases the security of management frames. This builds on the security mechanisms defined by the 802.11i amendment and applies them to certain management frames such as deauthentication and disassociation frames. This helps to thwart certain denial of service (DoS) attacks. From an analysis point of view, it will mean that more of your wireless traffic is now encrypted.
Wired and Wireless Analysis
There are times when you might want to monitor both the wired and wireless networks simultaneously. This could be achieved through the use of a separate wired and wireless analyzer or alternatively by using an analyzer that supports both wired and wireless capture. One example when you might want to capture both wireless and wired traffic is when analyzing 802.1x/EAP authentication problems. If a client cannot authenticate, you need to determine where the problem lies. This could be a problem with any of the following:
- Incorrectly configured client
- Incorrectly configured access point
- Incorrectly configured RADIUS server
To correctly identify where the authentication procedure is failing, you must analyze both the access point’s conversation with the client and the access point’s conversation with the RADIUS server. Figure 12-42 pictures both a wired and wireless capture of an 802.1x/EAP authentication exchange in OmniPeek.
Figure 12-42: Wired and wireless analysis

System Logs
Before we finish the discussion of protocol analysis, we’ll cover how the information contained within system logs can help support protocol analysis in the troubleshooting process. Most network systems and devices produce log files or messages. The information within these log files and messages can help the analyst get to the root cause of a problem. Many Windows applications write error messages to the log files found in Event Viewer. Figure 12-43 shows the System log in Event Viewer with some TCP/IP network events written to the log file by the network adapter driver.
Figure 12-43: Windows Event Viewer, System log

Many applications and network devices generate their own log files and often can generate syslog messages. syslog allows network devices and applications to send their system messages to a syslog server that handles the reporting and analysis, providing the network manager with a centralized location for all logs.
If you take the example of analyzing an 802.1x/EAP authentication exchange from the previous section, you can see how protocol analysis and logs can be used together to troubleshoot a network problem. A client’s authentication is failing, and when analyzing the conversation between the access point and the RADIUS server, you can see the access point send the initial access request to the RADIUS server. However, no response is received, not even a error message. Having confirmed that the message is going to the correct IP address and after confirming that the RADIUS service is running on the server, the RADIUS logs would be the next obvious place to look. When looking at the log file, you notice that the RADIUS server is reporting a silent disconnect, indicating that it has received an “access request” message from an invalid network access server (NAS), in this case the access point. This would suggest that the access point is not known to the RADIUS server. After looking at the server configuration, you can see that an entry for the access points exists. However, the access point’s IP address has been entered incorrectly. In the previous example, by using both protocol analysis and the information in the log file, you were able to identify that it was the RADIUS server not responding and then quickly identified the area where the configuration error was.
The consolidation of syslog messages on a syslog server can help speed up the troubleshooting process. Along with syslog messages from wireless controllers, access points, and RADIUS servers, expert events and alarms from a protocol analyzers can be sent as syslog messages to a syslog server. Therefore, the information from different systems can be correlated together to form a more complete and system-wide view of network issues.
This chapter has looked at how a protocol analyzer works, discussing how a customized driver needs to be installed in order to place an 802.11 wireless adapter into RF monitor mode, allowing it to become a passive monitoring adapter. The common options available when configuring a wireless capture were discussed, including the difference between fixed channel analysis and performing a channel scan.
The following analyzer features and their uses were outlined:
- Protocol decodes
- Peer map functions
- Conversation analysis
- Filtering: capture and display
- Expert functions
- Performance analysis
- Reporting capabilities
The chapter also investigated how both the QoS and calls of VoWiFi systems can be analyzed. The problem of analyzing a roaming client using just one capture adapter was identified, and the solution of using multiple adapters and a multichannel aggregator was defined. The way distributed analysis addresses many of the shortfalls of portable analysis was discussed, along with a description of the different approaches and architecture available to achieve a distributed analysis environment.
The chapter concluded with a look at how both wired analysis and system logs can aid a wireless network analyst in troubleshooting network problems.
Understand the installation and configuration of a protocol analyzer. Know how to install a customized analysis driver and understand that the customized driver places the wireless capture adapter into a special mode called RF monitor mode. Understand the different capture options available and that channel scanning can be used to gain a good understanding of your wireless environment. For detailed analysis, a fixed channel should be configured.
Define generic features common to 802.11 protocol analyzers. Describe the functions of the following common analyzer features: protocol decodes, peer map functions, filtering, and expert systems.
Understand expert analysis and troubleshooting methodologies. Understand how expert events can provide the network analyst with a starting point for further detailed analysis. Demonstrate how filtering can be used to select the packets that are of interest and how conversation analysis is applied to troubleshoot the problem.
Define VoWiFi and roaming analysis procedures. Understand the VoIP-specific features of a protocol analyzer and when you would use them. Know that troubleshooting QoS is an end-to-end task and will involve wired analysis too. Explain how multichannel aggregation enables effective roaming analysis.
Explain distributed wireless analysis. Explain the benefits of distributed analysis over portable analysis. Understand the difference between a wireless probe and remote engine.
Understand the use of system logs in troubleshooting. System logs can provide additional and supporting information to the troubleshooting procedure. Understand how a syslog server can consolidate log information from many different networking tools and devices into one centralized location.
| buffer size | packet slicing |
| capture filters | peer map |
| channel scanning | port spanning |
| display filters | protocol decodes |
| distributed analysis | remote engine |
| expert analysis | RF monitor mode |
| fixed channel analysis | R-Factor |
| heuristic-based expert analysis | threshold-based expert analysis |
| Mean Opinion Score (MOS) | wireless probe |
| multichannel aggregation | wireless sensor |
| network interface card (NIC) |
1. Network analyzers place the wireless adapter into which mode?
A. RF monitor
B. RF capture
C. RF sniff
D. RF scan
2. Channel scanning is the best option when doing which of the following? (Choose all that apply.)
A. Performing conversation analysis
B. Summarizing the wireless environment
C. Detailed troubleshooting
D. Reporting the overall security and performance of a wireless network
3. Having the wrong country code configured could cause which of the following problems?
A. The protocols decodes to be in the wrong language
B. The wrong number of channels available
C. The protocol analyzer software to crash
D. Your access points to switch channels
4. Which of the following are true regarding packet slicing? (Choose all that apply.)
A. Reduces the size of capture files
B. Can be configured to capture only the header information, disregarding the data
C. Is required when performing distributed analysis over a WAN connection
D. Removes unwanted packets from the capture buffer
5. How is a protocol decode window most commonly laid out?
A. The OSI layers go from high to low as they travel down the decode window with packet information at the top.
B. The OSI layers go from high to low as they travel down the decode window with packet information at the bottom.
C. The OSI layers go from low to high as they travel down the decode window with packet information at the top.
D. The OSI layers go from low to high as they travel down the decode window with packet information at the bottom.
6. Which of the following security solutions settings could be configured into the analyzer to enable encrypted packets to be decrypted? Choose all that apply.
A. PEAP
B. WEP
C. PSK
D. EAP-FAST
7. In a peer map, lines between nodes show what?
A. The access points to which a roaming client has associated
B. The wired infrastructure
C. The VLAN that each wireless clients is in
D. Communication between stations
8. Which of the following are common protocol analyzer features? Choose all that apply.
A. Peer map
B. Filtering
C. RADIUS authentication service
D. Expert analysis
9. Which of the following best describes expert analysis?
A. The automatic detection of network events, errors, and problems by an analyzer
B. The removal of unwanted traffic from the capture buffer
C. The visual representation of which STAs are communicating with each other
D. The collection of network statistics based upon the captured packets
10. What does heuristic-based expert analysis do?
A. Collects network statistics and compares them to configured threshold values
B. Looks for patterns in the traffic flow and compares them to a set of rules
C. Automatically performs active attacks against rogue devices
D. Uses SMNP to monitor wireless infrastructure
11. Which two elements of a VoWiFi network can be analyzed on an encrypted network?
A. Per-call MOS-quality metrics
B. Signaling
C. QoS tagging
D. Roaming
12. Where in the packet can you see its access category?
A. QoS Control Field
B. WMM Information Element
C. IP Header
D. Frame Body
13. An MOS score of 4 indicates what level of quality?
A. Excellent
B. Good
C. Fair
D. Poor
E. Bad
14. Which of the following is true regarding voice calls?
A. Both directions of the call are carried in the same RTP session and therefore will have the same MOS scores.
B. Both directions of the call are carried in the same RTP session but can have different MOS scores.
C. Each direction of a call is carried in a separate RTP session and therefore may have different MOS scores.
D. Each direction of a call is carried in a separate RTP session but will always have the same MOS score because they belong to the same conversation.
15. Multichannel aggregation performs which of the following tasks?
A. Allows separate captures to be created from different capture adapters within the same analyzer
B. Takes capture streams from multiple adapters and aggregates them together into one capture
C. Enables a signal capture adapter to capture up to three separate channels simultaneously
D. Simultaneously connects to several remote probes configured for different channels
16. Which of the following are common roaming problems? Choose all that apply.
A. Too little cell coverage overlap
B. Too much cell coverage overlap
C. Free space path loss
D. CSMA/CA
E. Hidden node
17. What are the advantages of distributed analysis over portable analysis? Choose all that apply.
A. Remote off-site analysis
B. Real-time decodes
C. Expert analysis
D. Enterprise-wide statistics
18. To confirm that the wireless QoS priorities are being preserved on the wired network, you decide to capture the traffic traveling to and from the network uplink on your wireless controller. You do not want to disrupt the operation of the wireless controller by breaking its network connection. What method should you use to obtain a copy of the wireless controller’s traffic?
A. Place a network tap in line with the wireless controller.
B. Use a wireless analysis to capture the packets from the air.
C. Place a network hub in line with the wireless controller.
D. Configure port spanning on the switch connected to the wireless controller.
19. As the expert in wireless analysis within your company, you are sent a unfiltered trace file from a colleague who captured the file at a site were users where unable to authenticate to the wireless network. The trace files consist of more than 5,000 packets, and 70 percent of trace file is made up of beacon, probe request, and probe response frames. What is one the first things you would do?
A. Configure a display filter to hide any unwanted traffic.
B. Ask your colleague to take another capture, with filters configured to remove beacon, probe request frames, and probe response frames.
C. Reconfigure the access points with a greater beacon interval.
D. Start looking through each packet decode in turn, looking for anything unusual.
20. Address filters can select traffic based on which of the following? (Choose all that apply.)
A. IP address
B. MAC address
C. Subnets
D. Switch port
1. A. Wireless analyzers place the NICs into a special mode called RF monitor mode; in this mode, the card becomes a passive monitoring device and cannot transmit, and therefore normal wireless network operation is disabled.
2. B, D. Wireless scanning provides a good overview of the wireless environment, showing which wireless devices are transmitting on which channels and which security protocols they are using. WIPS sensors perform channel scanning to provide a consolidated view of wireless security and performance.
3. B. After installing a customized analysis driver, you might find that you have the wrong number of channels available within your wireless analyzer. This is likely to be because the driver is configured with an incorrect country code.
4. A, B. Packet slicing allows you to just capture the first so many bytes of each packet, disregarding the rest of the frame. Often the only information you are interested in is the header information, and you do not have any interest in the data elements of the packets. Because packet slicing reduces the size of capture files, you can store a significantly larger number of packets to disk.
5. C. The protocol decode window is arranged with the lower layers of the OSI seven-layer model at the top. As you travel down the window, the layers go up. At the very top of the decode window is the packet information section.
6. B, C. When a preshared key is used to encrypt traffic, such as WEP, WPA-PSK, or WPA2-PSK, some analyzers allow this key to be entered into the analyzer’s configuration to decrypt packets, displaying the protocol decodes as if no encryption had been used.
7. D. A peer map is a visual representation of which STAs are communicating with each other. Lines between peers indicate communication.
8. A, B, D. The following are all common protocol analyzer features: protocol decodes, peer map functions, filtering, and expert functions.
9. A. Expert analysis is the automatic detection of network events, errors, and problems by an analyzer.
10. B. Heuristic-based expert analysis looks for patterns in the traffic flow and compares them to a set of rules. Traffic that does not conform to these rules is reported.
11. C, D. Although you cannot analyze VoIP calls and their signaling on an encrypted network, you can still analyze two import requirements for voice on a wireless network: QoS tags and fast efficient roaming.
12. A. By looking at the QoS Control field, you can confirm that the packet is being transmitted using the correct access category (AC).
13. B. The mean opinion score (MOS) is a value from 1 to 5, which indicates the perceived quality of a call. 5 = Excellent, 4 = Good, 3 = Fair, 2 = Poor, and 1 = Bad.
14. C. Because each direction of a call is carried in a unique RTP session, each RTP session will have its own quality metrics. When voice quality problems occur, you might find one direction has a good MOS score and the other direction is poor.
15. B. Multichannel aggregation takes capture streams from multiple adapters and aggregates them together into one capture. Each adapter can be configured for a different channel.
16. A, B. Roaming problems will occur if there is not enough overlap in cell coverage. Too little overlap will effectively create a roaming dead zone, and connectivity may even temporarily be lost. If two RF cells have too much overlap, a station may stay associated with its original AP and not connect to a second access point even though the station is directly underneath the second access point.
17. A, D. Distributed analysis enables wireless probes to be installed at remote locations, and instead of going on-site when a problem occurs, the analyst can simply launch their protocol analyzer. Instead of selecting a local adapter, they can select the remote probe as their capture adapter. Wireless sensors that monitor the wireless environment 24/7 and send their statistics to a centralized server can be deployed across the entire enterprise, providing a consolidated view of wireless security and performance statistics.
18. D. Having connected the network analyzer to a spare port on the network switch, port spanning (sometimes called port mirroring) can be configured to send a copy of all traffic traveling on the wireless controller’s port to the analyzer’s port. Port spanning is often a good way to access the wireless controller’s traffic because disconnecting the wireless controller in order to place a network hub or tap could potentially disrupt the entire wireless network.
19. A. Because clients are reporting an authentication problem, hiding all nonauthentication traffic using a post capture filter would provide a way for the analyst to see clearly just the packets of interest.
20. A, B, C. Address filters allow the selection of traffic based upon physical (MAC) or logical (Network layer) addresses. As well as individual addresses, address filters allow the use of wildcard entries, which enable the selection of IP subnets.