
Chapter 3
Polymorphism
Polymorphism, as applied to the solid state, can be defined as the ability of the same chemical substance to exist in different crystalline structures (Findlay et al. 1951) (regular, repeating arrangement of atoms or molecules in the solid state). The different structures are generally referred to as polymorphs, polymorphic modifications, crystal forms, or forms (Verma and Krishna 1966). Strict adherence to this definition of polymorphism excludes solvates and hydrates (specific water solvate) as polymorphs because they correspond to different chemical substances. Solvates and hydrates are sometimes referred to as pseudopolymorphs. Molecule A is a different chemical substance than molecule A coordinated with a solvent. Similarly, when molecule A forms salts or co‐crystals, its salts or co‐crystals are considered as different chemical substances from molecule A. Also, salts or co‐crystals can form pseudopolymorphs.
3.1 PHASE RULE
This difference is further reinforced by application of The Phase Rule to the equilibrium between two strictly defined polymorphs of a compound or the equilibrium between a compound and a corresponding solvate of that compound. In the former case; there is only one component (in The Phase Rule sense—the compound), there are two phases (the two polymorphs) and therefore, there is only one degree of freedom for equilibrium between two polymorphs by application of The Phase Rule equation.
where F is the degrees of freedom of the system (number of variables that must be specified to define the system at equilibrium, such as temperature, pressure, concentrations, etc.), C is the number of components and P is the number of phases. In the solvate case there are two components (the compound and the solvent), there are, again, two phases (the compound and the solvate of the compound); therefore there are two degrees of freedom in this situation. In characterizing the equilibrium of a compound and a solvate of that compound more information are required to define the equilibrium situation than for the case of equilibrium between two strictly defined polymorphs. For instance, both the temperature and composition of the solvate (mono‐, disolvate, etc.) are required to specify the equilibrium state between a compound and a solvate of that compound, whereas only the temperature would be required to specify the equilibrium state between two polymorphs. However, to exclude solvates from a discussion of crystallization is not realistic. But the distinction between polymorphism and solvation is clear and has implications, both practical and theoretical that must be distinctly considered. For the case of crystallization, when molecule A crystallizes out from the solution during the crystallization, the dissolved molecule A in the solution exists as different phase from the crystalline solid of molecule A.
3.2 PHASE TRANSITION
3.2.1 Enantiotropy and Monotropy
There are two types of polymorphism from the thermodynamic viewpoint, enantiotropy and monotropy. With monotropic forms, one polymorph is the stable‐solid modification over the entire temperature range up to the melting point and therefore, there is no real transition point below the melting point region. A virtual or extrapolated transition point above the melting point results from thermodynamic consideration for monotropic polymorphs. With enantiotropic crystal forms, there is a reversible transition point (equilibrium point) at some temperature below the melting point of either polymorph and therefore, both polymorphs have a definite range of temperature over which they are the thermodynamically stable solid phase below the melting point of either polymorph. Parenthetically, it should be pointed out that when the word stability is used in the context of a discussion on polymorphism, it refers to thermodynamic stability (Gibbs’ free energy) and not to reactive or degradative stability.
3.2.2 Metastable Equilibrium and Suspended Transformation
In the real world, the transition or equilibrium point between two enantiotropic polymorphs is often not directly observed because of the occurrence of suspended transformations in connection with metastable equilibrium. Measurement of various physical properties at different temperatures can be related to the relative free energy of the polymorphs and classification of the forms as enantiotropic or monotropic can be accomplished.
The concepts of metastable equilibrium and suspended transformations are extremely important in any practical understanding of polymorphism. Metastable equilibrium can be defined as a state which will exist for some time period without change, even though a more stable state does exit (Findlay et al. 1951; Zernike 1955). This is distinct from unstable equilibrium that results in spontaneous and instantaneous change. A suspended transformation is one that should occur on the basis of the thermodynamic considerations, but does not because of kinetic factors. Suspended transformations must and do result in metastable states. Without metastable equilibrium and suspended transformations, polymorphism would not be as significant an issue as it is.
Closely allied with the concepts of metastable equilibrium and suspended transformations is Ostwald’s Rule (Ostwald’s Step Rule or “Law” of Successive Reactions). Essentially Ostwald’s Rule states that in all processes it is not the most stable state with the least amount of free energy that is initially obtained but the least stable state lying nearest to the original state in free energy (Ostwald 1897). It is easy to see how this rule and the concept of suspended transformations can explain the production of metastable polymorph through crystallization from a melt or solution.
3.2.3 Measurement
Detection and characterization of polymorphs and/or solvates rely on various experimental techniques. X‐ray powder diffraction (XRPD), solid state NMR, solid state IR, and solid state Raman are useful in demonstrating differences in the solid state. Thermal analytical techniques, including differential thermal analysis (DTA), differential scanning calorimetry (DSC), and thermogravimetry (TG), are also useful in indicating differences in the solid state and can be helpful in distinguishing polymorphs from solvates and hydrate. Gas chromatography and element analysis are also helpful in differentiating polymorphs and solvates. Solution calorimetry and microscopy, both electronic and optical, have also been extensively used. There are many other experimental techniques that have been employed in the study of polymorphism and solvates. A complete list of experimental techniques is almost impossible. The choice of experimental techniques can be highly individualized and dependent on the investigators’ scientific background. Some techniques, however, are almost universally used by experimenters because of their convenience and wide spread availability.
DTA and DSC are particularly useful in determining the relative stability of polymorphs in the temperature region of the melting points of the polymorphs. The higher melting polymorph is clearly the more thermodynamically stable form in the temperature region of the melting points. In the absence of an observable endothermic transition with increasing temperature between polymorphs with DTA or DSC, it is not possible from the melting points alone to ascertain the relative stability of the polymorphs in the lower temperature range (i.e. room temperature). Measurement of the heats of fusion (ΔHf) of the polymorphs with DSC or quantitative DTA or other suitable methods can give a good indication of which polymorph is most likely to be the more stable one at lower temperatures. The polymorph with the higher ΔHf is most likely the more stable form at lower temperatures. If the higher melting polymorph also has the higher ΔHf than that polymorph is almost certainly the most stable one at all lower temperature and then under these conditions the polymorphs would be related as monotropic polymorphs excluding any extremely non‐regular thermodynamic behavior. If the lower melting polymorph has the higher ΔHf then there will be a transition point between the two forms at some lower temperature and that makes these forms enantiotropic polymorphs, again excluding any extremely non‐regular thermodynamic behavior. This type of reasoning has been formularized into The Heat of Fusion Rule, which was proposed by Burger and Ramberger (1979).
The following equation can be used to estimate the transition temperature for two polymorphs.

where To’s are the melting points of the forms in absolute or Kelvin degrees and the subscripts I and II refer to the two polymorphs. If the resulting temperature is higher than either melting point, the polymorphs are monotropic. If the calculated temperature is lower than the polymorphs are enantiotropic. Of course, Eq. (3.2) involves some assumptions, such as the heat of fusion being constant with temperature. A more extensive formulation for inferring the stability relationship of polymorphs has been proposed (Yu 1995) that attempts to eliminate certain assumptions used in developing Eq. (3.2).
An alternative method of ascertaining the relative stability of polymorphs at lower temperatures and that can also provide some practical data that could be used in designing efficient crystallization processes, is through the measurement of the solubility of the forms as a function of temperature under non‐converting conditions. The following series of chemical equations along with the corresponding free energy relationships will illustrate the reasoning behind the solubility approach.
Equation or Reaction (3.3) corresponds to solid polymorph I in equilibrium with its saturated solution with a corresponding solute activity of aI. The free energy change (ΔG) for this reaction is zero because it is at equilibrium. Reaction 3.4 is a concentration or dilution of the solution of the compound with an activity of aI to a solution with an activity of aII. The ΔG for this reaction is related to the activity ratio and is equal to RT ln(aII/aI). The next reaction is another equilibrium reaction but this time between solid polymorph II and its saturated solution of activity aII. The free energy change is again zero. The sum of these three reactions yields the reaction of solid polymorph I to solid polymorph II. The free energy change for the conversion is the sum of the ΔG’s for the three preceding reactions and is equal to RT ln(aII/aI). If the solutions are assumed to be ideal then the relative activities (aII/aI) can be equated with the relative solubilities (SII/SI). If SII/SI is greater than one then polymorph II is less stable than polymorph I. If the solubility ratio is less than one then polymorph II is more stable than polymorph I. The solubility determinations must be made under conditions where no conversion of the solid phase occurs. Experimentally, this requires that the solid phase, after a suitable equilibration period with the saturated solution, be examined experimentally by a method that can distinguish the polymorphs, such as XRPD or solid state NMR, etc. Simultaneous measurement of the concentration of the compound in the saturated solution provides the solubility under the conditions of the experiment. The sublimation pressure of the polymorphs at any given temperature can also be used to decide which polymorph is the more stable one. However, sublimation pressures of solids are usually low and more difficult to measure experimentally than solubility.
3.3 PREDICTION OF CRYSTAL STRUCTURE AND ITS FORMATION
Increasing awareness of the importance of polymorphism and related issues, particularly to the pharmaceutical arena, has led not only to heightened regulatory surveillance but to expanded scientific activity. There is extensive activity in the areas of detection, classification, isolation, and also in the domain of a priori prediction of possible crystal structures and related energy calculations that then attempt to anticipate polymorphism for individual chemical compounds.
Many publications on the prediction of polymorphs are appearing each year, reflecting the level of interest in and importance of this field, for example Myerson (1999), Vippagunta et al. (2001), Neumann et al. (2008), Tiekink et al. (2010), Kendrick et al. (2011), Price (2013, 2014, 2018), Pantelides et al. (2014), Abramov (2016), and Hilfiker and Raumer (2018). These approaches can generally fall into two categories—equilibrium and kinetic approaches
3.3.1 Equilibrium Approach
Equilibrium approach, or equivalently Crystal Structure Prediction (CSP) is a computational technique to find the crystal structure of an organic molecule with minimization of Gibbs free energy of solid state. Starting from the chemical diagram, the crystal structures are those which are stable or metastable at the given temperature, pressure, and composition; as such they correspond to the local minima in the free energy surface with relatively low values of the Gibbs free energy, G. Mathematically, it can be expressed as

where U is the internal energy of the crystal, P is the pressure, V is the volume, T is the temperature, and S is the entropy on a molar basis.
The minimization of G is carried out with respect to the crystal structure variables, a, b, c, α, β, γ, which are the unit length and angles of the unit cell, and θ which represents the orientation of molecules in the unit cell as illustrated in Figure 3.1.
The entropic contribution TS is typically omitted. Making use of this simplification in principle assumes a temperature at absolute 0°K. The work term PV can also be omitted. Making use of this simplification in principle assumes a full vacuum with zero pressure. With these assumptions, the above equation can be simplified as

U (or Elattice) can consist of two terms. One is Eintramolecular which denotes the intramolecular conformation/orientation within the molecule, or sometimes it is expressed as ΔEintramolecular to denote the change of conformation of the molecule between the crystal and reference gas phases. The other is Eintermolecular which denotes intermolecular interaction energy among the molecules in the crystal structure, including ionic bond, hydrogen bond, dipole–dipole bond, and van der Waals dispersion. These interactions can distort the conformation of molecules. Such a distortion can only be energetically favorable in a crystal structure if Eintermolecular is lowered by more than the increase in Eintramolecular. Figure 3.2 illustrates few orientations of Caffeine molecules in the unit cell (Habgood 2011).

Figure 3.1 Crystal unit cell diagram, caffeine as model compound.
Source: Habgood (2011) with permission.

Figure 3.2 Caffeine molecule orientation in unit cell (looking down the C‐axis).
Source: Habgood (2011), with permission.
Crystal structure prediction thus explores all possible crystal packings of a given compound whereby hundreds or thousands of crystal structures are generated computationally, and their lattice energies calculated. Examples of isocaffeine and caffeine are shown in Figure 3.3a, b, respectively.
Figure 3.3a illustrates that among the hundreds or more of plausible structures predicted, there is one particular structure which shows noticeable energy gap of approximate 6 KJ/mol among all other structures. This one is marked in circle and was also experimentally observed to be the most stable form. For this scenario, it provides a great confidence for drug design and development in securing the most stable crystal form. On the other hand, Figure 3.3b highlights a group of four structures of minimum energy, with an energy difference within 1 KJ/mol among them. As discussed in Habgood (2011) and Price (2018), these structures represent three types of disorders of molecules stacked in the unit cell of form II, along with an experimentally observed form I. If a compound encounters such a scenario, it raises uncertainties about form stability, form conversion, and identification. Crystal structure prediction, coupled with experimental observation, would help significantly in the understanding of these structures, both experimentally and theoretically.
Learning the power of CSP in calculating the differences of lattice energy among hundreds of crystal forms, we would like to learn the actual lattice energy difference among the existing observed polymorphs, and more practically the solubility or stability difference among these polymorphs. Table 3.1 summarizes some findings of polymorphs found in the literature. As a reference, crystalline and amorphous solid are also included.
As shown in the table, the lattice energy difference between polymorphic pair is generally less than 2 KJ/mol, and the solubility ratio is generally less than twofold. Between the crystalline and amorphous solid, the energy difference is generally greater than 6 KJ/mol and the solubility ratio is greater than twofold. These findings are consistent with the calculations from CSP.
While a higher solubility may be beneficial for dissolution or bioavailability, it also has a higher lattice energy which means less solid stability. In the selection of solid form, the pros and cons of stability and solubility of solid form would need to be carefully evaluated.

Figure 3.3 (a) and (b) Crystal energy landscape for isocaffeine (a) and caffeine (b) with each diamond represents a crystal structure with a local minimum in Elattice.
Source: Habgood (2011), with permission.
Table 3.1 Difference of lattice energy and solubility among polymorphs and crystalline/amorphous solid.
| Lattice energy (Gibbs free energy) difference | Solubility ratio | |
|---|---|---|
| Polymorphs | 601 pairs of comparison; More than 50% pair < 2 KJ/mol; Less than 5% pair > 7.2 KJ/mol (Nyman and Day 2015) | 81 pairs; More than 80% pair < twofold; Less than 8% pair > fourfold (Pudipeddi and Serajuddin 2005) |
| Crystalline and amorphous solid (subcooled liquid) | 51 compounds; More than 50% > 6 KJ/mol; Less than 10% < 4 KJ/mol (Alhalaweh et al. 2015) | 5 compounds; all > twofold; Individually, the ratios are 2.5, 2.8, 8, 22, and 40; (Stukelj et al. 2019). |
3.3.2 Kinetic Approach
Another approach for differentiating the formation of crystal form is kinetic approach, i.e. relative nucleation rates of different crystal forms under supersaturation (Chen and Trout 2008; Davey et al. 2013; Parks et al. 2017). For the kinetic approach, it starts from the calculated crystal structures by the thermodynamic equilibrium approach from above, it then calculates the rate of formation of nuclei or cluster of each crystal form under varying supersaturation. The free energy profile of cluster is defined as a function of cluster size per classical nucleation theory, and the rate of formation or disappearance of cluster under certain supersaturation can be calculated based on molecular dynamic simulation.
A detailed discussion of classical nucleation theory is presented in Chapter 4—Kinetics, Section 4.2 Nucleation. In short, as shown in Figures 3.4 and 3.5, in a supersaturated solution, the free energy profile is nonlinear and exists a maximum at the critical cluster size. As expressed in Eq. (3.9), the magnitude of this energy barrier ∆G depends upon change of chemical potential between solid and liquid ∆μ, which is directly proportional to the degree of supersaturation, and interfacial free energy σ, which is directly proportional to surface tension.

Figure 3.4 Free energy profile as a function of nucleus/cluster size.

Figure 3.5 Energy barrier of α and β crystals
Source: Parks et al. (2017) with permission Royal Society of Chemistry.
In short, the higher the supersaturation ∆μ, the lower the barrier. The higher the surface tension σ, the higher the barrier. In addition, the nucleation rate is affected by the solute diffusivity as described in Eq. (4.1) of Chapter 4.
Molecular dynamic simulation can be applied to simulate the trajectory of cluster size under different supersaturations. When the cluster reaches its critical size, it will have 50/50 chance of either growing or disappearing (Parks et al. 2017). Using glycine as a model compound, Parks et al. (2017) successfully demonstrates that α crystal form has a lower energy, is more stable, and has a lower solubility than that of β crystal form as shown in Figure 3.5. But since β crystal form has a lower surface tension (~70% lower) and a faster diffusivity (~25% faster) than those of α crystal. Therefore, β crystal has a lower energy barrier, and it results in faster nucleation rate than that of α crystal form as shown in Figure 3.6.
The learning from kinetic approach offers additional fundamental insights in understanding the formation of metastable form, and subsequent transformation of metastable form into the stable form. Under supersaturation, to accelerate the formation of crystals, including metastable forms, stable form, and especially transformation from metastable forms to stable form, it is desirable to
- minimize surface tension
- maximize diffusivity
If the goal is to generate the metastable forms without transforming into the stable form, it would be necessary to maximize the surface tension and minimize the diffusivity after the formation of metastable form.
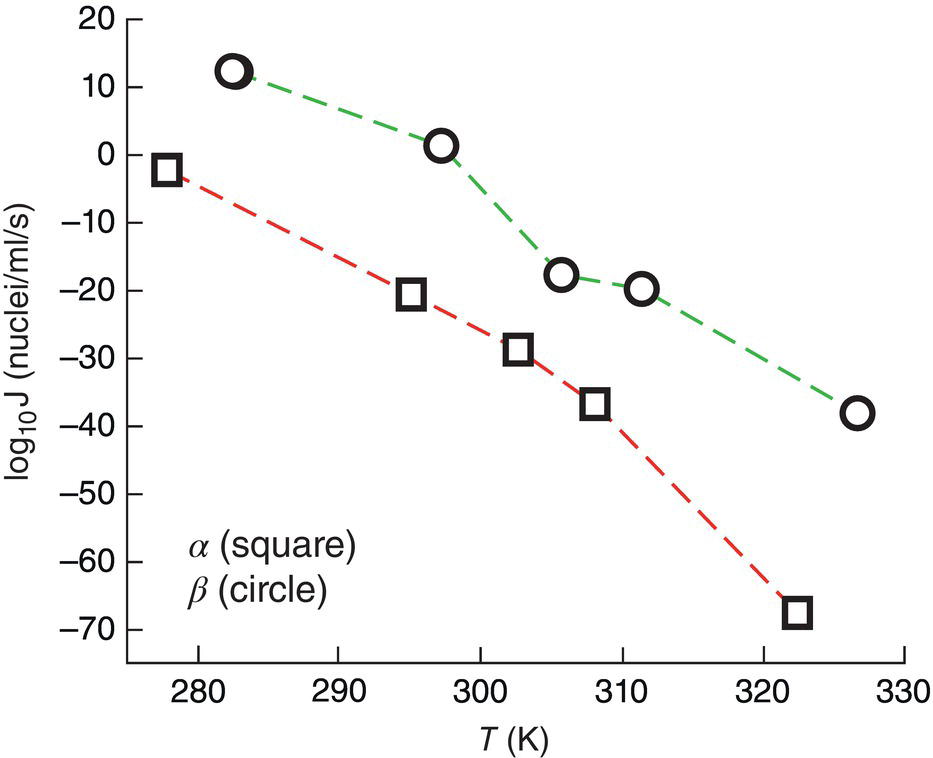
Figure 3.6 Nucleation rate of α and β crystals.
Source: Parks et al. (2017) with permission Royal Society of Chemistry.
Experimentally, variables such as solvents, additives and process impurities, can either increase or decrease the surface tension of different crystal forms. Increasing the temperature would decrease the surface tension and increase the diffusivity. Increasing the mixing intensity, for example high shearing rotor–stator homogenizer or sonificator, would greatly accelerate the diffusivity and facilitate the formation of crystal forms, including the transformation to stable form.
3.4 SELECTION AND SCREENING OF CRYSTAL FORMS
3.4.1 Selection Criteria
Proper selection of crystal forms plays a critical role in the development of drugs. Crystal form affect multiple critical quality attributes of drugs, including
- Purity, such as impurities rejection during crystallization and removal of residual solvent during drying.
- Stability, such as chemical decomposition, crystal form conversion, moisture absorption/desorption, and desolvation.
- Solubility and particle size, such as intrinsic dissolution rate (IDR) or bioavailability.
- Manufacturability, such as temperature, mixing, filtration, drying, and moisture control.
For pharmaceutical intermediates and final active pharmaceutical ingredients, achieving the desired purity is the first criteria. As a matter of fact, crystallization is considered to be the key unit operation to achieve such purification. As an example, a crystalline solid can reject many process impurities during the isolation of solid, whereas amorphous solid simply cannot. A salt or co‐crystal can effectively reject certain non‐ionized impurities, whereas a free molecule cannot. Also, some low melting crystalline forms may form gummy solid above certain temperature which leads to solvent trapping during crystallization and drying.
From the point of stability, both chemical and physical attributes should be considered. For example, if a water‐insoluble drug is unstable in acidic condition, co‐crystal can be a better choice than salt for improving the solubility. Also, hydrate, which contains water, may be more liable to chemical decomposition for molecules containing amide functional group. A metastable crystal form can convert to a more stable form. Also, solvate may be partially de‐solvated during drying and create content uniformity uncertainty.
Solubility can affect IDR which is directly related to bioavailability. Formation of salt or co‐crystal are known techniques to improve the aqueous solubility of water‐insoluble compounds. However, salt and co‐crystal can also encounter stability issues such as chemical decomposition and disproportionation during storage, formulation, and/or dissolution.
Manufacturability refers to the robustness and cost for manufacturing. If the manufacturing process is sensitive to certain process parameters, such as temperature range, moisture, or mixing configuration, it requires tight control of operation which will increase cost of manufacturing. A crystalline salt may offer excellent IDR or bioavailability, but it may require tight control of moisture during manufacturing and storage. Also, forming a salt via crystallization may require tight control of mixing to generate desired particle size with minimum particle agglomeration and/or impurity trapping.
3.4.2 Candidates for Forming Salts and Co‐crystals
Over the decades, pharmaceutical industry has built extensive knowledge and database on this area (Stahl and Wermuth 2011; Vioglio et al. 2017; Sun et al. 2020; Qiu and Stevens 2020; Guo et al. 2021, etc.).
To form the salts, in general, the pKa difference of 2 between the free molecule and counterion are acceptable. Table 3.2 presents a partial list of these candidates. As shown, the pKa values (based upon water) for those acid counterion candidates can range from −9 to 7. Typical cases include HCL salt, methansulfonic salt, oxalate salt, citrate salt, tartrate salt, etc.
Table 3.2 A partial list of acid counterion candidates for salt screening.
| Acid | Formula | pKa1 | pKa2 |
|---|---|---|---|
| Hydrobromic acid | HBr | −9 | |
| Hydroiodic acid | HI | −9 | |
| Hydrochloric acid | HCl | −6 | |
| 1,5‐Naphthalene‐disulfonic acid | C10H8O6S2 | −3.4 | −2.6 |
| Sulfuric acid | H2SO4 | −3 | −2 |
| (1R)‐(‐)‐10‐camphorsulfonic acid | C10H16O4S | −2.1 | |
| Ethanedisulfonic acid | C2H6O6S2 | −2 | −1.5 |
| Benzenesulfonic acid | C6H6O3S | −2 | |
| Ethanesulfonic acid | C2H6O3S | −2 | |
| Isethionic acid (ethanolsulfonic acid) | C2H6O4S | −1.7 | |
| Nitric acid | HNO3 | −1.3 | |
| p‐Toluenesulfonic acid (tosylic acid) | C7H8O3S | −1.3 | |
| Methanesulfonic acid | CH4SO3 | −1.2 | |
| 4‐Chlorobenzene‐sulfonic acid | C6H5ClO3S | −0.8 | |
| n‐Dodecylsulfuric acid | C12H26O4S | 0 | |
| 2‐Naphthalenesulfonic acid | C10H8O3S | 0.2 | |
| Picric acid | C6H3N3O7 | 0.4 | |
| Thiocyanic acid | CHNS | 1.1 | |
| d‐Camphorsulfonic acid | C10H16O4S | 1.2 | |
| Oxalic acid | C2H2O4 | 1.4 | 4.3 |
| Dichloracetic acid | C2H2Cl2O2 | 1.4 | |
| Maleic acid | C4H4O4 | 1.9 | 6.1 |
| Nicotinic acid (one form of vitamin B3) | C6H5NO2 | 2 | 4.9 |
| Phosphoric acid | H3PO4 | 2.1 | 7.2 |
| Pamoic acid (embonic acid) | C23H16O6 | 2.5 | 3.1 |
| Glutaric acid, 2‐oxo (α‐ketoglutaric acid) | C5H6O5 | 2.7 | 4.5 |
| 1‐Hydroxy‐2‐naphthoic acid | C11H8O3 | 2.7 | |
| Malonic acid | C3H4O4 | 2.8 | 5.7 |
| 3‐Hydroxy‐2‐naphthoic acid | C11H8O3 | 2.8 | |
| Citric acid | C6H8O7 | 2.9 | 4.2 |
| Gentisic acid | C7H6O4 | 2.9 | |
| Fumaric acid | C4H4O4 | 3 | 4.4 |
| Salicylic acid | C7H6O3 | 3 | 13.6 |
| Galactaric acid (mucic acid) | C6H10O8 | 3.1 | 3.6 |
| Tartaric acid | C4H6O6 | 3.2 | 4.8 |
| β‐D‐Glucuronic acid | C6H10O7 | 3.2 | |
| Lactobionic acid | C12H22O12 | 3.2 | |
| L‐Pyroglutamic acid | C5H7NO3 | 3.3 | |
| Malic acid | C4H6O5 | 3.4 | 5.1 |
| Mandelic acid | C8H8O3 | 3.4 | |
| Terephthalic acid | C8H6O4 | 3.5 | 4.5 |
| D‐Gluconic acid | C6H12O7 | 3.6 | |
| α‐Glucoheptonic acid | C7H14O8 | 3.6 | |
| Formic acid | CH2O2 | 3.7 | |
| Glycolic acid | C2H4O3 | 3.8 | |
| Hippuric acid | C9H9NO3 | 3.8 | |
| Lactic acid | C3H6O3 | 3.9 | |
| Oleic acid | C18H34O2 | 4 | |
| Ascorbic acid (Vitamin C) | C6H8O6 | 4.1 | 11.6 |
| Succinic acid | C4H6O4 | 4.2 | 5.6 |
| Benzoic acid | C7H6O2 | 4.2 | |
| 4‐Acetamidobenzoic acid | C9H9NO3 | 4.3 | |
| Adipic acid | C6H10O4 | 4.4 | 5.4 |
| Glutaric acid (pentanedioic acid) | C5H8O4 | 4.4 | 5.4 |
| Sodium hydrogen fumarate | C4H3NaO4 | 4.4 | |
| Sebacic acid | C10H18O4 | 4.6 | 5.6 |
| (+)‐Camphoric acid | C10H16O4 | 4.7 | 5.8 |
| Acetic acid | C2H4O2 | 4.7 | |
| Pentanoic acid (valeric acid) | C5H10O2 | 4.8 | |
| Palmitic acid | C16H32O2 | 4.9 | |
| Propanoic acid (propionic acid) | C3H6O2 | 4.9 | |
| Stearic acid | C18H36O2 | 4.9 | |
| Undecylenic acid | C11H20O2 | 4.9 | |
| Cholic acid | C24H40O5 | 5 | |
| Pivalic acid | C5H10O2 | 5 | |
| Lauric acid | C12H24O2 | 5.3 | |
| Orotic acid (pyrimidine‐carboxylic acid) | C5H4N2O4 | 5.8 | 9 |
| Carbonic acid | CH2O3 | 6.4 | 10.3 |
For the base counterion candidates, Table 3.3 shows that the pKa (of the conjugated acid) values can range from 14 to 7. Typical cases include Na salt, calcium salt, triethylamine salt, etc.
For amino‐acid counterion candidates, Table 3.4 shows that the pKa values of the carboxylic acid portion can range from 1.8 to 4, and pKa values of the conjugated acid (from the amine group) range from 12 to 9. Amino acid can act as acid counterion or base counterion. Typical cases include lysine salt, glycine salt, aspartate salt, etc.
Table 3.3 A partial list of base counterion candidates for salt screening.
| Base | Formula | pKa1 (conjugated acid) | pKa2 (conjugated acid) |
|---|---|---|---|
| Zinc hydroxide | H2O2Zn | 14 | 7.9 |
| Potassium hydroxide | KOH | 14 | |
| Sodium hydroxide | NaOH | 14 | |
| Choline hydroxide | C5H15NO2 | 13.9 | |
| Lithium hydroxide | LiOH | 13.8 | |
| Calcium hydroxide | H2CaO2 | 12.7 | 12.7 |
| Guanidine | CH5N3 | 12.5 | |
| Guanine | C5H5N5O | 12.3 | 9.2 |
| Cytosine | C4H5N3O | 12.2 | 4.5 |
| Magnesium hydroxide | H2MgO2 | 11.4 | 11.4 |
| Piperidine | C5H11N | 11.12 | |
| Triethylamine | C6H15N | 11.01 | |
| Diethylamine | C4H11N | 10.9 | |
| Tributylamine | C12H27N | 10.9 | |
| Benzathine | C16H20N2 | 10.7 | 6.5 |
| Ethylene diamine | C2H8N2 | 9.9 | 6.77 |
| Piperazine | C4H10N2 | 9.8 | 5.7 |
| Adenine | C5H5N5 | 9.8 | 4.1 |
| Diethylethanolamine | C6H15NO | 9.58 | |
| Triethanolamine | C6H15NO3 | 9.5 | 7.8 |
| Ethanolamine (olamine, 2‐aminoethanol) | C2H7NO | 9.5 | |
| Epolamine | C6H13NO | 9.4 | |
| Diethanolamine (diolamine) | C4H11NO2 | 9.28 | |
| Ammonium hydroxide | H5NO | 9.25 | |
| Deanol | C4H11NO | 8.8 | |
| Tromethamine | C4H11NO3 | 8.1 | |
| Procaine | C13H20N2O2 | 8.05 | |
| Meglumine (N‐methyl‐D‐glucamine) | C7H17NO5 | 8 | |
| Glucosamine | C6H13NO5 | 7.5 | |
| 4‐(2‐Hydroxyethyl)morpholine | C6H13NO2 | 7.2 |
Table 3.4 A partial list of amino acid counterion candidates for salt screening.
| Amino Acid | Formula | pKa | pKa (conjugated acid) | pKa (side chain) |
|---|---|---|---|---|
| Betaine | C5H11NO2 | 1.8 | 12.2 | |
| L‐Aspartic acid | C4H7NO4 | 1.9 | 9.6 | 3.6 |
| Ornithine | C5H12N2O2 | 1.94 | 8.65 | 10.76 |
| L‐Asparagine | C4H8N2O3 | 2 | 8.8 | |
| Proline | C5H9NO2 | 2 | 10.6 | |
| Threonine | C4H9NO3 | 2.1 | 9.1 | |
| L(+)‐Glutamic acid | C5H9NO4 | 2.1 | 9.7 | 4.1 |
| L‐Lysine | C6H14N2O2 | 2.2 | 8.9 | 10.5 |
| L‐Arginine | C6H14N4O2 | 2.2 | 9.04 | 12.48 |
| Serine | C3H7NO3 | 2.2 | 9.2 | |
| Methionine | C5H11NO2S | 2.3 | 9.2 | |
| Isoleucine | C6H13NO2 | 2.3 | 9.6 | |
| Valine | C5H11NO2 | 2.3 | 9.6 | |
| Alanine | C3H7NO2 | 2.3 | 9.7 | |
| Glycine | C2H5NO2 | 2.34 | 9.6 | |
| L‐Leucine | C6H13NO2 | 2.4 | 9.6 | |
| Creatine | C4H9N3O2 | 3.5 | 12.4 |
For co‐crystal co‐formers, as shown in Table 3.5, the range of candidates becomes broader. Conformer can include acid, base, acid–base combination, and pure aromatic molecules. In general, the pKa difference of less than 2 between the free molecule and conformer is feasible for making the co‐crystal.
Table 3.5 A partial list of coformer candidates for co‐crystal screening.
| Co‐crystal coformer | Formula | pKa1 | pKa2 | pKa1 (conjugated acid) | pKa2 (conjugated acid) |
|---|---|---|---|---|---|
| Oxalic acid | C2H2O4 | 1.4 | 4.3 | ||
| Saccharin | C7H5NO3S | 1.8 | |||
| Maleic acid | C4H4O4 | 1.9 | 6.1 | ||
| Malonic acid | C3H4O4 | 2.8 | 5.7 | ||
| Citric acid | C6H8O7 | 2.9 | 4.2 | ||
| Gentisic acid | C7H6O4 | 2.9 | 13.6 | ||
| Furamic acid | C4H4O4 | 3 | 4.4 | ||
| O‐Formylphenoxyacetic acid | C9H8O4 | 3 | |||
| 4‐Aminosalicylic acid | C7H7NO3 | 3.2 | |||
| Malic acid | C4H6O5 | 3.4 | 5.1 | ||
| Ascorbic acid | C6H8O6 | 4.1 | 11.6 | ||
| p‐Fromylphenoxypropionic acid | C10H10O3 | 4.1 | |||
| Benzoic acid | C7H6O2 | 4.2 | |||
| Succinic acid | C4H6O4 | 4.2 | 5.6 | ||
| 3,4‐Dihydroxybenzonic acid | C7H6O4 | 4.26 | |||
| 4‐Hydroxybenzoic acid | C7H6O3 | 4.4 | |||
| Adipic acid | C6H10O4 | 4.4 | 5.4 | ||
| Glutaric acid | C5H8O4 | 4.4 | 5.4 | ||
| Cinnamic acid | C9H8O2 | 4.5 | |||
| Vanillic acid | C8H8O4 | 4.5 | |||
| Sebaic acid | C10H18O4 | 4.7 | 5.5 | ||
| Myricetin | C15H10O8 | 6.6 | 7.6 | ||
| Quercetin | C15H10N7 | 7.2 | 8.3 | ||
| Hydroquinone | C6H6O2 | 9.9 | |||
| Thymol | C14H10O | 10.6 | |||
| Sucralose | C12H19Cl3O8 | 12.5 | |||
| Xylitol | C5H12O5 | 12.8 | |||
| Cytosine | C4H5N3O | 12.2 | 4.45 | ||
| Imidazolidinone | C3H6N2O | 11.8 | |||
| Ethylenediamine hydrate | C2H10N2O | 10.7 | 7.6 | ||
| Piperazine | C4H10N2 | 9.6 | |||
| 4‐Aminopyridine | C7H7NO2 | 9.2 | |||
| 4,4′‐Bipyridine | C10H8N2 | 4.8 | 3.2 | ||
| Nicotinamide | C6H6N2O | 3.3 | |||
| 4‐Aminobenzamide | C7H8N2O | 2.7 | |||
| Pyrazole | C3H4N2 | 2.5 | |||
| Phenazine | (C6H4)2N2 | 1.3 | |||
| Cyclamic acid | C6H13NO3S | −0.8 | −9.7 | ||
| Picolinic acid | C6H5NO2 | 1 | 5.5 | ||
| Lysine | C6H14N2O2 | 2.2 | 10.5 | 8.9 | |
| Glycine | C2H5NO2 | 2.34 | 9.6 | ||
| Nicotinic acid | C6H5NO2 | 2.8 | 4.8 | ||
| L‐Phenylalanine | C9H11NO2 | 2.83 | 9.13 | ||
| Neotame | C20H30N2O5 | 3.1 | 8.1 | ||
| Hippuric acid | C9H9NO3 | 3.59 | −1.3 | ||
| Sryingic acid | C9H10O5 | 3.9 | −4.6 | ||
| 4‐Aminobenzoic acid | C7H7NO2 | 4.8 | 2.7 | ||
| Theophylline | C7H8N4O2 | 8.6 | 3.5 | ||
| Carvacrol | C10H14O | 10.42 | −5.5 | ||
| Theobromine | C7H8N4O2 | 10.5 | 0.12 | ||
| Isonicotinamide | C6H6N2O | 13.7 | 3.5 | ||
| Caffeine | C8H10N4O2 | 14 | 0.7 | ||
| Urea | CH4N2O | 15.7 | −2.3 | ||
| Anthracene | C14H10 | Aromatic, neutral | |||
| Naphthalene | C10H8 | Aromatic, neutral |
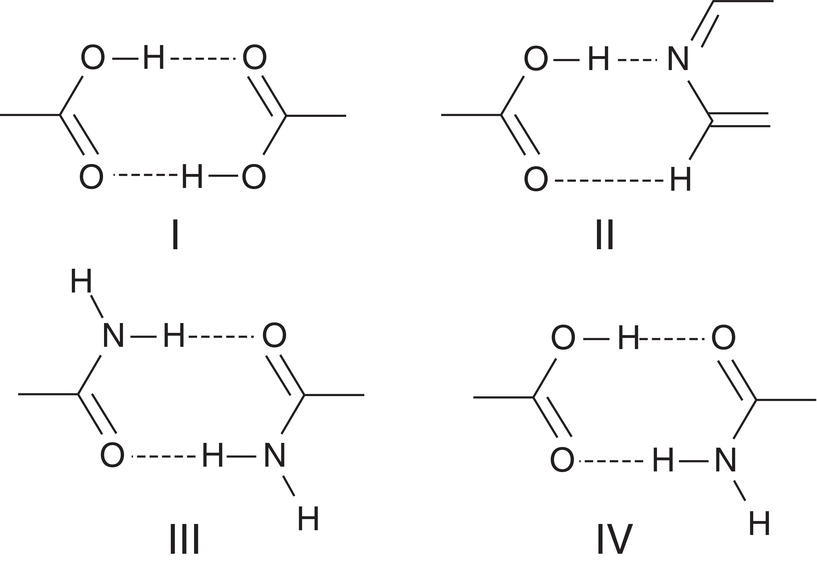
Figure 3.7 Hydrogen bonding network in crystal structure of co‐crystals.
In the co‐crystal, the functional groups within the free molecule and co‐former are bound together via noncovalent interactions, often including hydrogen bonding. Based upon the works of Vishweshwar et al. (2005), there can be four types of interaction as shown in Figure 3.7. Types I and III are homosynthon where hydrogen bonds are formed between two carboxylic acid groups or two amide groups. Types II and IV are heterosynthon where hydrogen bonds are formed between carboxylic acid/pyridine functional groups, and carboxylic acid/amide functional groups. Some published cases include ibuprofen‐nicotinamide (type IV), caffeine‐oxalic acid (type II) carbamazepine‐saccharin (type III, with slight variations where carbonyl groups are replaced by sulfoxide groups in saccharin), etc.
As can be seen, the same candidate, for example citric acid, can be used for either making salt of molecule A, or co‐crystals of molecule B. Similarly, for molecule C, it could form salt or co‐crystal with different counter‐ions or conformers.
3.4.3 High Throughput and Process‐Based Screening
Screening can fall into two categories. One is high throughput or tier‐I screening, and the other is process‐based or tier‐II screening.
For the tier‐I screening, the goal is to search the entire crystal form landscape (as much as possible) and identify “a” suitable/stable crystal form for development. But this crystal form may still not be the most stable form. In lieu of the diversity of polymorphs, hydrates, solvates, salts, and co‐crystals, the screening exercise may include hundreds or more of screening experiments in mg quantities. The screening exercise would require dedicated resources with expertise which may not always be available in most R&D organizations. Recently with the advancement of technology in this field, some contract R&D organizations, for example Lonza, Solvais, Triclinic, or XtalPi, are offering such screening services.
The tier‐I screening protocol is illustrated below:
- Estimate solubility of interested molecule and/or its counterions, co‐formers in selected solvent systems.
- Conduct solvent‐based experiments, for example slurry, cooling, antisolvent, evaporation and/or reactive crystallization, to generate “crystalline” solids.
- Conduct solid‐based experiments, including drying/heating, and mechanical grinding, etc. of existing solids and/or solids obtained from the solvent‐based experiments.
- Analyze the resulting solid with various analytical tools, including PXRD, polarized‐light microscope, ssNMR, DSC, etc.
For solubility estimation, the solvent can include
- Alcohols, such as ethanol, isopropanol
- Acids, such as acetic acid or formic acid
- Nitriles, such as acetonitrile
- Ketone, such as acetone, methyl‐ether ketone
- Esters, such as ethyl acetate, isopropyl acetate
- Ethers, such as 2‐MeTHF, methyl‐t‐butyl ether
- Polar aprotic, such as DMF, DMSO
- Aromatic, such as Toluene, Anisole
- Alkanes, such as n‐Heptane
- Combination, such as acetone/water (95/5), acetonitrile/water (95/5), and 2‐propanol/water (95/5).
As mentioned in Chapter 2, there are commercial instruments, such as Crystal 16, Crystalline or other high throughput screening devices, which can conduct these mini‐experiments automatically. This help significantly reduce the experimental time. Furthermore, there are commercial software, such as Aspen, Cosmo or Dynochem, which can assist screening the solvents, counterions and co‐former in silico. Combination of experimental data and in silico modeling tools can greatly improve the outcome with reduced efforts. The solubility information obtained at this stage may be semiquantitative and not specific to specific crystalline form.
Once the landscaping of solubility is established, different types of crystallization techniques can be designed and implemented. These techniques include cooling, antisolvent, evaporation, reaction, or some combination. As an example, a free molecule with a basic functional group may be soluble in alcohol, and it can react with HCl (also soluble in alcohol) to form the HCl salt. The HCl salt may crystallize out directly in alcohol, by cooling, by adding the antisolvent, or by evaporating the alcohol, or some combinations.
Slurrying solids directly in the selected solvents, without complete dissolution, is a very common and useful technique. As an example, the amorphous solid can be slurried in sparingly soluble (one part of solid in 30–100 parts) or slightly soluble (one part of solid in 100–1000 parts) solvents. The amorphous (and unstable) solid can convert to crystalline (stable) solid over time. To accelerate the conversion to stable crystalline form, heat and high mixing intensity as mentioned in earlier sections has been found to be very helpful.
With the solid‐based experiments, DSC/TG can be very powerful tools for studying the thermal behavior of solids. As an example, upon heating, the hydrate may dehydrate and form anhydrate, solvate may be desolvated and form desolvate, and a solid may melt and interact with the co‐former in melt stage and form the co‐crystal solid upon cooling down. Mechanical grinding or delumping of these solids as a pretreatment is recommended.

Figure 3.8 Degradation pathway of Ritonavir—the ester bond is hydrolized, and then forms a cyclic cabamate ring.
For the tier‐II process‐based screening, the goal is to ensure “the” desired stable crystal form has been obtained. The tier‐II experiments are conducted after the tier‐I high throughput screening and ideally before the manufacturing of molecules for clinical study. All process variables, for example temperature, solvent composition, counterion/co‐former purity/ratio, mixer/mixing intensity, process impurities, drying, etc. would need to be thoroughly reviewed and stressed. Because of its strong dependence on process conditions, the recommended scale of these tier‐II experiments should be in grams to tens of grams. A well‐known example for process‐induced form conversion is Ritonavir. A new form II was discovered in 1998 after the drug has been on the markets for years. The later discovered form II has about one‐fifth of the solubility of the original form I. Therefore, form II failed the dissolution test of multiple lots during the formulation manufacturing. As reported in Bauer et al. (2001), the most likely cause, which induces the formation of very first form II nuclei/crystal, would be a degrade impurity of Ritonavir. As shown in Figure 3.8, this impurity contains a cyclic carbamate linkage and can likely serve as a template which helps to cross over the energy barrier between form I and II (Chakraborty et al. 2016). Bulk Ritonavir invariably contains some small quantities of this residual cyclic carbamate which is accumulated on the surface of various manufacturing equipment from batch to batch, and eventually with enough time and sufficient quantity to catalyze the first generation of crystal form II.
3.5 EXAMPLES
One of the most celebrated case of polymorphism is that of graphite and diamond. Both are crystalline modifications of elemental carbon. Graphite is thermodynamically more stable than diamond at room temperature. The free energy difference is small, amounting to only 0.69 kcal/mole at 25°C and one atmosphere (Angus and Hayman 1988). This free energy difference is only slightly higher (~16%) than the corresponding RT value (0.59 kcal/mole). It is obvious that there is a suspended transformation involved and that implies that there is a relatively large activation energy (kinetic) barrier preventing the conversion of diamond into graphite at room temperature. This case illustrates the importance of metastable equilibrium and suspended transformations. The case also demonstrates that the physical properties of the polymorphs can be different and subjected to measurement even though one polymorph is metastable with respect to the other. Diamond is certainly harder and has a higher thermal conductivity at room temperature than graphite.
Of course, diamond and graphite are not the only example of polymorphs. In fact polymorphism is quite prevalent among pharmaceutical compounds. Solvation and hydration also frequently occur with medicinally active substances (Verma and Krishna 1966; Byrn 1982; Angus and Hayman 1988). In fact, it is rare when a medicinal agent exhibits only a single crystalline structure (Ostwald 1897; Haleblian and McCrone 1969; McCauley 1991). The different solid forms of the medicinal agent will have different physical properties and as a consequence may have different bioavailabilities. Therefore, control of the solid form of the medicinal agent is extremely important to provide consistent biological activity (Yang and Guillpry 1972). To insure, as far as possible, an unchanged bulk material and final pharmaceutical product upon storage and for shelf life, it is wise to give due consideration to choosing the most stable polymorph or solid phase under the conditions of the storage, usually in the room temperature region. Examples of polymorphism among pharmaceutical compounds follow. This of course is not an all‐inclusive list and in fact only skims the surface of examples. These cases, however, will help to illustrate some of the concepts developed above and indicate the experimental data required to classify the polymorphs and their relative stability. They will also address some issues that may affect the isolation and production of the desired solid phase.