
Chapter 12
Drying
12.1 INTRODUCTION
Drying is a unit operation which follows filtration. The primary objectives of the drying operation is removal of solvents from the wet cake to meet specifications in the dry solid.
In the case of active pharmaceutical ingredient (API), the acceptable levels of residual solvent may be set according to safety (solvent toxicity), regulatory, or stability requirements, similar to those specifications of chemical impurities. The level of residual solvents may affect drug–excipient interaction and can have impact on final drug product properties and performance. For API intermediates, these specifications may be set according to the tolerance of solvents in the subsequent chemistry steps.
Another key objective of drying is to achieve or maintain the desired crystal form and particle size distribution obtained by crystallization. The desired form, which can be a solvate or hydrate, may be produced during crystallization, and it is important to keep the desired crystal form during the drying operation. In some cases, the desired form may not be the crystal forms generated during the crystallization and is more practical to generate the desired form via the drying operation. Needless to say, it is desirable to generate nicely flowable solid powder of uniform particle size distribution with minimum particle attrition and formation of agglomerates after drying.
From the fundamental mechanism perspective, drying is a complex distillation carried out in a heterogeneous system involving solid, liquid, and vapor. It involves the phase transformation of solvents from the liquid phase to the vapor phase. The liquid may be present on the exterior surface of the particles, or can be present in the interior pore or crystal lattices, for example solvates or agglomerates, of the particles. Solvents will be evaporated and removed via simultaneous heat and mass transfer. Heat can be transferred to the wet cake via conduction from the heated dryer wall/filter plate/agitator, and/or convection from the warm carrier gas fed into the dryer. The evaporated solvents will be removed via vapor diffusion through vacuum, and/or convection through the carrier gas. In certain cases, such as hydrates, the inert carrier gas may be maintained at a certain humidity level. Also, the wet cake can be agitated periodically to improve the heat conduction and drying efficiency.
During drying, particles are physically very close to neighboring particles. Hence, the viscosity of the wet cake or torque required to mix the wet cake is much higher than the crystalline slurry at the end of crystallization. Upon mixing the wet cake, particles can break into finer pieces of particles. On the other hand, upon evaporation of solvents, the dissolved species in the solvents will precipitate or crystallize out. The dissolved species can bind the neighboring particles and thus create agglomerates or granules, which increases the apparent particles size.
Many useful reference material on drying can be found, for examples am Ende et al. (2019, chapters 35 and 37), McCabe et al. (2017, chapter 24), and Lister (2016, chapters 8 and 9).
12.2 BASIC PROPERTIES
12.2.1 Vapor–Liquid Equilibrium
The equilibrium vapor–liquid relationship of solvents can be described by Clausius–Clapeyron equation as follows:
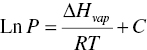
where P is the vapor pressure, ∆Hvap is latent heat, R is gas constant, T is temperature, and C is constant.
Based upon Clausius–Clapeyron equation, Figure 12.1 plots the vapor–liquid equilibrium curves of water, acetone and heptane. When the pressure and temperature are above the curve, the solvent will exist as liquid. When the pressure and temperature are below the curve, the solvent will exist as vapor. In order for liquid to evaporate, the system pressure needs to be located in the area below the curves.
As shown in the figure, under 760 mmHg, acetone will boil at 56°C, water will boil at 100°C and heptane will boil at 98.4°C, respectively. Clearly, volatile solvent enables lower drying temperature. Often, pharmaceutical compounds are unstable at elevated temperatures and must be dried at lower temperatures. For evaporating the water, the curve shows that system pressure needs to be less than ~80 mmHg and temperature needs to be ~50°C. Hence, it is useful to understand the relationship between vapor pressure and temperature.

Figure 12.1 V–L equilibrium of acetone, water, and heptane.
Besides the absolute pressure and temperature, another important parameter is latent heat, i.e. ∆Hvap The latent heat in joule/gram for acetone, water and heptane is 518, 2257, and 318, respectively. Therefore, while both water and heptane have similar V–L equilibrium profile, it will take much less heat to evaporate the heptane than water. In practice, it is reflected in the drying rate. Heptane will evaporate at a much faster rate than water when the same amount of heat is transferred from the dryer to the wet cake under the identical temperature and vacuum conditions.
12.2.2 Solvation and Desolvation
Another important solid–vapor phase equilibrium behavior of solvent is solvation and desolvation. This is very similar to the case of solid–liquid phase equilibrium as discussed in Chapter 3.
Using the water as the model molecule, water activity defines the equilibrium relationship of water in the vapor, liquid, and solid (hydrate crystal) phase. The water activity can be inferred from the relative humidity via the following way:
- Relative humidity RH% reflects the Awater of water in the vapor phase.
- At V–L equilibrium, Awater in the liquid is equal to the Awater or RH% in the vapor phase.
Figure 12.2 illustrates the relationship of saturated water vapor pressure, i.e. Awater equal to 1, and 50% relative humidity, i.e. Awater equal to 0.5.
In the case of hydrate, there is a critical water activity in the liquid. Above the certain water activity, it will form hydrate. Below a certain water activity, hydrate will convert to anhydrate. Consequently,
- At S–L equilibrium, Awater in the solid phase <=> Awater in liquid phase.
- At S–V equilibrium, Awater in the solid phase <=> RH% in the vapor phase.
The relationship and conversion among these hydrates under different RH%. Is shown in Figure 12.3, by replotting the data from Table 3.4 Starting from dehydrate form A (solid square), it converts to dihydrate form A from 10% RH to 20% RH and stays as dihydrate form A (solid square) at higher RH. Starting from dehydrated forms B (open circle) or D (open triangle), they convert for monohydrate form B (open circle), in between 10% RH and 30% RH. Both form B (open circle) monohydrate convert to dihydrate form D (open triangle), from 60% RH or higher RH. Therefore, during drying under different RH, it is possible to convert to different hydrate.
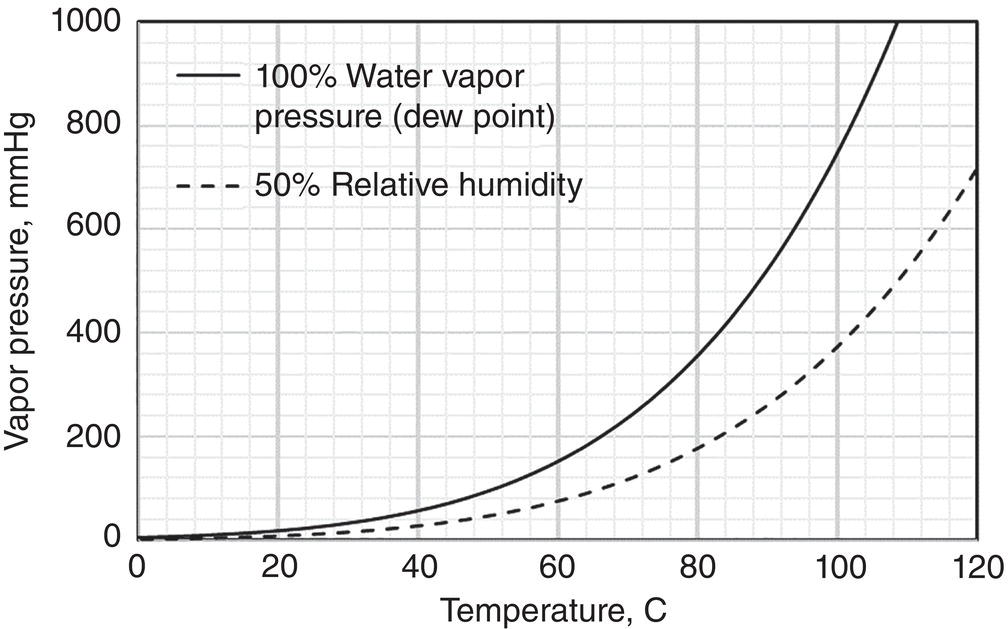
Figure 12.2 Water vapor pressure and water activity.

Figure 12.3 Hydration behavior of different hydrates under different humidities.
12.2.3 Hardness and Brittleness of Solid Particles
Solid particles can fracture during the drying operation under stress. The shear‐stress relationship to describe the fundamental solid material behavior is shown in Figure 12.4. Here, stress is defined as force per cross area of the material, and strain is the amount of deformation experienced by the material in the direction of force applied, divided by the initial dimensions of the body. In general, there can be two types of deformation before particle fracture (Salman et al. 2007, chapter 14, p. 605–634)

Figure 12.4 Stress–strain relationship.
- Elastic deformation—it is a linear relationship between stress and strain. The deformation is elastic because strain is reversible. When stress is removed, the solid returns to its original size/shape. At the limiting point A, the stress is called yield stress σy. Beyond point A, the solid does not return to its original shape when stress is released. Yield stress is proportional to indentation hardness H of the particle.
- Plastic or ductile deformation—The stress–strain relationship is highly nonlinear in this region. The apparent change of size/shape under stress is irreversible. In this region, once the stress is removed, the material will not return to its original shape.
- Fracture—When the stress–strain curve reaches the limit point B, the solid fractures and breaks into smaller pieces. The area under the curve (Origin‐A‐B) is defined as fracture toughness, Kc.
The material is brittle if fracture occurs shortly after the yield stress point A. The material is ductile if fracture occurs after a significant plastic and ductile deformation, i.e. fracture point B is far away from yield stress point A. For semi‐brittle material, fracture lies in between brittle and ductile.
As stated (Salman et al. 2007, chapter 14, p. 613), most of particulate solid materials fall into semi‐brittle category by virtue of their size and shape, because the contacts are non‐conforming, and the contact size is small. Therefore, the contact stresses during mechanical loading quickly reach the plastic yield causing plastic deformation. Once the prevailing stress exceed the yield stress, the material fracture can be described successfully by the indentation fracture mechanism. The index of brittleness, i.e. ratio H/Kc where H is hardness (resistance to deformation) and Kc is toughness (resistance to fracture), can be determined via nano‐indentation technique. Taylor et al. (2004) demonstrates a good correlation between particle size reduction and index of brittleness of five pharmaceutical compounds. Results are highlighted in Table 12.1 where the last column shows the change of particle size is defined as (input size—output size)/input size.
Table 12.1 Brittleness index versus size reduction after hammer milling.
Source: Taylor et al. (2004) with permission American Chemical Society.
| Compound | Brittleness index (×1000 m−1/2) | Input size | Output size | % Size reduction ratio | |||
|---|---|---|---|---|---|---|---|
| Mean (μm) | D90 (μm) | Mean (μm) | D90 (μm) | Mean (μm) % | D90 (μm) % | ||
| Sildenafil citrate | 27.8 | 173 | 402 | 47 | 94 | 73 | 77 |
| C | 9.5 | multiple batches 157–405 | 285–666 | 47–85 | 95–193 | 69 | 71 |
| B | 9.0 | 200 | 470 | 70 | 141 | 65 | 70 |
| A | 1.7 | 88 | 155 | 55 | 114 | 27 | 36 |
| Voriconazole | <1 | 250 | 250 | 0 | |||
Note: Apex 314 Hammer mill with a screen size of 690 μm was used to delump the batch.
From Table 12.1, it shows that sildenafil citrate has the highest reduction of particle size and the highest value of brittleness index. For compounds C, B, A, and voriconazole, their brittleness index are smaller. Therefore, the changes of size ratio are also smaller or remain unchanged.
Based upon authors’ observation, crystals of higher aspect ratio, for example 1‐D needle, or 2‐D plate, appear to be easier to fracture than crystals of low aspect ratio, for example 3‐D rock.
12.2.4 Agglomerates and Granules of Solid Particles
In the meanwhile, particles can form agglomerates or granules during drying. With mixing/blending, the particle agglomeration mechanism resembles closely to the wet granulation mechanism in formulation. During wet granulation, the granulating liquid containing dissolved binders/excipients are mixed with dry API particles. With proper mixing, the solid particles are uniformly wetted and form wet granules (Parikh 2021, chapter 2). Figure 12.5 illustrates a generic granule size‐moisture curve. As shown, the wet granules size increases as moisture level increases until it reaches the maximum size of granule. Then it falls off after more liquid is present. As granule size increases, the granules yield stress also increases, as reflected via the torque required for mixing these granules.
Mechanistically, the formation of granules can be classified into four categories: pendular, funicular, capillary, and droplet states. Using a simple two‐dimensional description, in the pendular state, particles in granule are bridged via “point‐contact” of liquid. There are significant void spaces in the granule. In the funicular state, particles in granule are bridged via a mixture of “point‐contact” and “surface‐contact” of liquid. There are less void space within the granules. In the capillary states, particles in granule are bridged via “surface contact” of liquid. All void space within the granules are filled with liquid. In the droplet state, the granule is overwetted with excessive liquid. Liquid becomes the dominant phase, Individual particles are surrounded and dispersed in the liquid phase.
During drying, the direction of wetness change is opposite to the wet granulation step described above. The wet cake will start at a high wetness level and decrease as it gets dried. Therefore, initially, with mixing/blending, the individual particles in the wet cake can form large agglomerates/granules in the capillary state with the highest torque shown in Figure 12.5. As drying continues, the liquid level decreases. There will be less liquid to bridge particles in these agglomerates/granules. If liquid is the only bridging agent for these agglomerates/granules, the particles within the agglomerates/granules are no longer bridged and agglomerates/granules will fall apart. However, during drying, the dissolved material can crystallize out which will form solid bridges among particles in the agglomerates/granules.
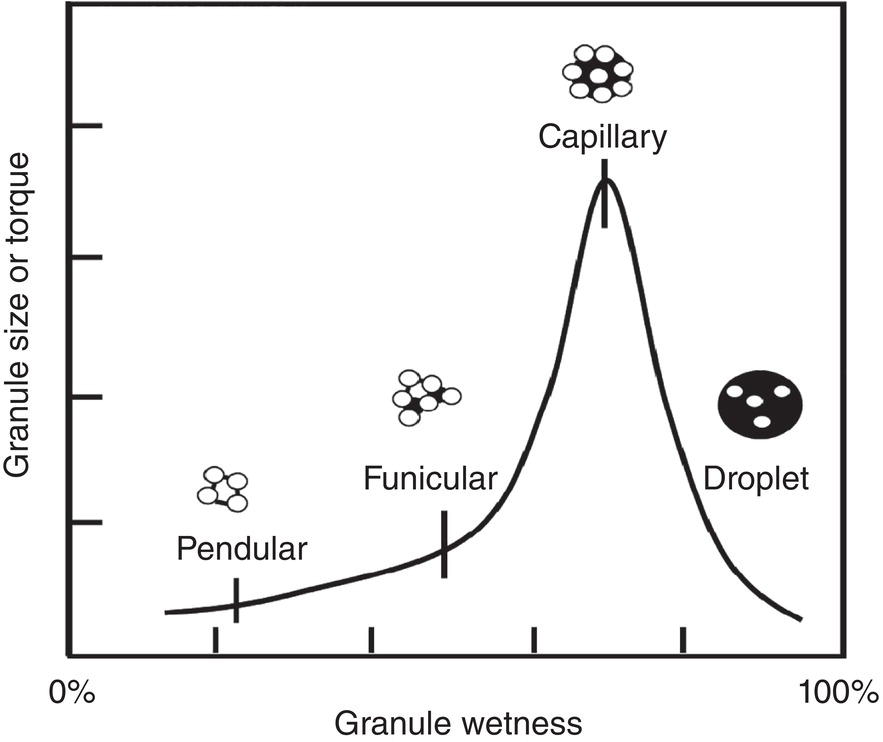
Figure 12.5 Relationship between granule wetness and granule size/torque. Open circles represent individual particles, dark line/area/circles connecting these particles are liquid (not drawn to the scale).
The relationship between agglomeration/granulation and wetness is demonstrated by Zhang and Lamberto (2014). In one compound of 1‐D needle‐like crystals, dry solid samples were mixed with the wash solvent of isopropanol using a Caleva mixer torque rheometer. Figure 12.6 shows that at a higher cake wetness (~35%) or torque value (0.47 nm), the final dry cake shows large agglomerates in the pilot plant batches. At a low cake wetness (~17%) or torque value (~0.2 nm), the final dry cake shows no large agglomerates in the pilot plant batches. Both agitated filter and conical dryers were used in the pilot plant. This case clearly illustrates the correlation between granulation and wetness of the cake.
Also reported by Zhang and Lamberto (2014) for another compound, three samples of different shape/size were prepared and mixed with wash solvent of 25% MeOH in water, using a Caleva mixer torque rheometer. The drying experiments of these samples with different size were conducted using an acoustic mixer with starting wetness of ~43%. Specifically, these samples are
- 1‐D needle‐shape crystal of size ~2.5 μm
- 3‐D rock‐shape (jet ‐milled) crystal of size ~6.2 μm
- 3‐D rock‐shape crystal of size ~35.2 μm
As shown in Figure 12.7, the 1‐D needle‐shape crystal of size ~2.5 μm has the highest torque value (~0.42 nm). The 3‐D rock‐shape crystal of size ~6.2 μm has the medium torque value (~0.24 nm). The 3‐D rock‐shape crystal of size ~35.2 μm has the lowest torque value essentially below 0.05 nm throughout the entire wetness region. These observations correspond closely to the degree of agglomeration/granulation as shown in Figure 12.7b. For the 3‐D rock‐shape crystal of size ~35.2 μm, no agglomerates were observed after drying. For the 3‐D rock‐shape crystal of size ~6.2 μm, there is some degree of agglomeration. For the 1‐D needle‐like crystal of size ~2.5 μm, there is significant degree of agglomeration. These observations reflects vividly the impact of particle size and aspect ratio on particle agglomeration.

Figure 12.6 Relationship between formation of large agglomerates, torque values and cake wetness.
Source: Zhang and Lamberto (2014), with permission Elsevier.
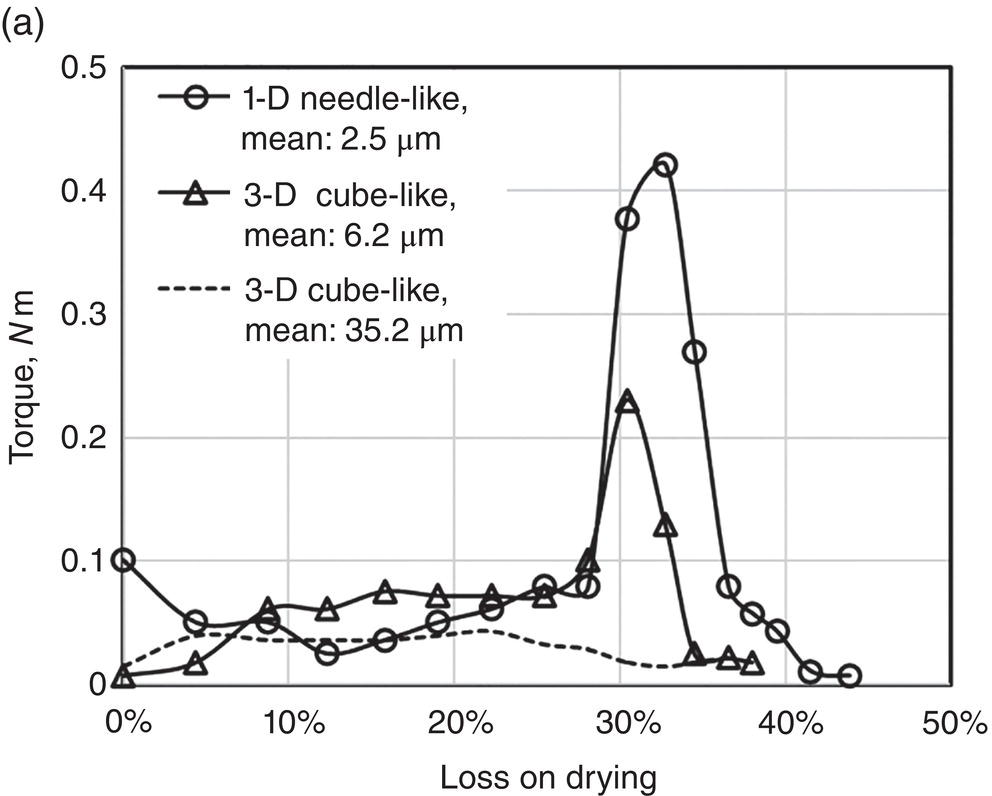

Figure 12.7 (a) Torque and wetness relationship of three different particle sizes. (b) Microscopic photos of samples with different particle sizes before and after drying.
Source: Zhang and Lamberto (2014) with permission.
It would be interesting to further investigate the underlying crystallization/bridging behavior during drying. For 1‐D needle crystals of small particle size, it may possess high degree of “surface contact.” Therefore, upon forming crystalline bridges, the 1‐D needle crystals will have the strong binding among individual particles. On the other hand, the 3‐D rock unmilled crystals may have low degree of “surface contact” but high degree of “line contact” or “point contact” throughout the entire wetness region. Consequently, the wet cake shows low torque value and no formation of agglomerates.
12.3 KINETICS
12.3.1 Drying Profiles
As shown in Figure 12.8, the drying process can be generally divided into three stages (Hoekstra et al. 2006): Briefly,
- Induction stage—This is the initial stage starting with the cake wetness x1 and from time zero to t1. In this period, the system begins the drying operation. The dryer jacket temperature is adjusted to the set‐point and/or system pressure is pulling to the desired vacuum level. Therefore, the wet cake is in transition to the dryer temperature and vacuum level to initiate the evaporation of solvents.
- Constant rate stage—This is the stage from cake wetness x1–x2 and from time t1–t2. In this period, solvent evaporates with a steady constant rate. As solvent evaporates, it will absorb heat which will reduce the wet cake temperature. This creates a temperature differential within the wet cake, or a temperature gradient across the wet cake between the dryer wall and V–L interface in the wet cake. It is believed that the solvent evaporated in this period is primarily free solvents, which are located externally to the wet cake particle matrix and not internally within the particle matrix. Thus, the evaporation rate is limited by the rate of heat transferred from the heat source, for example contact heated area for contact dryer, through the wet cake. This period is considered to be heat‐transfer limited.
- Falling rate stage—This is the period where solvent evaporation rate falls down significantly from cake wetness x2–x3 and from time t2–t3. In the period, the solvent located within the particle matrix is evaporated. The internal solvent can also include solvent molecule in the crystal lattice such as solvate. The solvent is diffused and/or evaporated out from the particle matrix at a much slower rate than the heat transfer rate from the dryer to the wet cake. As a result, the solvent evaporation rate is limited by the mass transfer rate through the particle matrix. The wet cake temperature will rise and be close to the dryer temperature. This period is considered to be mass‐transfer limited.
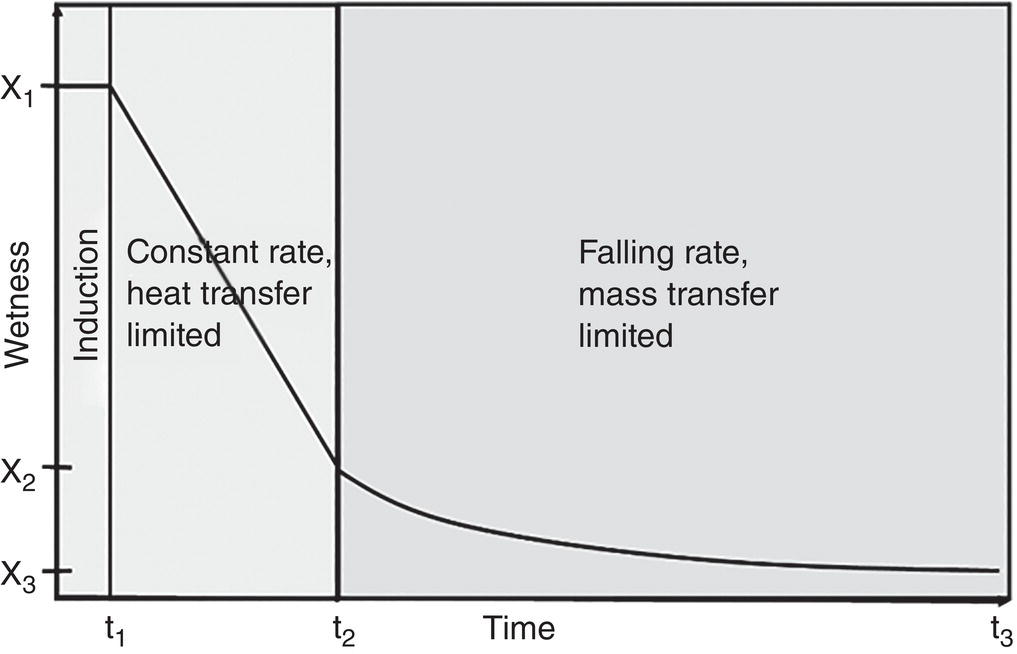
Figure 12.8 Drying profiles: induction, constant rate, and falling rate stages.
Mathematically, the drying kinetics can be expressed as
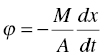

where ϕ is the drying or solvent evaporation flux (mass per time per area), M is the dry cake weight (mass), A is the effective heated area in the dryer, x is the level of wetness based upon dry cake weight (mass per mass) and t is time.
In the falling rate period, the drying flux ϕ is a constant. In the falling rate period, an average drying flux ϕ, for example log mean of (ϕ(x2)−ϕ(x3))/Ln (ϕ(x2)/ϕ(x3)), can be derived. Substituting these ϕ values, the total drying time can be calculated as below:

As shown from the equations above, the drying flux ϕ is a key kinetic parameter affecting the drying performance throughout the entire process. This parameter can be affected by multiple variables, including particle size/shape, solvents, vacuum level, dryer temperature, gas sweep direction (through the cake or above the cake), gas residence time in the cake (batch size/sweep rate), wet cake mixing/blending pattern, frequency (rpm), etc. Typically, the total drying time cycle is dominated by the falling rate period, not by the constant rate period for pharmaceutical compounds. Therefore, optimization of falling rate period would be preferable for process improvement.
Figure 12.9 illustrates a case of drying hydrate under different gas sweep mode in a laboratory filter/dryer (without agitation). For both cases, constant rate and falling rate regions are observed. The drying rate is more efficient with gas flowing through the wet cake than gas sweeps over the cake surface, since it facilitates the mass‐transfer and removal of moisture from the cake.
The drying progress can be monitored via different measurement techniques. Samples can be taken periodically for measurement of cake wetness offline via KF, GC, LOD, etc. In‐line process analytical tools, including temperature probes for measuring temperatures of multiple locations in the dryer and humidity sensors for measuring vapor humidity before and after the cake, can be simple and effective, More advanced in‐line PAT tools, including GC‐MASS, FTIR, and Raman spectrophotometers with chemometrics analysis, can also be used to measure vapor phase solvents composition and the progress of drying.

Figure 12.9 Drying profiles with different nitrogen sweep modes.
12.3.2 Particle Fracture and Agglomeration
As discussed in Section 12.2.3 and 12.2.4, particles can form agglomerates under certain wetness and mixing energy (or torque). Agglomerates or particles can fracture into smaller pieces if mixing energy is sufficiently high and beyond the fracture toughness of agglomerates or particles. Particle may also remain intact or dispersed under low mixing energy. Based upon these concepts, a hypothetic map showing their relationship is drawn in Figure 12.10, where Y‐axis represents the mixing energy/batch size, and X‐axis corresponding cake wetness (or drying time).
As illustrated in Figure 12.10, initially when the cake wetness is “very high,” i.e. droplet region, the required energy for mixing the batch shall be low. Under this situation, particles are dispersed in the liquid phase. After deliquoring, the cake wetness moves into capillary region. The required energy for mixing/blending can vary depending upon material properties. If the required mixing energy is relatively “high,” particles can fracture. If the required mixing energy is “medium,” particles can agglomerate. If the required mixing energy is “low,” the particles can remain intact. When the cake wetness decreases to funicular or pendular regions, the required mixing energy will decrease. Particles would stay dispersed. As seen, these particle behaviors are highly nonlinear. Since final particle attributes can be strongly affected by the mixing profile during drying, varying mixing during drying can lead to different particle size distribution after drying.
To provide a more quantitative assessment of agglomeration and fracturing tendency of different compounds, am Ende et al. (2013) employed few laboratory techniques, such as FT‐4 powder rheometer for fracturing assessment and Caleva mixer torque rheometer for agglomeration assessment in agitated filter dryer. The findings are summarized in Table 12.2. As shown, for the case of agglomeration, the higher the torque value is, the higher the potential is to agglomerate. For the case of particle fracturing, the results are presented via direct measurement of particle size change before and after a predetermined mixing condition, instead of correlating the required mixing energy to fracture the particles. It would be curious to see if such a correlation can be established similar to the case of agglomerates.
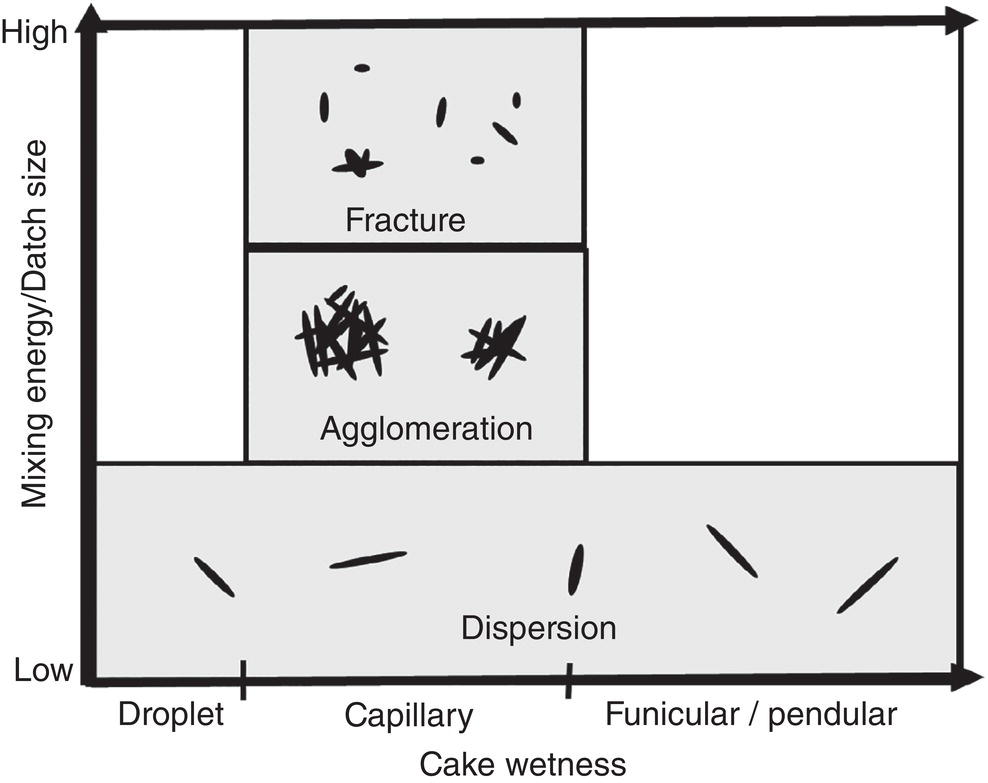
Figure 12.10 Impact of mixing energy and cake wetness on fracturing, agglomeration, and dispersion of particles.
Table 12.2 Assessment of particle fracture and agglomeration tendency.
Source: (Am Ende, et al. 2013 with permission) American Chemical Society.
| Particle fracturing (under fixed mixing conditions) | |
|---|---|
| % Decrease of volume–mean–diameter (VMD) | Particle fracturing risk |
| ∆VMD > 50% | High |
| 25% < ∆VMD < 50% | Medium |
| ∆VMD < 25% | Low |
| Agglomeration | |
| Torque reading (nm) (full bowl) | Particle agglomeration risk |
| >0.35 nm | High |
| 0.1–0.35 nm | Medium |
| <0.1 nm | Low |
12.3.3 Inter‐Relationship Between Drying Stage and Particle Behavior
Given the characteristics of drying stages and particle behaviors during drying, their inter‐relationship are tentatively drawn in Table 12.3. These are simplified correlations per authors’ view, without much mathematic derivations. However, it is important to consider these characteristics together in designing the drying process, especially if there are potential risks of thermal degradation, trapping of residual solvent, crystal form conversion, particle agglomeration/fracturing, etc, which are critical quality attributes for final release the compounds.
As an example, one risk of drying is solvent occlusion in the final dry cake, where solvents are trapped within the agglomerates in the dry solid. To minimize particle agglomeration, it would be desirable to minimize the mixing energy during the high wetness (capillary) stage. Minimization of mixing energy will also reduce the risk of particle fracturing in the high wetness (capillary) stage as well. It will slow down the drying rate in the constant rate domain, but it is considered to be a relatively low penalty. Therefore, minimizing mixing energy in the high wetness (capillary) stage can reduce risk of solvent occlusion and particle agglomeration/fracturing. As a note, no mixing of wet cake in this region may have other risk, for example surface hardening of wet cake where surface evaporation rate is too fast. This is generally considered to be a scale‐up issue and will be discussed in more details in subsequent sections. Given all these considerations, periodic mixing of wet cake is generally adopted as the best practice in pharmaceutical drying.
Table 12.3 Drying profile and particle behaviors during drying.
| Cake wetness | Drying profile | Particle behavior |
|---|---|---|
| High (capillary) | Constant rate, heat‐transfer limited | Fracturing, agglomeration and dispersed, depending upon the required mixing energy which can vary from high to low |
| Medium (funicular) | Transition from constant rate to falling rate | Dispersed, generally mixing energy is low |
| Low (pendular) | Falling rate, mass‐transfer limited | Dispersed; generally mixing energy is low |
In the meanwhile, it would be highly desirable to minimize the solubility of species in the solvent system in the wet cake. When solvent is evaporated, the particles in the agglomerates can no longer be held together by the liquid, but will be bound by the re‐crystallized species which is dissolved in the wash (or mother liquid) originally. Therefore, for solvent of low solubility, there will be low amount of species recrystallized out from the evaporated solvent. Thus, the binding is weak and agglomerates can easily break apart and become dispersible.
12.4 PROCESS DESIGN AND SCALE‐UP
12.4.1 Process Design
Multiple variables should be considered in designing the drying process. They include
- Temperature and pressure/vacuum profiles—The temperature is mainly based upon solubility of the compound in the solvent, and vacuum level is based upon the solvent vapor–liquid equilibrium relationship as discussed in Section 12.2.1. In practice, temperature can vary widely, for example from 0 to 80°C. Also, vacuum level can vary widely, for example from few mmHg to a hundred mmHg.
- Inert gas flow pattern and residence time through the wet cake—The inert gas can sweep over the surface or flow through the wet cake. Flowing through the cake, especially in the upward flow direction similar to the fluidized bed, would provide more efficient mass transfer and heat transfer. The gas flow rate needs to be properly controlled only to maintain some degree of particle fluidization but avoid blowing particles out of the dryer.
- Vapor humidity level—For the case of hydrate drying, it needs to maintain a proper level of vapor phase humidity to avoid undesired dehydration.
- Cake mixing/blending pattern—There are basically three types of mixing/blending patterns for dryers commonly used in pharmaceutical industry. Figure 12.11 illustrates these three types of dryer (/blender), including V‐shape (or doble‐cone) rotary dryer, agitated filter dryer, and conical screw dryer. With regards to the tray dryer, it has no mixing capability. For V‐shape rotary dryer, the dryer rotates around the center axis through dryer. The mixing/blending of the batch is achieved primarily via gravity. That is, as the dryer rotates, the entire batch moves up to a higher elevation and falls/rolls down to a lower point in the dryer. This action repeats as dryer rotates. Its mixing/blending energy can be considered to be relatively low. For agitated filter dryer, it contains an agitator in the dryer. The mixing is primarily along the “radial” direction, but not the “axial” direction. Its mixing/blending energy can be considered relatively high. For conical screw dryer, it contains a conveying auger which provides “axial” mixing of the batch. The auger also rotates around the center of the dryer to provide “radial” mixing. Therefore, it provides both radial and axial mixing of the batch and its mixing/blending energy can be considered to be relatively low or medium.

Figure 12.11 Dryers with different mixing/blending patterns.
In selecting the dryer, additional features, such as heated surface area/volume of dryer and handling of potent compound, are also considered. Table 12.4 highlights these features here for comparison.
12.4.2 Scale‐up
Drying process design include multiple variables as discussed above. If these variables are maintained upon scale‐up, the performance of drying can be reliably estimated and obtained. However, particle agglomeration and fracturing upon scale‐up can still vary as it is scale‐dependent.
For the drying profiles, the drying time cycle can be directly estimated via Eq. (12.4) at all scales. The drying flux ϕ with unit of mass per time per area is scale independent. Its value can be calculated using the laboratory data. The ratio of batch mass over heated surface area, i.e. M/A, represents cake thickness or height. It is the scalable factor. Generally, cake thickness or height will increase upon scale‐up. As a consequence, it will take a longer drying time for bigger batches.
For the particle agglomeration and fracturing outcome upon scale‐up, it is more scale dependent. As discussed in the above section, mixing energy in the rotary dryer is ranked to be relatively low. But as cake weight increases, for example from tens of grams to tens/hundreds of kgs, the required mixing energy will increase inevitably. As mixing energy increases, more particle agglomeration or some particle fracturing may occur. For agitated filter dryer, it possesses the highest level of mixing energy. Therefore, it has the highest risk of particle agglomeration and fracturing at all scales. For screw conical dryer, the mixing energy is relatively low, and will also increase as batch size increases regardless. Hence the risk of particle agglomeration and fracturing will increase as well. As discussed in Sections 12.2.4 and 12.3.2, there has been noticeable progress in this area. However, scale‐up results may still be different from small scales as illustrated in Example 12.2.
Table 12.4 Characteristics of different dryer.
| Dryer type | Advantages | Risk/limitations |
|---|---|---|
| Tray dryer |
|
|
| Rotary dryer |
|
|
| Screw conical dryer |
|
|
| Agitated filter dryer |
|
|