
Chapter 5
Mixing and Crystallization
5.1 INTRODUCTION
Mixing in crystallization involves all elements of transport phenomena: momentum transport, energy transport, and material transport in both the solution phase and the solid phase. In many cases, the interactions of these elements can affect every aspect of a crystallization operation including nucleation, growth, and maintenance of a crystal slurry. To further complicate the problem, mixing optimization for one aspect of an operation may require different parameters than for another aspect even though both requirements must be satisfied simultaneously. In addition, these operations are intrinsically scale dependent. For these and other reasons to be discussed below, it might be stated that crystallization is the most difficult of the common unit operations to scale up successfully.
Successful operations depend on identifying the mixing parameters for the most critical aspects of the process and then evaluating whether those parameters will be satisfactory for the others. Although this approach may be satisfactory in most cases, there will be crystallization procedures that require operation under conditions that are not optimum for mixing for some aspects of the operation, as discussed below.
Successful scale‐up implies that both physical and chemical properties have been duplicated between pilot plant and plant operations. These rigid criteria are not always required but are, for example, for final bulk active pharmaceutical ingredients (APIs). In these cases, the width of the particle size distribution (PSD), the average particle size, the bulk density, and the surface area may all be required to fall within specified ranges. It is prudent to apply these criteria, if possible, in bench scale developmental planning and experimentation to reduce the risk of a dramatic failure. Examples of failures that could result from scale‐up issues are (i) increased impurity levels, (ii) small crystal size causing drastically reduced filtration rates, large PSD including a bimodal distribution, and (iii) a poor‐washing and slow‐drying product, as well as risk of forming gel/amorphous solid/incorrect crystal forms.
For final bulk active pharmaceutical compounds, failures could also include physical and chemical properties that do not meet regulatory requirements to meet biobatch specifications.
Much of this chapter assumes operation in stirred vessels with optional recirculation loop and in‐line mixer (see also Figure 4.28). The other alternative designs (fluidized bed and impinging jet crystallizers) are summarized (Table 5.1) and are described later in this chapter and in Chapters 7 and 11 (fluidized beds) and Chapter 9 (impinging jets). Each of these utilizes different mixing environments to achieve the desired local and global conditions. An alternative feed addition geometry (mixing elbow) is described in Example 7.1.
Table 5.1 Mixing in crystallizers for pharmaceutical processes.
| Function | Type of crystallizer | ||
|---|---|---|---|
| Stirred vessel (with optional re‐circulation loop and in‐line mixer) | Fluidized bed | Impinging jet | |
| Continuous and/or batch | Both | Continuous | Semicontinuous |
| Type of mixer | Variety of impellers and in‐line mixers | Fluidization | Kinetic energy |
| Cooling | Good | Excellent | NA |
| Evaporative | Good | NA | NA |
| Anti‐solvent | Good | NA | Excellent |
| Reactive ppt/cryst | Good | NA | Excellent |
| Circulation‐macro‐mixing | Poor to gooda | Excellent | Poor |
| Meso‐mixing | Poor to gooda | NA | Satisfactory |
| Micro‐mixing | Poor to gooda | NA | Excellent |
| Micro‐mixing time τE, ms | ~5–40 | NA | 0.05–0.2 |
| Scale‐up | Vary, good with in‐line mixer | Good with good seed | Excellent |
| Supersaturation range | Wide | Low | High |
| Control of supersaturation | Achievable | Excellent at low S | Excellent at high S |
| Seeding | Wide range | Massive | None or low |
| Nucleation | Wide range | Minimum | Maximum |
| Growth | Wide range | Maximum | Minimum |
a Dependent on localized conditions in the vessel and recirculation loop/in‐line mixer.
5.2 MIXING CONSIDERATIONS AND FACTORS
The following is a brief discussion of mixing issues that can be expected to influence crystallization processes. Extended discussions of these and other mixing topics may be found in several references including Baldyga and Bourne (1999), Harnby et al. (1992), Paul et al. (2003), and Am Ende et al. (2019), as well as the crystallization texts of Mersmann (2001), Myerson (2001), Myerson et al. (2019), Sohnel and Garside (1992), and Mullin (2001). An overview of mixing strategies for crystallization is provided by Genck (2003) and Tung (2013).
As mentioned earlier, mixing requirements for crystallizers involve all aspects of transport properties: momentum, energy, and mass. For momentum transport, i.e. velocity profile and impact on crystallization, they include
- homogeneity of crystal slurry
- entrainment of gas/vapor from the head space (foaming)
- secondary nucleation through impact
- shear damage to crystals and impact on agglomerate formation/breakup
- satisfactory discharge of the slurry without excess retention of product crystals and possible operation over a wide volume range
For energy transport, i.e. temperature profile and impact on crystallization, they include
- rate of heat transfer through the jacket wall
- avoidance of encrustation—solid scale on walls and baffles
For mass transport, i.e. solution concentration profile and impact on crystallization, they include
- Blending of solution and anti‐solvent components to the molecular level to achieve uniform supersaturation.
- Blending of reagents to the molecular level to achieve reactive crystallization/precipitation.
For example, the initial blending of components to the molecular level, while avoiding regions of high supersaturation, requires consideration of the meso‐mixing and micro‐mixing environments of the contactor. Other requirements involve the macro‐mixing capabilities of the crystallizer. Extensive discussions of these fundamentals of mixing may be found in the references cited above.
5.2.1 Mixing Time
Mixing time can be considered the first factor to describe the mixing phenomenon. Mixing time can be loosely defined as time required to reach 95% (or other specific percentages) homogeneity of the system after a step change. As described in above section, there are various mixing scenarios, for example temperature change during heat/cooling, solvent composition change upon antisolvent addition, drug substance and reagent concentration change upon charging the reagent to form salts or co‐crystals, as well as slurry concentration change during seeding and crystallization, etc. Since it takes time to reach 95% homogeneity, the mixing time will clearly affect solution concentration/supersaturation and seed/slurry concentration of the crystallizer, thus the performance of crystallization.
It has been long recognized that the scale has a profound impact on the mixing time. To illustrate it further, let us define the scale as below:
- Microscale—from microliters to milliliters
- Mesoscale—from milliliters to liters
- Macroscale—from liters to thousands of liters
Based upon these definitions, Figure 5.1 illustrates the qualitative trend of mixing time (order of magnitude) as a function of scale (order of magnitude). As shown in Figure 5.1, the mixing time will vary from fractions of seconds to minutes and up, when the scale can increase from microscale to macroscale. For example, in the laboratory where the size of crystallizer, including in‐line mixer can be from milliliters to liters, the mixing scale would fall into the microscale to mesoscale domain. The mixing time can be from seconds (or fraction of seconds) to a few minutes. Similarly in the pilot plant or factory, when the size of the crystallizer is up to hundreds or thousands of liters, the mixing scale lies in the macroscale domain, and the mixing time can take a few minutes, tens of minutes or longer.
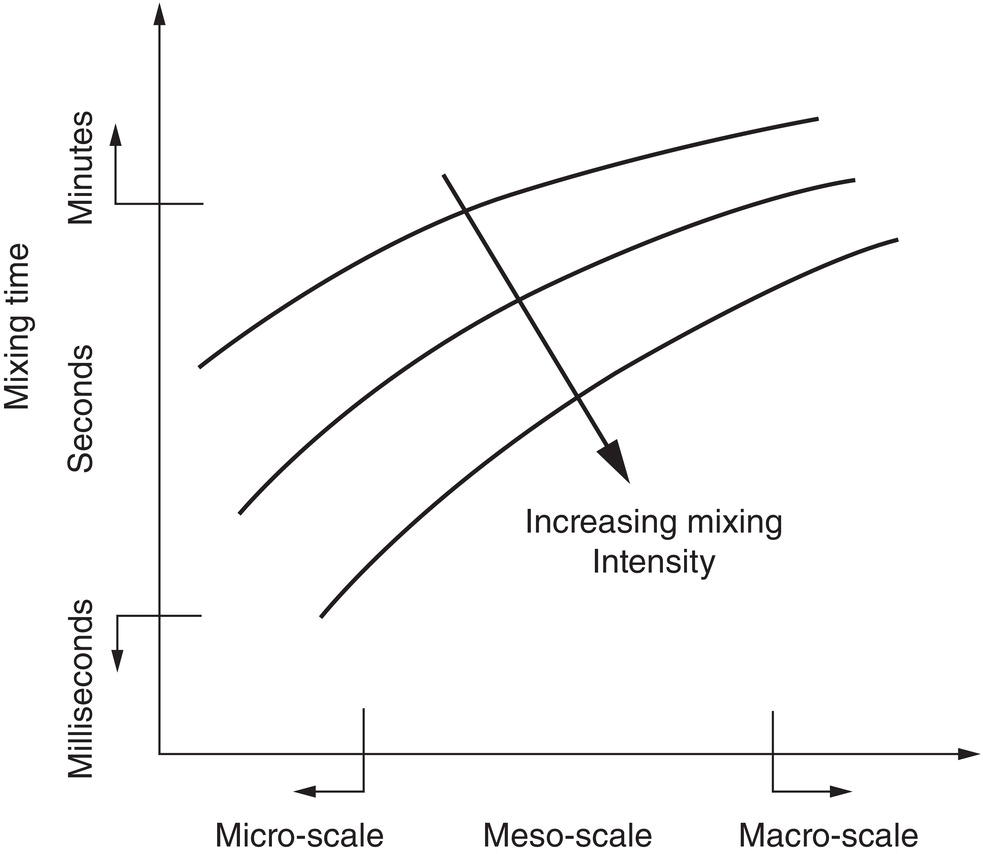
Figure 5.1 Relationship between mixing time and scale.
Source: Tung (2013) with permission American Chemical Society.
It should be noted that the above definition of mixing scale and corresponding mixing time is based upon the absolute proportional size. These definitions are different from the traditional definitions of micro‐mixing, meso‐mixing, and macro‐mixing which are based upon the mixing mechanisms and relative proportion of size (Table 5.1 and Paul et al. 2003). The use of absolute proportion definitions allows us to describe the impact of scale more intuitively on the mixing time. Also, the absolute proportion definition remains consistent with the traditional relative proportion definition in describing the micro‐mixing, the meso‐mixing, and the macro‐mixing phenomena in a macroscale crystallizer. The absolute proportion definitions help to minimize the confusion in ranking the mixing times between the “macro‐mixing” of a 100 ml crystallizer which could be on the order of seconds, and the “meso‐mixing” of a 4000 l industrial crystallizer which could be on the order of minutes, if using the traditional relative proportion definitions.
For mixing with in a stir tank, a simple rule of thumb is that the mixing time is proportional to V/Q, where V is the batch volume and Q is the pumping rate of batch via the impeller in the tank. Since V is proportional D3, where D is the tank diameter and Q is proportional to ND3, where N is the impeller rpm, this formula can be simplified to as 1/N, where N is stirrer rpm. Therefore, the higher the rpm, the shorter the mixing time and vice versa.
Using this rule, let us compare the mixing time in the lab and the factory. For the mixing of a 100 ml crystallizer, the typical rpm can be in the order of hundreds of rpm. For the mixing of a 4000 l industrial crystallizer, the typical rpm is on the order of tens of rpm. Therefore, a 4000 l industrial crystallizer has a longer mixing time than that of the 100 ml laboratory crystallizer.
By understanding the impact of scale on mixing time, it should be clear that a constant addition time strategy for antisolvent or reactive crystallization processes may not be adequate for scale‐up since it will take longer to mix the batch and reach the desired batch homogeneity. One remedy to compensate for this is just to increase the addition time (or decrease the addition rate) upon scale‐up (Liu et al. 2006). Alternatively, it is feasible to apply periodic pulse feed approach with the same overall addition time for scale‐down evaluation. Upon pulsing, batch will be less homogeneous initially and it will take longer time to reach batch homogeneity (in the laboratory crystallizer), thus mimicking the increase of mixing time upon scale‐up.
Also as shown in Figure 5.1, mixing time is decreased with increasing mixing intensity. As described, mixing time is proportional to 1/N. Since a higher N means a higher mixing intensity, a higher mixing intensity shortens the mixing time. The significance of mixing time on nucleation and crystallization will be detailed in latter sections.
5.2.2 Mixing Intensity
The second key mixing factor is mixing intensity. Here mixing intensity is loosely defined as power (energy dissipation rate) per unit volume, shear rate, or apparent fluid/agitator tip velocity. These terms will be used interchangeably to represent the mixing intensity throughout the book.
Mixing intensity, similar to mixing time, can vary over several orders of magnitude. Table 5.2 lists the landscape of mixing intensity of various mixing methods. As shown, the mixing intensity vary widely among different methods, from impinging jet/baffle, rotor/stator homogenizer to stirred tanks.
For stirred tanks, the simple rule of thumb can be the tip speed, which is proportional to ND. It can also be energy dissipation rate or power per unit volume, which is proportional to N3D5/D3 or N3D2. Since their dependence on D, which represents the diameter of tank or one‐third power of the batch size, are different, it is obvious that these mixing intensity indexes cannot be maintained the same across different scales. Figure 5.2 illustrates the requirement of agitator rate (rpm) at different scales under constant tip speed and constant power/volume criteria. Using the 1000 l size crystallizer at 100 rpm as reference, the agitator rpm for the 100 ml crystallizer would be 2000 based upon constant tip speed rule, or 800 based upon the rule of constant power/volume rule. These values are clearly different.
Table 5.2 Mixing intensity landscape of different methods.
| Method | Mixing intensity (energy dissipation rate, watts/liter) |
|---|---|
| Sonication/cavitation | 1 000–100 000 |
| Impinging jet or impinging baffle | 1 000–100 000 |
| High shear rotor/stator homogenizer | 100–5 000 |
| Static mixer | 10–500 |
| Stirred tank | 0.1–10 |
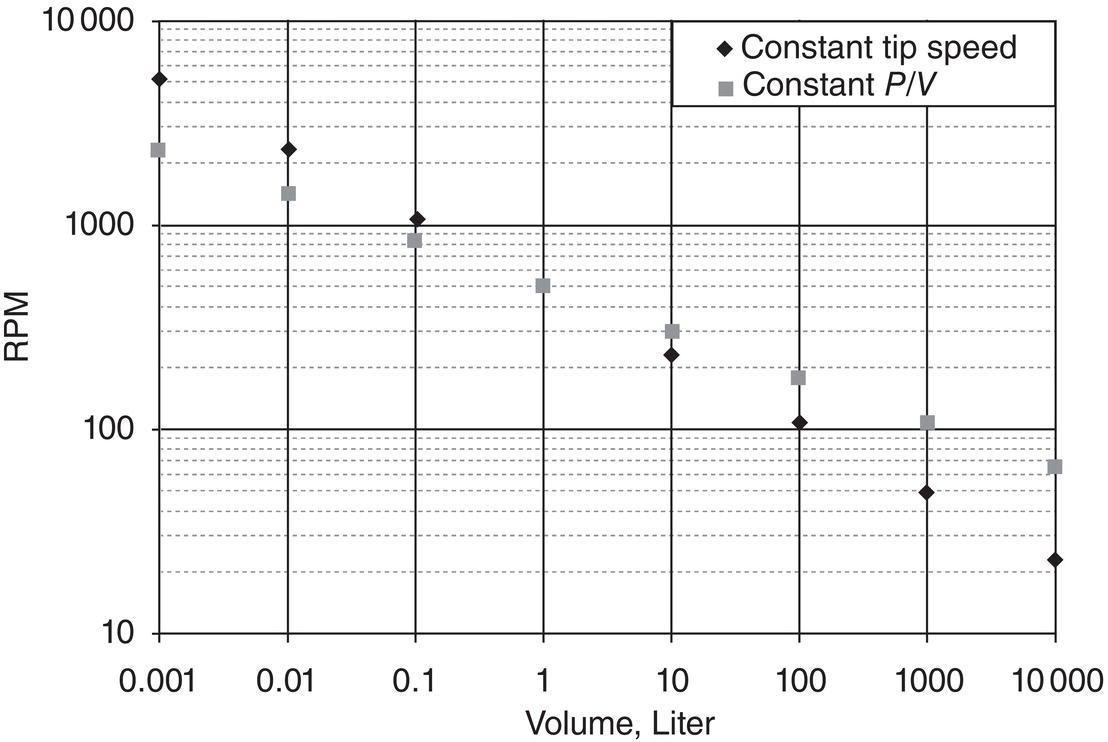
Figure 5.2 Relationship between agitator rpm and crystallizer volume, under constant tip speed (diamond) and constant power/volume (square).
Additional note is that either value can cause vortexing and splashing of slurry in a 100 ml laboratory crystallizer based upon the actual observations. Therefore, these simple rules can be subject to other operational constraints.
In comparing the mixing time, which is proportional to N, and mixing intensity, which is proportional to ND0.6–1, it should also be obvious that it is impossible to match both the mixing intensity and the mixing time of stirred tanks at different scales. Referring back to Figure 5.1, in order to match the mixing time upon scale‐up, it is necessary to increase the mixing intensity. Equivalently, if the mixing intensity is kept constant upon scale‐up, the mixing time will be longer upon scale‐up.
5.2.3 Mixing Distribution
The third and most unique mixing behavior is mixing distribution, especially in stirred tank upon scale‐up. For fluidized bed, impinging jet, rotor–stator homogenize or mixing‐T in‐line mixer, etc., mixing distribution is less an issue.
Generally, when the batch size is small, such as in microscale range, it is reasonable to assume the entire batch is uniformly mixed with similar mixing intensity throughout the entire crystallizer/mixer. So, there is less mixing inhomogeneity or distribution issue. However, upon scale‐up when the batch size increases, such as in mesoscale or macroscale ranges, mixing becomes non‐uniform and mixing distribution issue arises. This factor will be detailed in Section 5.5 of scale‐up.
5.3 MIXING EFFECTS ON NUCLEATION
5.3.1 Primary Nucleation
The effects of mixing on primary nucleation are exceedingly complex. The overall result is a reduction in the width of the metastable region when this width for a static solution is compared to that of an agitated solution (see Chapter 2). Therefore, an unagitated solution can, in general, be cooled further before the onset of nucleation than an agitated solution. Since an industrial system with few exceptions will always be agitated, this is of theoretical interest only. (Exceptions are for operations such as melt and freeze crystallization in which such issues are key factors; see Chapter 13 in this book; Mullin 2001, pp. 343ff.; Mersmann 2001, pp. 663ff.)
In a mixed solution without crystals present and at constant supersaturation, increased mixing intensity can reduce the induction time—the time elapsed after mixing to create supersaturation to the time crystals first appear. Induction time decreases up to a critical speed, after which it remains unchanged (Myerson 2001, p. 145). Additional discussion may be found in Chapter 4.
5.3.2 Secondary Nucleation and Particle Breakage
Since secondary nucleation is dominant as soon as nuclei appear, the nucleation mechanisms become virtually impossible to characterize in an industrial operation. In addition, any seeded crystallization is by definition secondary even though some nuclei may simultaneously form by a primary or other secondary mode mechanism. Therefore, the majority of this discussion will focus on secondary nucleation.
The effect of agitation on secondary nucleation has been reported in the literature, and several references are discussed by Mullin (2001). Secondary nucleation is mixing dependent as follows:
- Crystal–crystal impact: a function of both the local micro‐mixing environment and the overall macromixing circulation
- Crystal–impeller and crystal–wall impact: functions of impeller speed, shape of the blade, and material of construction
These factors, along with the other intrinsic nucleation properties of the crystallizing substrate, affect the rate of nucleation, which in turn determines the number of nuclei formed and their size. This complex relationship is strongly dependent on the specific system characteristics but, in general, the nucleation rate increases rapidly with increasing energy input as detailed in Chapter 4. This high dependence is especially true for reactive crystallization with fast reactions. The reader is referred to Chapter 10 for a discussion of this topic, as well as to Sohnel and Garside (1992).
Depending upon the mixing intensity, it can break‐up agglomerates or crystals in the slurry. Figure 5.3 shows the impact of low power sonication on particle de‐agglomeration. These agglomerates are vividly de‐agglomerated into primary particles without noticeable particle breakage.

Figure 5.3 Impact of mixing intensity on de‐agglomeration: agglomerates without sonication (left), and individual particles with sonication (right).
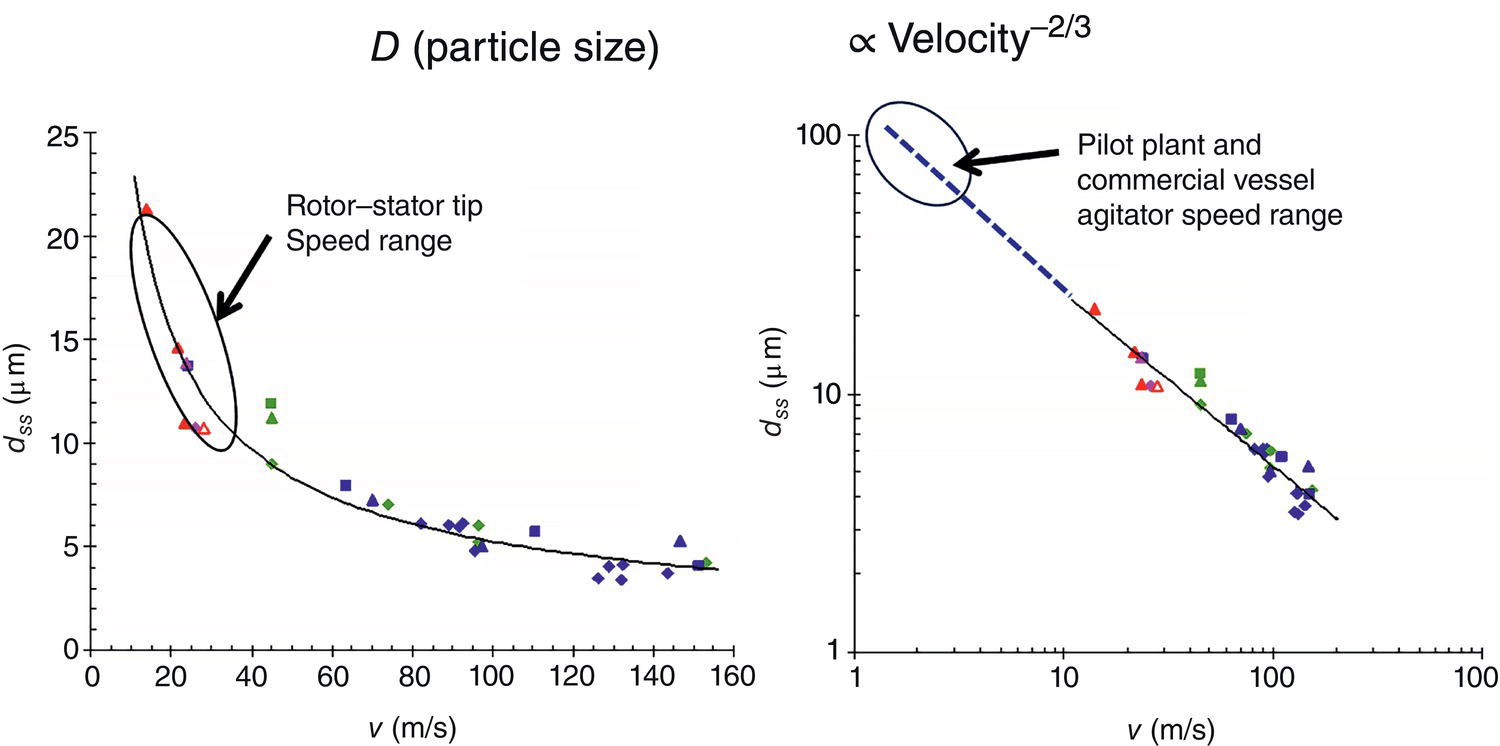
Figure 5.4 Impact of mixing intensity on particle breakage/attrition.
Source: Tung (2013) with permission American Chemical Society.
Furthermore, Figure 5.4 shows the impact of mixing intensity, i.e. fluid/tip velocity, on particle breakage using varying types of high‐shear wet mills.
Very noticeably, there is an excellent correlation between the apparent fluid/tip velocity (v in m/s in the X‐axis) and the resulting particle size at steady state (d in the Y‐axis). This correlation appears to be applicable to different high shear mixers as well, i.e. rotor/stator homogenizer, stirred tank agitators, high pressure cavitation, etc. It should be mentioned that this curve is not aligned with results from media mills where the particle breakage is induced by grinding crystals with media balls in a confined space chamber. This curve enables us to dial in specific particle size range of interest by selecting the proper fluid velocity with minimum trial‐and‐error. Another interesting observation is near the region around 3–7 m/s and resulting particle size of. Equivalently, if the particle size is greater than ~100 μm, the particles will be broken down to this range. Since the nominal agitator tip speed of pilot‐plant or manufacturing stirred tanks falls into this region, as a corollary, particles with sizes greater than ~50–100 μm would likely be subjected to particle breakage during the crystallization. Consequently, it is recommended not to grow crystals beyond this size limit in order to avoid the complication of particle breakage in the pilot plant or commercial vessels. This recommendation certainly does not apply to fluidized bed crystallization.
5.3.3 Damkoehler Number for Nucleation
It is helpful to visualize the relationship between mixing and nucleation rates through an analogy with the reaction Damkoehler number (Da). The Da number for reaction is defined as
in which mixing time and reaction time can be the time required from the initial state (time zero) to 95% or other percentages of the final state. The mixing time is usually a measure of local mixing where the reaction is occurring. However, local mixing times vary over a wide range in a stirred vessel in which the reactants are subject to varying local mixing times.

Figure 5.5 Reaction yield as a function of the reaction Da number; mixing sensitivity for chemical reactions is analogous to mixing sensitivity in crystallization nucleation and growth, from low sensitivity at low Da to high sensitivity at high Da.
As shown in Figure 5.5, at low values of the Da number, the reaction yield is insensitive to mixing, whereas at high values of the Da number, the reaction yield is sensitive to mixing. The reader can find a more detailed discussion on this concept in Chapter 13 of Paul et al. (2003).
By analogy, a Da number for nucleation could be visualized as a ratio between mixing time and induction time:
Mixing time and induction time can be the time required from the initial state to 95% or other percentages of the final state.
As shown in Figure 5.6, at low values of this ratio—fast mixing and long induction time—mixing would have a minimal effect on nuclei size, whereas at high ratios—slow mixing and short induction time—mixing effects would be critical to nuclei size. Local supersaturation could be visualized as a parameter as shown.
For slow‐nucleating systems that have long induction times or equivalently wide metastable zone widths, the location of the feed point and the impeller energy input may not be as important as for higher values of the ratio in determining the size—and number—of nuclei that can be generated in regions of the feed stream. This analogy also parallels that used in reacting systems in evaluating the requirements for micro‐mixing of reagents.
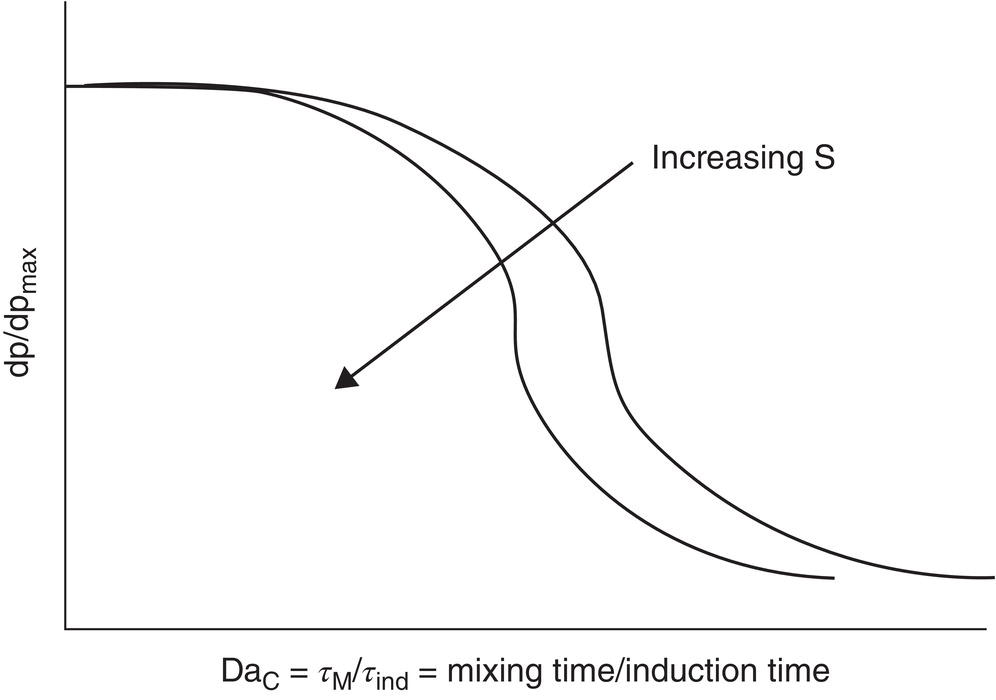
Figure 5.6 Particle size as a function of a crystallization Da number (the ratio of mixing time/nucleation induction time).
For reactive crystallization processes, in addition to mixing time and induction time, we may need to consider the reaction time in the analysis. A fast reaction (high Da for reaction) could be readily seen as sensitive to the local mixing environment of two reactive streams. It could generate locally a high product supersaturation due to the fast reaction. This, in turn, could generate small particles as in precipitation which can have very short induction time. However, if the product has a long induction time, i.e. low Da for nucleation, the local high supersaturation regions can be mixed with the rest of the system and distributed throughout the vessel before nucleation. The PSD would not be sensitive to micro‐mixing or meso‐mixing but may still be sensitive to macro‐mixing and other mixing issues, such as impact with the impeller and other crystals.
If the reaction rate is slow compared to the mixing rate, the reactants can be dispersed throughout the vessel before they react. The resulting product solution concentration will be more uniform throughout the vessel. The operation could be thought of as being determined by crystallization parameters rather than the reaction rate.
For pharmaceuticals, most of the reactive crystallization processes are salt formation from an acid and base. In this situation, the reaction rate is generally much faster than the mixing or crystallization rate, and the mixing sensitivity depends primarily upon the magnitude of the induction time, or Da for nucleation.
It should always be kept in mind that mixing and nucleation time can be arbitrarily defined as the time required from the initial state to, for example, 95% of the final state. These values are also affected by other operating factors, such as the type of solvent, temperature, degree of supersaturation, flow ratios of two streams, and vessel geometry.
It cannot be overemphasized that the Da number also depends upon the “scale.” On the one hand, we can see the mixing time as primarily determined by the scale of the mixing device. Mixing time in microscale devices, which can be considered equivalent to the time for microscale mixing, is always faster than the mixing time in large‐scale vessels. On the other hand, induction time is not considered to be a function of scale. Thus, a nucleation process may perform successfully in the laboratory using a small vessel (mixing time shorter than induction time) but fail to produce the expected mean particle size and PSD in the pilot plant or factory vessels (mixing time longer than induction time) because of the local nonuniformity of concentration and its effect on nucleation induction time.
Clearly, the key to a successful scale‐up of this process is to maintain the mixing time at the pilot plant and factory scale below the threshold which would cause the process to move down the curve of Figure 5.6. This can be best accomplished by using a special mixing device, such as an impinging jet, to approach the same mixing time at all scales. The reader can find more information on impinging jets and crystallization in Section 5.6.3 and Examples in Chapter 9.
5.3.4 Scale‐Up of Nucleation‐Based Processes
Nucleation events can dominate the entire crystallization operation with respect to both physical and chemical purity attributes. Ultimate crystal size as a function of the number of nuclei generated is summarized in Table 4.3, where the nominal dimensions of resulting crystals (spherical, flat plates, and needle‐shaped) are shown as a function of the number of nuclei or seed particles added. It can be seen that the number of nuclei generated by the various causes of nucleation—including agitation—has a negative exponential effect, as expected from this purely geometrical relationship, on the ultimate size that can be achieved by growth subsequent to nucleation. The nucleation rate, particularly contact nucleation, can increase on scale‐up because all key parameters of (stirred tank) mixing cannot be held constant. For example, scaling up at equal power per unit volume results in an increase in impeller tip speed. The resulting average particle size could then be reduced because, after the increased nucleation, there are more particles for a reduced amount of substrate to grow on. In addition, other mixing factors that affect growth could increase the size distribution further, such as oiling out and agglomeration as discussed in Section 6.4. The nature of these interactions is the key factor in causing difficulty in scale‐up of nucleation‐based crystallization processes—even with small quantities of seed.
The critical mixing factors in a stirred tank are impeller speed and type, as well as their influence on local turbulence and overall circulation. Since all aspects of these factors cannot be maintained constant on scale‐up either locally or globally, the extent to which changes in the crystallizing environment will affect nucleation is extremely difficult to predict. To the mixing issue must be added the uncertainties caused by soluble and insoluble impurities that may be present in sufficiently different concentrations from batch to batch to cause variation in induction time, nucleation rate, and particle size.
The severe problems associated with nucleation‐based operations, some of which, especially in stirred vessels, are directly caused by mixing issues, lead to the conclusion that dependence on nucleation can be problematic in achieving reproducible results on scale‐up and/or in ongoing production.
If no process alternative is possible to avoid dependence on nucleation, mixing scale‐up can be based on equal power per unit volume, assuming that the same impeller type is used. In most cases, however, this approach will result in changes in PSD on scale‐up that may or may not be acceptable. In general, as suggested by Nyvlt (1971), the PSD will be broader and the average particle size will be smaller if this scale‐up criterion is used. As often experienced in crystallization scale‐up, however, the opposite can occur, depending on the specific nucleation characteristics of the system. A further generalization is that rapid nucleation tends to produce the smaller size distribution on scale‐up, whereas slow nucleation can give the opposite result.
A more robust way to accomplish consistent scale‐up of a nucleation‐driven approach is to apply specially designed rapid mixer with high mixing intensity such as impinging jet crystallization and/or in situ wet seed generation technique. For these approaches, the high mixing intensity can achieve rapid mixing of streams at high local energy dissipation rates to the molecular level, before and during nucleation. By matching the energy dissipation rate at different scales, the desired mixing time and intensity from laboratory‐scale devices to production scale can be achieved. This technology is discussed in Chapters 9 and 10.
Several references on nucleation provide excellent insight into this complex phenomenon, including Mersmann (2001), Mullin (2001), and Myerson (2001).
5.4 MIXING EFFECTS ON CRYSTAL GROWTH
5.4.1 Mass Transfer Rate
Mixing can obviously have a large effect on the mass transfer rate of growing crystals through its effect on the film thickness. This influence is dependent on both the size of the crystals and the mixing intensity. As mixing intensity increases, mass transfer rate increases and film thickness decreases up to a limit, beyond which the effects approach limiting values.

Figure 5.7 Schematic representation of concentration gradients from bulk solution to growing surface.
The concentration gradient in the film is illustrated in Figure 5.7, where it can be seen that supersaturation conditions are present throughout the film. When crystallization is diffusion limited, concentration in solution drops significantly from that in the bulk (Cb) to that in the film (Cf), which is close to that at the crystal growth surface (Csurf). When growth rate is primarily limited by resistances to surface incorporation, the larger drop in concentration is across the film. The thickness of the film will determine the time available for nucleation within it. The new nuclei are either shed into the bulk or attach as shards to growing surfaces. In both cases, the effect will be to limit growth.
Large crystals (>100 microns) may be more subject to film mixing issues than smaller ones because crystals less than 10–20 microns are approximating the Kolmogoroff eddy size and tend to follow these eddies. These differences in crystal size can change the growth rate limitation from film control in large crystals to intrinsic growth rate control in small ones.
As an illustration, Figure 5.8 shows the impact of low power sonication on crystal growth rate. As shown in the figure, with increase of sonication power, supersaturation decreases and the crystal growth rate constant increase several orders of magnitude with negligible increase of total particle count. For slow growing crystals, increasing mixing intensity, in this case sonication, can be a feasible option.
5.4.2 Da Number for Crystallization
The Da number concept has been applied to crystallization by Garside (1971) and Garside and Tavare (1985) by the development of an effectiveness factor for growth by comparing the growth rate at the interface conditions to the growth rate expected if the interface were exposed to the bulk solution conditions. The Da number in their work is defined as the ratio of the surface integration rate to the mass transfer rate through the film.
The definition of Da number defined in this book is different. It is defined as the ratio of mixing time to crystal growth or nucleation time. The effectiveness factor varies in an S‐curve from 1.0 at low Da to zero at high Da. A value of 1.0 would indicate pure surface integration growth where mixing effects are unimportant, while a low value approaching 0 would indicate pure diffusion growth with high sensitivity to mixing. Regions between these limits represent a combination where both growth and mixing have an effect.
The Da number for crystal growth can be defined as
or equivalently

Figure 5.8 Impact of mixing intensity on crystal growth.
Again, mixing time and supersaturation release time can be those required to achieve 95% or percentages of the final state.
Similar to the discussion of the Da number for nucleation, at low Da values for crystallization—fast mixing and slow release of supersaturation—mixing would not affect crystal growth, whereas at high ratios—slow mixing and fast release of supersaturation—mixing effects would be critical to PSD, as fast local crystal growth may occur.
For systems with a slow release of supersaturation, the location of the feed point and the impeller energy input may not be as important as for those with higher values of the ratio in determining the size of crystals that can grow in regions of the feed stream.
Depending upon the nature of the crystals and the operating environment, authors have observed a wide range of release rates of supersaturation. The time scale for the release of supersaturation can vary from fractions of seconds to days (or longer). Due to the wide variation in release rate of supersaturation, the inherent concepts of the Da number for crystallization provide a useful way to readily identify the potential mixing sensitivity issue of a particular crystallization process.
5.4.3 Conflicting Mixing Effects
Factors that improve with increased mixing in a stirred tank are (i) heat transfer, (ii) bulk turnover, (iii) dispersion of an additive such as an antisolvent or a reagent, (iv) uniformity of crystal suspension, (v) avoidance of settling and minimization of wall scale, and (vi) minimization of impurity concentration at the crystallizing surface.
However, these factors must be balanced against the possibly negative results of overmixing that can result in crystal breakage and/or shedding of nuclei as well as increased secondary nucleation.
These concerns lead to the conclusion, referred to above, that it is often necessary to choose a mixing condition (impeller speed, type, etc.) that may not be optimum for every aspect of the crystallization and may actually not be optimum for any of them. In many cases, however, one end result (i.e. PSD, bulk density, uniformity of suspension, and approach to equilibrium solubility [yield]) may dictate the choice of mixing conditions. In this case, it becomes essential to determine if the negatively affected aspects can be tolerated. If these problems are occurring in operation in a stirred vessel, a different type of crystallizer, such as a fluidized bed, might be used to promote crystal growth and minimize nucleation.
5.4.4 Experimentation on Mixing Effects
All of these factors are properties of a given crystallization system, thereby requiring choices for each specific operation. Experimentation is required to determine the key responses to mixing for each system and could include determination of the following:
- Effect of impeller type (axial or radial) and speed on PSD under low and high supersaturation and slurry density. These results can indicate the sensitivity of the system to mixing.
Note: A small response could indicate that other system properties were controlling (i.e. inherent crystal growth rate or nucleation rate). A large response would indicate sensitivity to secondary nucleation and/or crystal cleavage and require additional experimentation and evaluation of scale‐up requirements. The laboratory results should be evaluated relative to each other since scale‐up can be expected to make additional changes in PSD, especially when a large response is experienced in these simple experiments.
Effect of impeller speed on crystallization rate and approach to equilibrium solubility (yield). Failure to achieve equilibrium solubility may indicate accumulation of impurities at the crystallizing surfaces. An increase in impeller speed resulting in further reduction in solution concentration could indicate resumption of growth or additional nucleation (see Example 5.1).
- Suspension requirements, as indicated by the settling rate to achieve off‐bottom suspension (see Section 5.6).
- Effect of feed pipe location (for antisolvent and reactive crystallizations) (see Section 5.6.1).
For nucleation‐dependent operations, it is recommended that additional information be obtained as follows:
- Effect of impeller speed and type on the width of the metastable region.
- Effect of impeller speed and type on the rate of nucleation.
Note: This experimentation is focused primarily on evaluation of mixing sensitivity. Other experimentation on crystallization issues is beyond the scope of this discussion.
5.4.5 Effects of Mixing on PSD
The effect of mixing on PSD has been experimentally examined for the reactive crystallization of calcium oxalate (Marcant and David 1991). This work is an excellent example of the multiple dependencies on mixing that can be experienced in a crystallization operation. The factors noted above that are mixing dependent are shown to have positive or negative influences on the resulting physical characteristics, thereby illustrating the necessity of selecting the most important result to be achieved. Increasing the agitator speed is shown to initially cause an increase in particle size, followed by passing through a maximum and then decreasing particle size. This result is attributed to changes in controlling factors resulting from the changes in mixing. This experimental result provides an excellent justification for both variable‐speed drive and subsurface feed.
Experimental results indicating the sensitivity of particle size and PSD to the location of the feed stream may be used to confirm the sensitivity of a compound to mixing. If no sensitivity is observed, it may be concluded that intrinsic factors such as slow growth or low nucleation rate are dominant. For additional discussion, see Section 5.6.1.
5.5 MIXING DISTRIBUTION AND SCALE‐UP
The most unique mixing feature upon scale‐up is mixing distribution. When the batch size is small, it is reasonable to assume that the entire batch is well‐mixed with similar mixing intensity throughout the entire crystallizer. Using computational fluid dynamics (CFD) simulation software, Figure 5.9 compares the local mixing intensity per “micro‐mixing time” (based upon the typical relative mixing definition) between a 250 ml crystallizer and 2000 l crystallizer under the constant overall power per volume criterion. As evident by the color and its distribution, the local mixing intensity and micro‐mixing time are much more uniform in the 250 ml crystallizer than those in the 500 gal crystallizer.

Figure 5.9 Comparison of mixing uniformity (using micro‐mixing time) of different vessel size under constant P/V criterion.
Source: Tung (2013), with permission American Chemical Society.
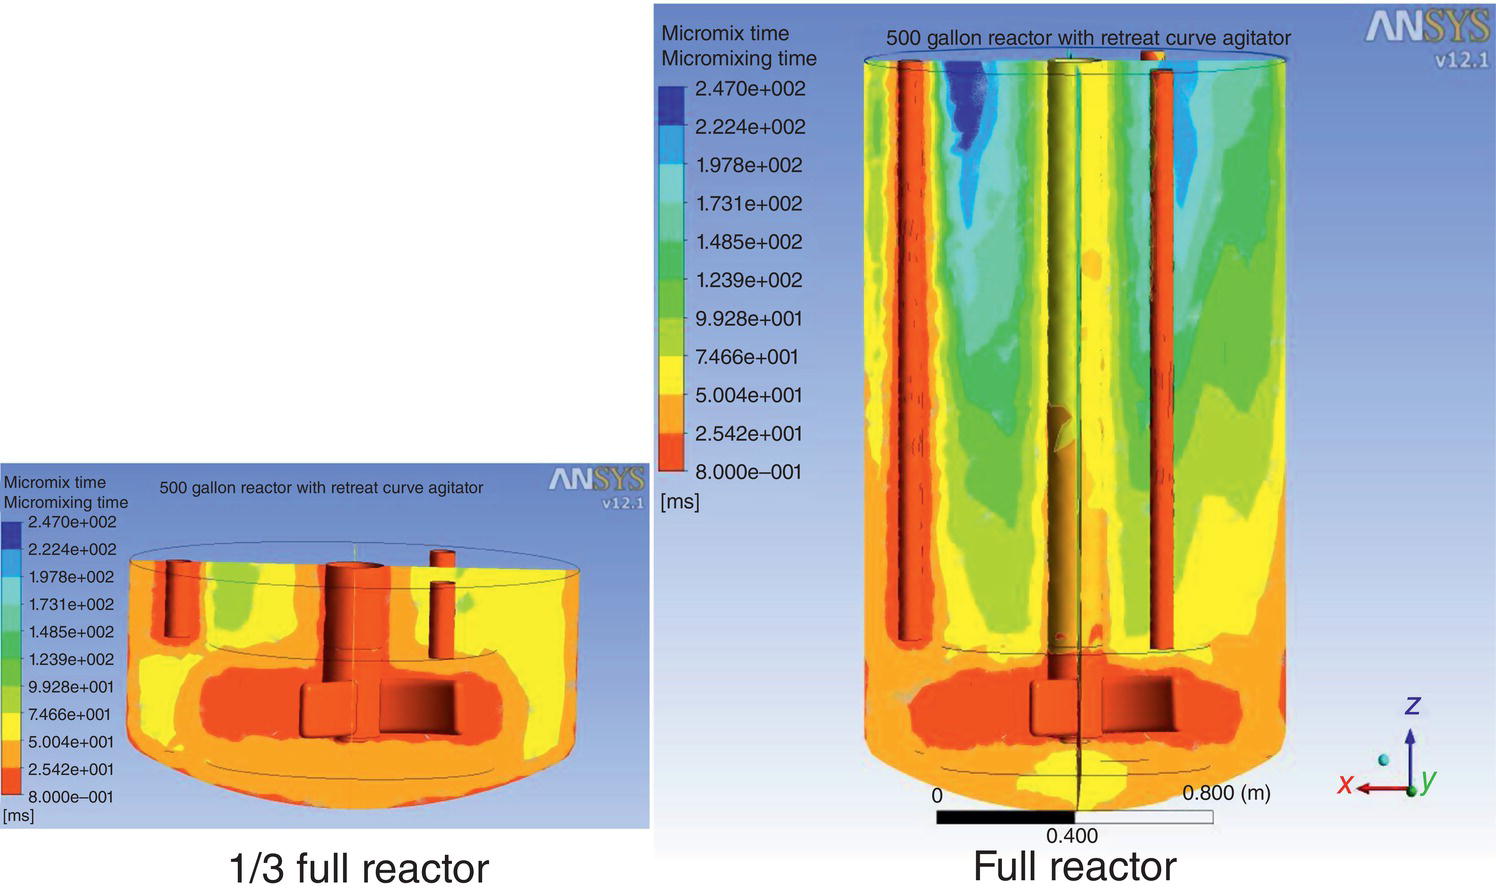
Figure 5.10 Comparison of mixing uniformity (using micro‐mixing time) of different filled volume under same tip speed.
Source: Tung (2013), with permission American Chemical Society.
The vessel fill volume can equally affect the mixing distribution as well. Under the constant tip speed criterion for the identical 2000 l crystallizer, Figure 5.10 illustrates that the local mixing intensity and micro‐mixing time are more uniform for the one‐third‐filled scenario than those of the completely filled scenario.
CFD results are reliable in predicting the hydrodynamic behaviors of a single liquid phase system. As is evident from the above figures, it can be highly effective to highlight and diagnose the mixing issues, beyond the traditional mixing rules or empirical correlations by constant tip speed or power per unit volume. However, efforts are required initially to build the database of different vessels and agitators into the CFD.
5.5.1 Power
The compromises in mixing optimization that may be required on scale‐up often result in the use of the common mixing criterion of equal power per unit volume or, in some cases, equal tip speed. Both of these recommendations are more relevant for utilization of the same impeller type as well as geometric similarity. Laboratory evaluation of the mixing requirements for a crystallization operation should be carried out in a minimum 0.004 m3 l vessel (4 l) for preliminary data and a further evaluation at 0.1–1 m3 as practical.
Smaller‐scale operations will generally produce a more uniform PSD and a larger mean crystal size than the manufacturing scale (typically ~10 m3) when using equal power per unit volume. These changes typically are caused by the local differences in impeller shear (an unavoidable result of the equal power per unit volume criterion) that cause increased nucleation leading to a larger number of particles, an increased spread in PSD, and a smaller particle average diameter.
Guidelines other than equal power per unit volume were suggested by Nienow (1976) that can be helpful in avoiding this local over‐mixing. Using this guideline, the agitator speed at the manufacturing scale would be selected to be sufficient to just maintain off‐bottom suspension, thereby resulting, in addition to reduced shear damage, in reduced nucleation, fewer particles, and more growth. In general, this speed would be considerably less than equal power per unit volume, depending primarily on the density difference between the suspending solvent and the crystals and their size.
Limitations on this guideline would be high‐density crystals that require possibly damaging higher speeds to achieve the just‐suspended condition. In addition, antisolvent and reactive crystallization applications may require higher speeds to prevent local supersaturation at the point of addition. In the latter case, scale‐up based on equal local energy dissipation at the point of addition may be necessary.
A further caution on reduced speed is a possible increase in encrustation caused by crystal contact with the bottom surface with insufficient fluid force to prevent wall growth.
5.5.2 Off‐Bottom Suspension
The requirements for particle off‐bottom suspension are also discussed in many literature references including Zwieterling (1958), Choudhury et al. (1995), and Paul et al. (2003, chapter 10). Methods of calculating various degrees of homogeneity in solids are presented. These calculations are an important part of crystallization scale‐up studies.
5.6 CRYSTALLIZATION EQUIPMENT
The three types of crystallizers summarized in Table 5.1 achieve operation in extreme mixing environments, thereby providing a wide variety of contacting capabilities. Equipment choice can be tailored to specific needs of supersaturation control—high or low—and mixing intensity—high or low—as well as other aspects of the operation. However, as discussed in the sections that follow, it may be difficult to find one mixing system for a stirred tank that can satisfy all the needs of a specific crystallization operation. Fluidized beds and impinging jets can be designed and operated in narrower regions of mixing intensity, low and high, respectively, and may therefore be tailored to meet all the needs for a particular operation when matched to the specific needs of that system.
Incorporation of an external recirculation loop with in‐line mixer appear to offer widest micro‐mixing, meso‐mixing, and macro‐mixing requirements. It can be a good option to serve as general purpose crystallizer.
5.6.1 Stirred Vessels
5.6.1.1 Alloys and Stainless Steels
A stirred vessel crystallizer is shown in Figure 5.11. Included are a dual‐impeller pitched‐blade turbine with a “tickler” blade, a subsurface addition line, baffles, and a ram‐type bottom outlet valve to aid in discharge of slurries.
The workhorse impeller is the pitched‐blade turbine because of its ability to create good circulation at relatively low shear. These attributes help reduce secondary nucleation and crystal breakage while achieving good suspension and circulation. The flat‐blade turbine is less versatile because of high shear and less overall circulation. The Ekato Intermig has proven to have superior performance in some crystallization operations because of its combination of excellent circulation and low shear.

Figure 5.11 Typical stirred vessel crystallizer.
Baffles are required in all cases to prevent poor mixing due to swirling as well as entrainment of vapor which can provide nucleation sites. Baffles may also have an important effect in minimizing foaming. Propellers and hydrofoils are not normally suitable for multipurpose service in heterogeneous systems—especially in the event that nucleation and growth may pass through a stage involving sticky solids, as discussed above in Section 5.4.1.
5.6.1.2 Glass‐Lined Vessels
The versatility of the glass‐lined vessel in a large variety of chemical environments has made it the most common in the industry. For these reasons, a crystallization step may be carried out in an equipment train in a glass‐lined vessel whether or not this is required to prevent corrosion. These reactors range in size from 80 to 20 000 l or more. One limitation in the use of glass‐lined vessels related to mixing and heat transfer is that the limit of the temperature difference between jacket and batch is ~125°C. However, such temperature extremes are not often encountered in crystallization. (The manufacturer should be consulted for specific limitations on the type of glass lining and base metal in use.)
The retreat‐blade and anchor impellers that have been widely used for many years are now being replaced by glass‐lined turbines and other shapes that have been recently developed by the manufacturers using sophisticated methods of applying the glass to more sharply angled shapes. These turbines are available for vessels as small as 80 l, although shafts with removable, interchangeable impellers are not currently available for tank sizes smaller than about 1200 l. These limitations are subject to additional improvement, and it is recommended that the specific vendors be consulted for updated information.
These new impellers, especially in multitier configurations, have greatly improved the mixing capabilities of the glass‐lined reactor by providing increased shear and circulation. A number of glassed impeller types are now available including curved‐ and pitched‐blade turbines. Some examples of these are shown in Figures 5.12, 5.13, and 5.14. In addition, two or three turbines mounted on a single shaft are now available for larger vessels (>3 m3). The lower turbine can be positioned within ~10 cm of the vessel bottom. For single turbines in larger vessels, however, the low turbine position may not provide the desired overall circulation.

Figure 5.12 GlasLock® glass‐lined steel impellers.
Source: Courtesy of De Dietrich process systems.
The three manufacturers of glass‐lined mixing systems use different methods of attachment of the blades of the impeller(s) to the shaft as summarized in Table 5.3.
5.6.1.3 Baffles
Although glassed baffle design has significantly improved mixing performance, most glasslined vessel applications utilize only a single baffle in order to maximize the number of tank nozzles available for other purposes. Two manufacturers, DeDietrich and Tycon, offer modifications to include multiple baffles in their mixing systems.

Figure 5.13 Cryo‐Lock® impellers.
Source: GMM Pfaudler.
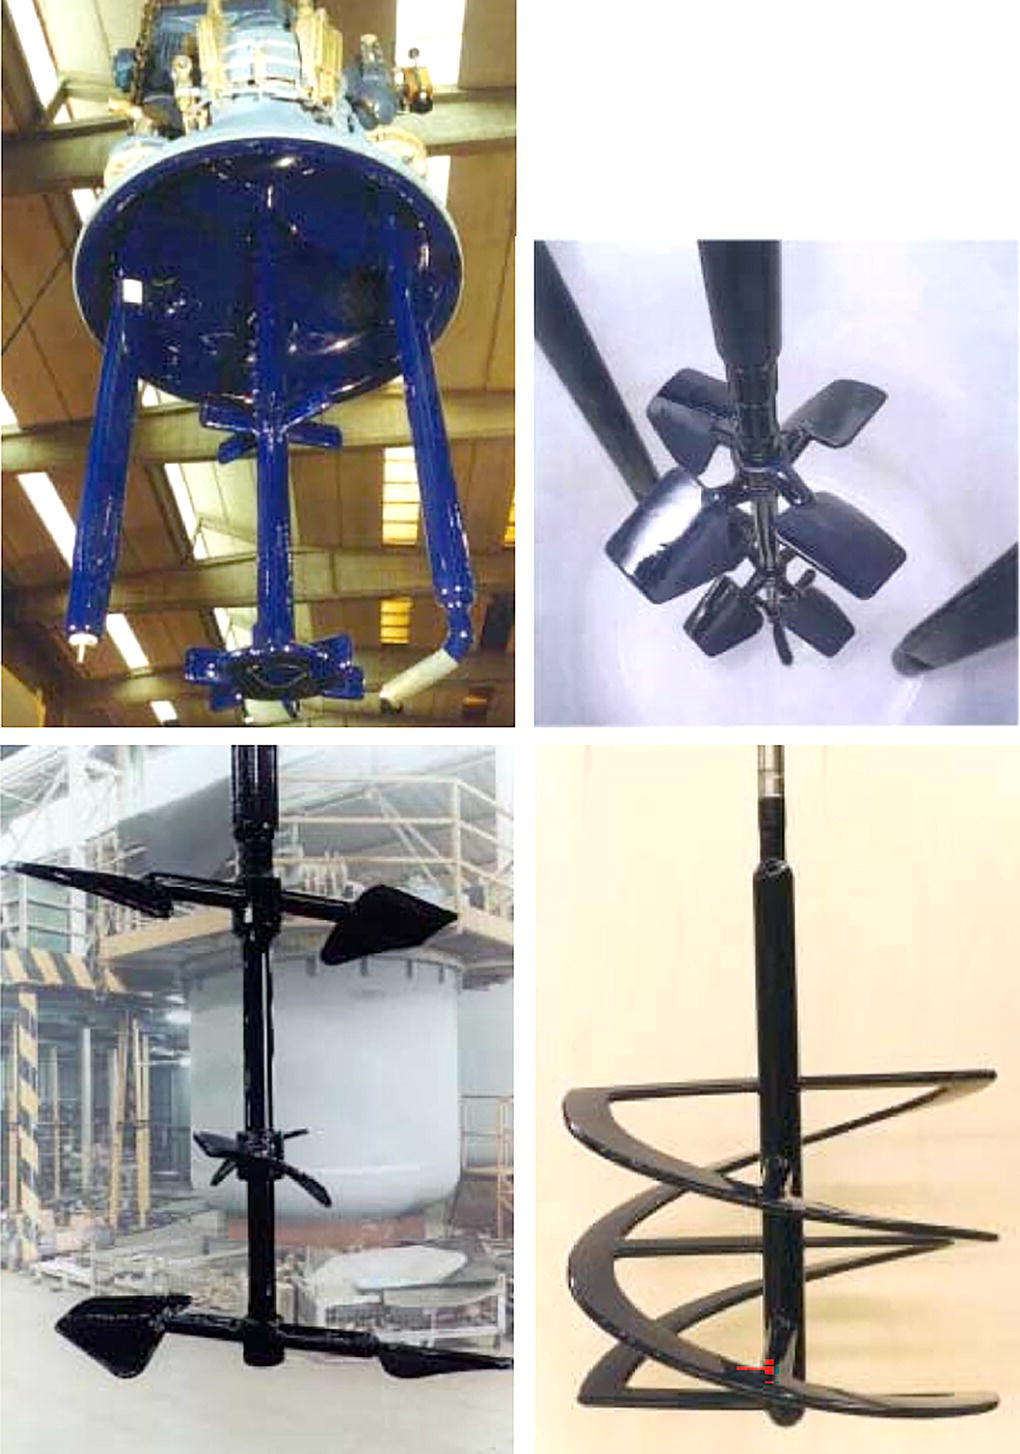
Figure 5.14 ElcoLock® and fixed impellers® impellers.
Source: ROBBINS & MYERS, INC.
Table 5.3 Glass‐lined impellers and their methods of attachment.
| Blade attachment | Removable | Variable pitch | |
|---|---|---|---|
| DeDietrich | GlasLock® Friction fit of blades into holes in the hub | Yes | Yes(within power limit of motor and drive) |
| Pfaudler | Cryo‐Lock® Liquid N2 cooling to shrink the shaft | Yes | No(different pitches available) |
| Tycon | Elcolock® | Yes | No(different pitches available) |
5.6.1.4 Variable‐Speed Drive
The use of variable‐speed drives in pilot plant and manufacturing plant vessels is recommended for development and scale‐up of crystallization processes. This capability provides the opportunity for critical experimentation at the pilot plant scale to determine the effect of impeller speed on PSD and other variables. On the manufacturing scale, the ability to change impeller speed is the most readily adjustable parameter for manipulation on scale‐up. Modern variable frequency drives provide an excellent means to vary speed over a wide range. The added cost of variable‐speed capability is minimal compared to all other methods of changing mixing parameters and may be one of the most effective ways of solving scale‐up problems and providing versatility for multipurpose operations. In addition, speed changes can be utilized in troubleshooting in plant operations that are not meeting expected results.
5.6.1.5 Subsurface Addition Lines
Another key factor in successful pilot plant and manufacturing plant operation is the appropriate use of subsurface addition of antisolvents and reactive reagents for crystallization and precipitation. The primary purpose of subsurface addition is the introduction of the agent causing supersaturation in the region of intense micro‐mixing in the vessel to avoid local excess supersaturation with the associated potential for increased nucleation.
The effect of the feed point has been shown to be dramatic in the reactive crystallization of calcium oxalate, as reported by Marcant and David (1991). The conclusion was reached that determination of the sensitivity of crystallization to feed point location can provide information on controlling factors. In a laboratory development program, therefore, an effective method of determining the importance of mixing effects is to run experiments with two or more feed points—a surface feed and an impeller feed—and at two different impeller speeds. If no difference can be found in the PSD and mean particle size, mixing effects may not be controlling and other aspects such as inherent growth rate may be dominant. As discussed in Sections 5.3.3 and 5.4.2 on the use of the Damkoehler number concept, the need for effective location of a feed line may be evaluated from a comparison of nucleation and mixing rates.
The mixing texts referenced above contain extensive discussion of the importance of the location of feed streams. While these studies are primarily concerned with reagent feed for chemical reactions and the influence of local turbulence on reaction selectivity, the same issues are encountered in the addition of antisolvents and reagents for reactive crystallization because nucleation is a function of supersaturation, whether local or global.
The location of the point of introduction and the diameter and flow rate of the addition stream are key to successful operation and scale‐up. Generally, the optimum location is at the point of maximum turbulence, as characterized by the shortest mixing time constant. This point is in or near the impeller discharge flow. For the down‐pumping pitched‐blade impeller, this point would be just above the impeller so that the flow would be rapidly mixed by passing through the impeller blades. For a radial flow flat‐blade turbine, it would be directed into the discharge flow.
Feed introduction on or near the surface of a stirred vessel can have dramatic effects on a crystallization process because unwanted oiling out, nucleation, and/or agglomeration can occur in these poorly mixed zones. It is recognized that mechanical design and cleaning issues may make the use of subsurface lines more difficult. However, it cannot be overemphasized that the negative effects on a manufacturing‐scale operation can be far more costly than provision of the necessary mechanical requirements. For alloy vessels, the mechanical issues are minimal. For glass‐lined vessels, the use of Teflon tubing attached to the baffle has been effective.
Cleaning issues can be resolved by providing for removal of the subsurface line between batches or during turnaround.
The diameter of the subsurface line is also a key factor with crystallization, as it is with reactions. If the diameter is too large, the incoming stream may produce regions of high supersaturation before it can be effectively blended to the molecular level. Large‐diameter pipes can also be subject to reverse flow in which the crystallizing mixture is forced into the pipe, where it is subject to meeting the incoming antisolvent in a nearly stagnant region, leading to nucleation and possible solid accumulation and plugging.
Extensive analysis and experimentation on dip‐pipe design has been carried out by Penney and co‐workers (Jo et al. 1994), and the reader is referred to this work for specific design recommendations for diameter and flow rate. Their recommendations are summarized in Table 5.4 for six‐blade flat‐blade and three‐blade high‐efficiency down‐pumping impellers. These recommendations should be followed to prevent dip‐pipe back‐mixing, enhance local blending, and prevent solids plugging.
In the Table 5.4, D and T are the impeller and tank diameter, respectively, G is the distance from the feed pipe to the impeller, and Vf/Vt,min is the recommended minimum ratio of the velocity in the feed pipe to the velocity in the tank at the feed pipe location.
The importance of the feed location for chemical reactions has been clearly established by the work referenced above and many others. The literature contains less data on crystallization. However, undesired nucleation is potentially present for all crystallization systems, depending on the nucleation rate and the degree of local supersaturation. The analogy between reaction sensitivity and supersaturation sensitivity can be visualized through the concepts represented by the Damkoehler number, as discussed in Sections 5.3 and 5.4.
Table 5.4 Recommended minimum Vf/Vt for selected geometries for turbulent feed pipe low conditions.
| Case | Impeller | Feed position | D/T | G/D | Vf/Vt,min |
|---|---|---|---|---|---|
| 1 | 6BDa | Radial/mid‐planec | 0.53 | 0.1 | 1.9 |
| 2 | 6BDa | Above/near shaftd | 0.53 | 0.55 | 0.25 |
| 3 | HE‐3b | Radial/mid‐planeb | 0.53 | 0.1 | 0.1 |
| 4 | HE‐3b | Above/near‐shaftd | 0.53 | 0.55 | 0.15 |
a Six‐blade disk turbine.
b High‐efficiency three‐blade down‐pumping turbine.
c Injection radially inward toward the impeller at its mid‐plane at a distance G.
d Injection downward into the impeller at about D/4 from the centerline of the impeller shaft and G/D above the impeller mid‐plane.
As in scale‐up of chemical reactions, it is important to consider the relative time constants of mixing and nucleation in order to estimate which part of the S‐curve applies to a particular system. Although this determination is conceptual, the insight provided by such analysis can be helpful in establishing operational design criteria.
5.6.1.6 Discharge of Slurry
Efficient discharge of the crystal slurry to the next process vessel—usually a filter—is required to prevent yield loss by settling or to achieve the necessary degree of crystal slurry homogeneity for satisfactory filter loading or other subsequent operations. The mixing obviously changes as the slurry is discharged and can result in an unsatisfactory degree of settling after passing the impeller or an unsatisfactory degree of homogeneity for the subsequent operation. “Tickler” impellers are often used, as shown in Figure 5.11, to provide mixing until the discharge is nearly complete. These may be custom designed and fitted by the manufacturer. The diameter of the tickler blade is usually one‐half to two‐thirds the diameter of the main impeller, and thereby requires little power and does not create sufficient shear to be harmful.
Selection of pumps for discharge may also be a significant issue with regard to energy input and slurry pumping capability. Crystals that have been carefully grown and are ready for high rate filtration can be reduced in size by pump shear to drastically reduce the filtration rate. This is especially problematic for recycle pumps in filter equipment feed loops.
Low‐shear pumps can be effective in limiting shear damage and include lobe and diaphragm pumps. The reader is referred to an analysis of pump and transfer energy by Mersmann (2001, pp. 454ff.) to aid in design of slurry transfer and control of flow.
Shear damage on transfer can be eliminated by gravity transfer when equipment layout includes the necessary vertical clearances.
5.6.1.7 External Re‐Circulation Loop with In‐Line Mixer
As mentioned early, another means to address the nonuniform mixing environment is the use of an external recirculation loop shown in Figure 4.28. Such a design has been employed to study the impact of micro‐mixing (feed line and in‐line mixer), meso‐mixing (recirculation loop), and macro‐mixing (stirred tank crystallizer) independently (Torbacke and Rasmuson 2001). Given its flexibility in controlling the local and overall mixing environment, along with its ease of implementation with the existing facility, this scheme is gaining a wider acceptance in the pharmaceutical industry, in particular if wet‐milled seed or in situ generated seed is used for the crystallization process (Yang et al. 2016; Wilson et al. 2018; Meng et al. 2020; Yang et al. 2021). Since seed can be generated under a controlled mixing environment under supersaturation, this scheme can be applied for semicontinuous or continuous mode of crystallization operations, including fluidized bed crystallization as discussed in Chapters 7 and 13 examples.
A typical configuration of single‐stage rotor–stator as in‐line mixer is shown in Figure 5.15. Both rotor and stator consist of multiple teeth. During operation, the stator remains stationary and rotor rotates at high rpm with a typical tip speed in tens of meters/second. The fluid/slurry in the loop and the feed stream flow into the mixer, passes through the teeth of rotor/stator under high mixing intensity to ensure excellent mixing of these two streams, and exits at the outlet back to the loop. The high mixing intensity ensures rapid micro‐mixing time and also accelerate the crystallization kinetics, especially the nucleation rate.

Figure 5.15 Configuration of a single stage rotor/stator mixer—top view (left) and side view (right).
While the residence time in the mixer is short (second or less), a small temperature rise (fraction of degree) will take place for slurry passing through the mixer. With continuous recirculation, heat will accumulate and batch temperature can quickly rise over tens of degree. Consequently, the crystallizer jacket temperature needs to be adjusted at a lower temperature to absorb the heat and maintain batch temperature. This inherent heat‐and‐cool cycling of the batch will facilitate the digestion of attrited fine particles and also smoothen defects on crystal surfaces, which in general is beneficial for crystallization.
5.6.2 Fluidized Bed Crystallizer
An important alternative type of crystallizer is the fluidized bed. One fluidized bed design is shown in Figure 5.16. As shown, the supersaturated solution enters at the bottom of the crystallizer and the clear, partly, or fully depleted solution exits at the top of the crystallizer. The slurry is suspended in the crystallizer by the upward liquid flow, which usually lies in the laminar and transition flow domain. When designed with a tapered bottom section of modest included angle to minimize flow separation, the hydrodynamic flow pattern is much closer to the plug flow within a tube than that in a continuously stirred tank. Therefore, the crystallizer can exhibit a high degree of homogeneity with a very low degree of back‐mixing at the same height of the bed, but the slurry concentration and PSD can vary along the height of the bed. This is a sharp contrast to the “homogeneous” mixing of slurry within a stirred tank.
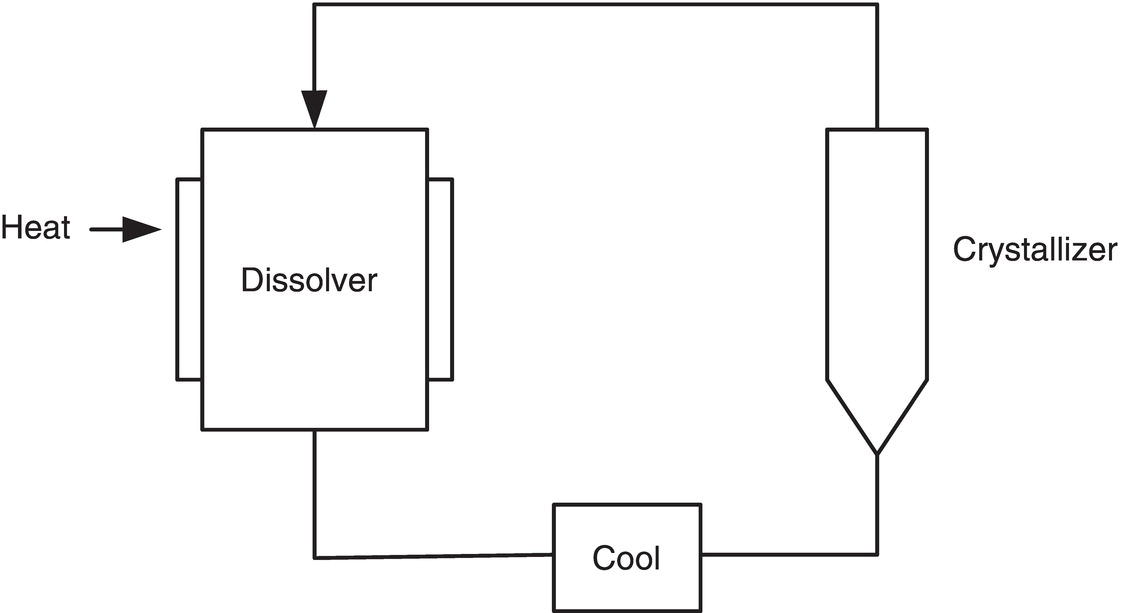
Figure 5.16 Fluidized bed crystallizer and dissolver.
Due to its low turbulence intensity, fluidized bed crystallization is very effective in minimizing nucleation by providing very low shear, low energy, and minimum velocity impact between crystals. The operation can achieve growth by operating at low supersaturation and in the presence of a large surface area for growth.
This technology is used primarily in cooling crystallization instead of antisolvent or reactive crystallization. Thus, residence time, instead of mixing time of two streams, would be more appropriate for the definition of the Da number, as well as for scale‐up design. A major advantage of continuous and semicontinuous operation that can be realized with fluidized beds is that the seed is always present, thereby eliminating the need for timing of seed introduction and other aspects that have been discussed as variables in batch and semibatch operation. Initial seed preparation becomes critical to success; methods for growing initial seed are presented in Chapter 6. Once grown, however, the ongoing growth on the seed continually renews the supply. Methods of crystal cleavage to maintain seed PSD are also presented in Chapter 6.
Both continuous and semicontinuous operation can be utilized. This principle has been successfully applied in the resolution of optical isomers in which nucleation must be minimized, and preferably eliminated, to achieve isomer separation, as described by Midler (1970, 1975, 1976) and presented in Examples 7.6 and 13.6 in this book. PAT Tools for monitoring PSD online, such as in‐line particle size analyzer, are very applicable here.
5.6.3 Impinging Jet Crystallizer
Impinging jet crystallization achieves the opposite extreme of mixing, compared with fluidized bed crystallization, of high shear and energy input in small regions. As shown in Figure 5.17, two (or multiple) streams of high velocity are impinged upon each other, which results in a rapid localized intense mixing of these streams. Depending upon the mixing intensity and detailed design of the impinging jet device, the mixing time of the two streams can be fractions of a second and can be shorter than the induction time. As a result, this device can be used to generate a high level of supersaturation for a nucleation‐dominant process. At the optimum mixing effectiveness, an impinging jet can mix the feed streams to the molecular level in less than the induction time, thereby allowing nucleation under uniform conditions throughout the operation.
This principle has been successfully utilized in an industrial application to achieve a small average particle size (3–5 microns) and a narrow PSD. For impinging jet crystallization, industrial operation is described by Midler et al. (1994), with variants by Lindrud et al. (2001) (impinging jet crystallization with sonication) and by Am Ende et al. (2003) (specific reference to reactive crystallization). Laboratory studies are reported by Mahajan and Kirwan (1996), Benet et al. (1999), Condon (2001), and Hacherl (Condon) (2003). Johnson (2003) and Johnson and Prud’homme (2003) report on the use of impinging jets to produce nanoparticles stabilized by block copolymers.

Figure 5.17 Impinging jet crystallizer.