
Chapter 11
Filtration
11.1 INTRODUCTION
Filtration is an important unit operation which separates the desired species from the undesirable species by their sizes through a filter medium. It is a standard unit operation employed in many industries, including pharmaceutical, chemical, medical, biological, waste‐water treatment, air purification, etc.
In filtration operation, there can be three different cases. In the first case, the retentate is the desired species. The filtrate is the undesired species. This applies to the isolation of active pharmaceutical ingredients (APIs) solids and any solid intermediates. In this context, the slurry resulting from the crystallization is a mixture of the suspended solids of valuable product and the solvents or mother liquor containing undesired impurities together with some dissolved valuable product. After the filtration, the cake is retained and filtrate is discarded. The cake is further washed with pure solvents to wash off residual mother liquor from the cake. Complication can arise when the cake traps non‐negligible amount of undesired species and cannot meet the desired purity specifications. Other complications can arise as well, such as too much loss of desired product in the mother liquor and washes due to particle breakthrough the filter medium. Also, cake can be compressed or filter medium is (partially) blocked by fine particles in the slurry. Both factors can hinder the filtration operation.
In the second case, the opposite becomes true. The retentate is the undesired species and the filtrate or supernatant is the desired species. This can also occur during the manufacturing of pharmaceuticals. For example, a solution containing dissolved APIs or intermediates is filtered through a solid bed/filter media. The solid bed can be active carbon which is used for absorbing color impurities from the solution. Or the solid bed can be catalyst which is used for catalyzing the reaction. Or it can simply be a polishing filter for removing any extraneous matter suspended in the solution. After the filtration, the solid bed can also be washed with pure solvents to reduce loss of desired species in the solid bed. Complication can arise when too much desired species is retained in the solid bed, or undesired species is not sufficiently filtered off and fine particles still breakthrough.
In the third case, both the filtrate and retentate contain the desired species. This can occur during the manufacturing of pharmaceuticals, for example resolution of optical isomers or isolation of desired polymorph. In these scenario, as described in Examples 7.4, 7.5, and 7.6, a stream of slurry are filtered via cross‐flow filter or liquid/solid is separated via fluidized bed. The retentate is retained in the same vessel, whereas the filtrate is sent to another vessels for further processing. As noted, the filtration operation is fully integrated into the crystallization process, and it is a continuous operation. More details can be found Chapter 7, Section 7.2 and Chapter 13, Example 13.6.
The main focus in this book will be the first case where the desired species are the solid cake retained by the filter media. For pharmaceuticals, filtration/washing is an integral part of downstream operation to isolate the final solid API after the crystallization. Filtration/washing is also an indispensable unit operation to isolate the solid intermediates in the synthesis of API. After the filtration and washing operations, the cake will be dried to evaporate off the residual liquid. Drying operation will be covered in the next chapter.
For additional reading materials, there are excellent references of filtration unit operation. In particular, Ripperger et al. (2012, 2013) provides a comprehensive description of filtration from fundamental operations to equipment. Dakkuri and Ecanow (1976), Ruslim et al. (2007), Estime et al. (2011), Mahdi and Holdich (2013), am Ende et al. (2019), etc. also share useful information with case studies on this topics.
11.2 BASIC PROPERTIES
11.2.1 Particle Size
For filtration, the basic property to be considered is particle size of desired species to be retained. Depending upon the applications, the species size can vary over several orders of magnitudes, for example:
- Individual molecule, such as aspirin, size can be ~1.0 nm.
- Micelles, which can be surfactant, polymeric, and phospholipid‐based, size is typically <100 nm.
- Liposome, which is formed by phospholipid as bilayer, size can range 80–300 nm.
- Drug solid particles with various chemical structures, size can range 0.1 μm—few hundred μm.
Based upon the size of these particles, the filtration operation can be classified as micro‐filtration, ultra‐filtration, nano‐filtration or reverse osmosis as shown in Figure 11.1. As classified, for filtration of drug solid particles, it falls into the category of micro‐filtration. The range of particle size for drug solid particles can be from submicron to few hundred microns.
In addition to particle size, particle morphology (or aspect ratio).and size distribution are two sub‐properties which can also affect the filtration and washing performance. In general, the smaller the particle size is, the slower the filtration. Also, for crystals of higher aspect ratio, i.e. one‐dimensional needle‐like or two‐dimensional plate‐like crystals, the filtration will be slower in comparison to crystals of lower aspect ratio, i.e. three‐dimensional rod‐like crystals. Multimodal particle size distribution with non‐negligible percentage of fines can also slow down the filtration, in comparison to unimodal particle size distribution with similar mean particle size.
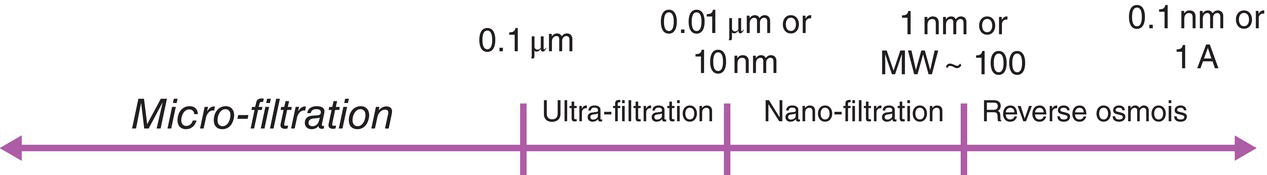
Figure 11.1 Classification of filtration operations.
11.2.2 Filter Medium
The next property is filter medium. There are a wide range of materials used as filter medium. Table 11.1 lists some common filter media as per authors’ knowledge.
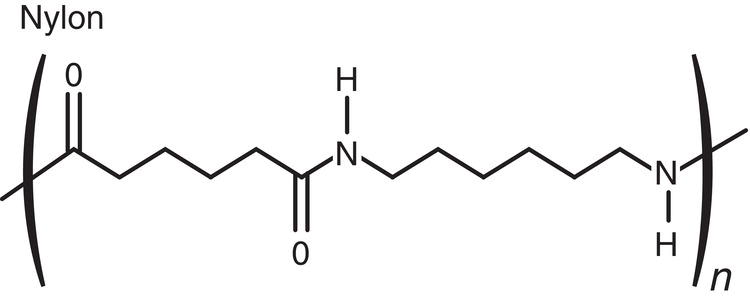
For pharmaceutical application, the first attribute of filter medium is its chemical compatibility. As shown in Table 11.1, sintered metal, i.e. Hastelloy‐C, and Teflon‐type filter media offer the widest range of chemical compatibility. Polypropylene and nylon are also good choices for general solvents, for example alcohols, ketones, esters, or alkanes. Cotton is more limited in organic solvents, in comparison to other filter medium. But it is very suitable for filtering under aqueous condition (except under strong acidic condition).
The second attribute of filter media is its pore opening. In general, all these filter media offer a good range of choice from submicron to tens of micron. Therefore, pore size is generally not a limiting factor. In practice, pore opening from 5 micron to 20 micron works well for the majority of filtration needs of API and solid intermediates. To minimize potential particle break through, two or three layers of filter media can be layered together within the filter. Also, in the event of breakthrough, especially at the beginning of filtration, the thickness of wet cake will increase over time. As wet cake thickness increases, the wet cake serves effectively as the secondary filter medium to eliminate the breakthrough.
Table 11.1 Types of material used as filter medium.
| Material | Compatibility |
|---|---|
| Sintered metal (including Hastelloy C, etc.) |
|
Teflon (including PTFE, etc.)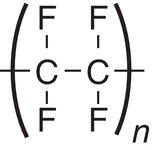 |
|
Polypropylene (including polyethylene, etc.)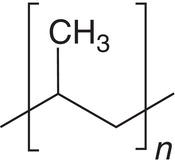 |
|
 |
|
Cotton (including cellulose, etc.) |
|
Note: Ceramic is not included in the table.
11.2.3 Wash Solvents
The third basic element is cake wash solvents. In general, the same solvent system used in the crystallization will be used as cake wash solvent. Mother liquor after the crystallization generally will contain dissolved impurities and these impurities need to be washed away from the cake. Using the same solvent system as used in the crystallization we can avoid unexpected precipitation of these impurities while using different solvents.
After washing the cake with the solvent system used in the crystallization, alternative solvents other than those used in the crystallization can be used. For example, if the crystallization solvents contain high boiling‐point solvents such as water, a different water‐miscible low boiling point solvent can be used afterward. This is to facilitate the subsequent drying operation. Clearly, these alternative solvents need to have a lower solubility of API than the original crystallization solvents as well. Otherwise, it may cause a higher loss of material through these alternative wash solvents.
There are also cases where alternative wash solvents are introduced in order to facilitate the conversion of crystal form, i.e. from hydrate to anhydrate, or solvate to non‐solvate. For example, a hydrate is generated during the crystallization. During the cake wash, an anhydrous solvent is introduced. Upon (slurry) washing the hydrate with the anhydrous solvent, the hydrate can convert to anhydrate.
11.2.4 Temperature
Temperature will be another important element. Typically, the filtration temperature should be the same as the temperature at the end of crystallization, instead of the room temperature. If the crystallization temperature is below room temperature, the filtration and wash temperature should also be maintained at the same crystallization temperature.
Both pot‐type filter and centrifugal‐type filter can have jacketed features. The temperature requirement can be fulfilled without any difficulty.
11.3 KINETICS
Filtration operation can be broken down into three basic steps. As shown in Figure 11.2, in the first step, the slurry is transferred to the filter from the crystallizer. By applying pressure differential or centrifugal force across the filter medium, the supernatant, namely mother liquor, will filter through the filter medium and the solid will be retained by the filter medium.
There are two types of driving force for filtration. For pot‐type filter, the driving force is applied static pressure upstream or applied vacuum downstream after the filter medium. In the laboratory, pressure differential is typically created by vacuum from downstream. Special laboratory set‐up for filtration study can also apply a few atmospheric pressure at the upstream. In the pilot plant or commercial factory, both vacuum and pressure can be applied simultaneously.
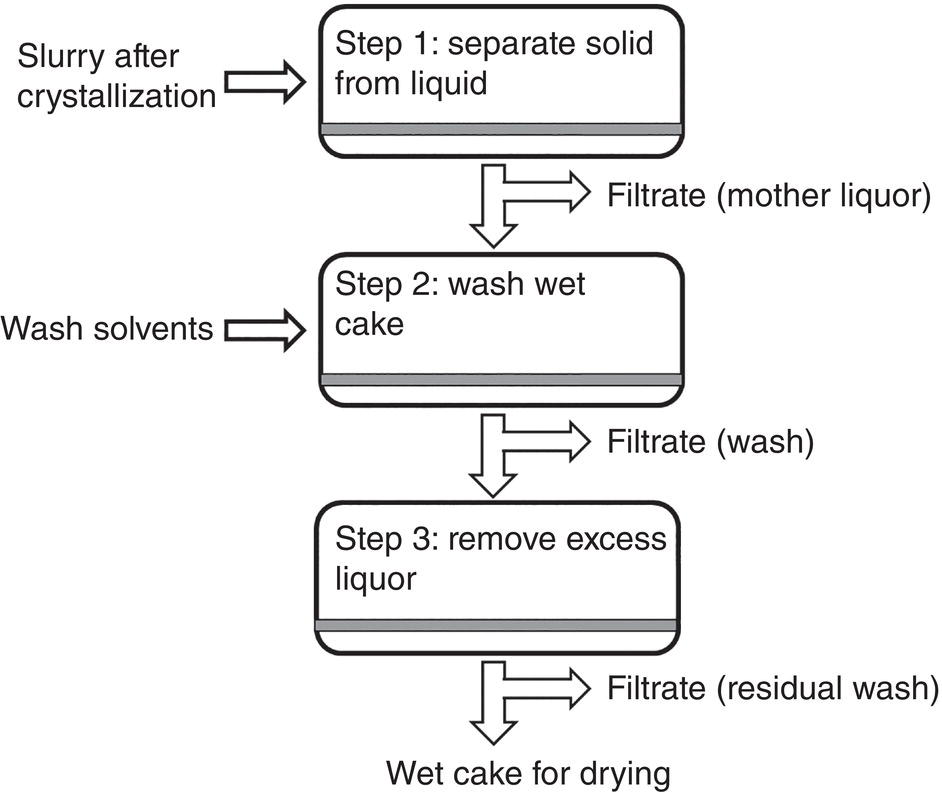
Figure 11.2 Filtration and washing steps—Step 1: solid–liquid separation, Step 2: cake wash; Step 3: excess liquor removal.
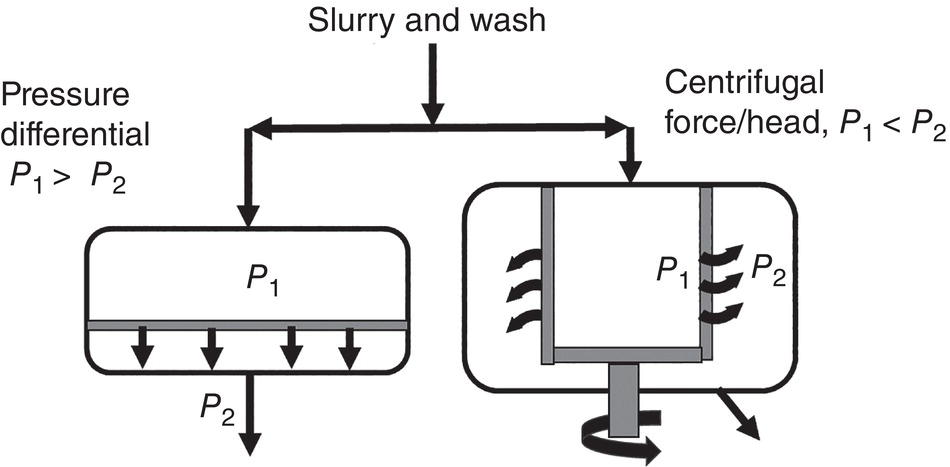
Figure 11.3 Driving force in filtration/washing.
(Note: P1 > P2 for pot‐type filter, and P1 < P2 for centrifugal type filter)
For the centrifugal‐type filter, the driving force is the centrifugal force, not the pressure before and after the centrifuge (Figure 11.3). The magnitude of centrifugal force (or centrifugal head) would be dependent upon the centrifuge spinning rate and radius of the centrifuge as shown in the equation below:
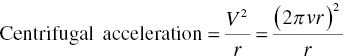
where V is the velocity, v is the spinning rate (or rpm), r is the radius of the cake in the centrifuge which can be approximated as radius of centrifugal basket, and G is the gravitational acceleration.
The centrifuge spinning rate v is adjustable and can range from few hundred rpms to few thousand rpms. The radius of centrifuge may vary from tens of centimeter to over a meter. Accordingly, the centrifugal acceleration can vary from hundreds to thousands of gravitational acceleration.
During the first step of filtration, the overall filtration rate can decrease gradually. As more solid is deposited on the filter medium, it increases the overall filtration resistance, thus filtration rate would decrease (Figure 11.4).
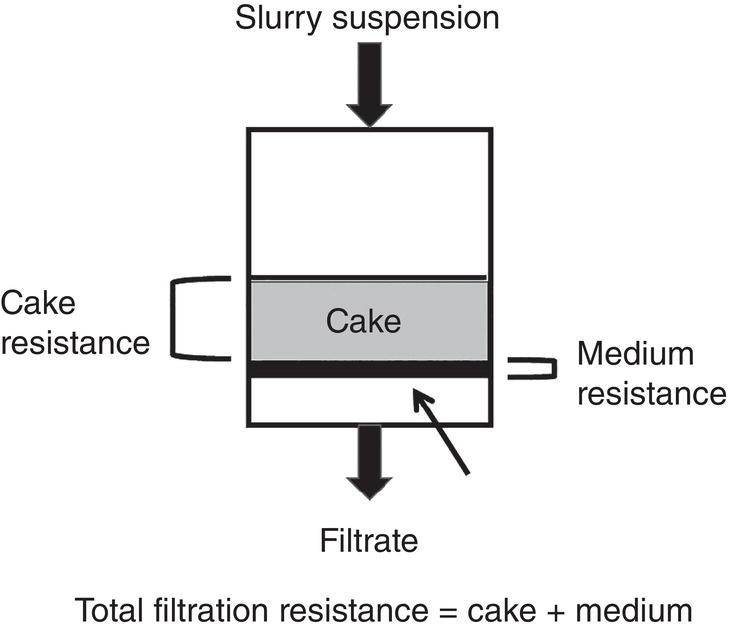
Figure 11.4 Filtration resistance—cake and medium.
After the first step of filtration, the wet cake retained by the filter medium will still contain a certain amount of mother liquor. The amount of mother liquor can vary widely, for example from 20 to 80% of the total wet cake weight. The mother liquor can contain non‐negligible level of dissolved undesired impurities which are rejected during the crystallization. In order to remove the residual mother liquor containing these impurities, in the second step, fresh solvents (i.e. washes) are charged to wash away the residual mother liquor from the wet cake. A thorough cake wash is essential to effectively remove the residual mother liquor and the associated impurities in the mother liquor.
During the second step which is cake washing step, the pressure differential across the wet cake or the centrifuge spinning rate remains unchanged or increase gradually in order to overcome the increase of filter cake resistance. However, over pressuring should be avoided in order to maintain a good cake wash without forming cracks in the wet cake. Controlling pressure differential can also facilitate filtration to avoid increase of filtration resistance of compressible cake.
In the third step, the pressure differential across the wet cake or centrifugal spinning rate can increase to maximum in order to deplete as much as possible residual washes in the wet cake, until no more filtrate is being observed.
11.3.1 Filtrate Concentration Profile During Filtration/Washing
During filtration, slurry is forced through a filter medium whose pore sizes are smaller than the average particle size of the solid particles present in the slurry. Therefore, the liquid phase passes through the medium, while the solid phase is retained by the medium. During this process, cake is built up over time on the filter medium. The cake forms a porous medium that filtrate will pass through. In the first step of filtration/washing (Figure 11.2), the filtrate will be primarily mother liquor, containing the dissolved desired species and impurities. In the second step of filtration/washing (Figure 11.2), wash is introduced to displace mother liquor from the wet cake. The concentration in the filtrate will contain the residual mother liquor initially and will drop to (or below) the solubility level of desired species in the wash.
Figure 11.5 illustrates three types of concentration profiles during this filtration/washing process.
- Curve A: flow with a step change of concentration
- Curve B: flow with axial dispersion
- Curve C: flow with axial dispersion, as well as diffusion from dead end pore and/or by‐pass through cracking in the cake
Curve A represents the ideal scenario that all mother liquor is displaced by the wash without any mixing between the wash and mother liquor in the cake. When all mother liquor is displaced by the wash, the concentration of exit liquid will drop immediately. This is certainly the ideal theoretical case. In actual practice, when wash flows through the wet cake, it passes through a tortuous path through the interparticle space. There will be some degree of mixing between the wash and residual mother liquor in the cake. This is shown as Curve B with axial dispersion. Furthermore, if the wet cake is not deposited uniformly on the filter media, it can create cake cracking which has less filtration resistance for liquid flow. Therefore, wash will bypass the bulk of the wet cake and pass through these cracking without displacing the mother liquor as desired. This is shown as Curve C.
This channeling/bypassing phenomenon is further illustrated in Figure 11.6. In Figure 11.6, from left to right), it shows the mother liquor (dark region) is displaced by the wash (gray region containing cake). The displacement front is uneven and some wash penetrates through the wet cake faster than the rest of the wash. This channeling or bypassing phenomenon will inevitably lead to incomplete removal of mother liquor from the cake and is highly undesirable for removal of impurities.
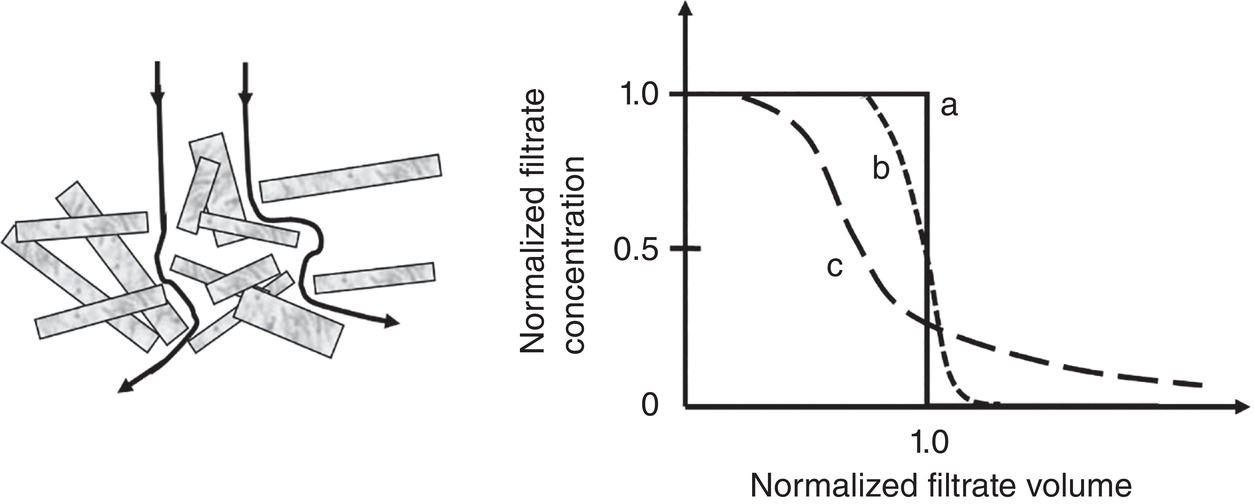
Figure 11.5 Filtrate concentration profiles (curves a, b, c) during filtration and washing.
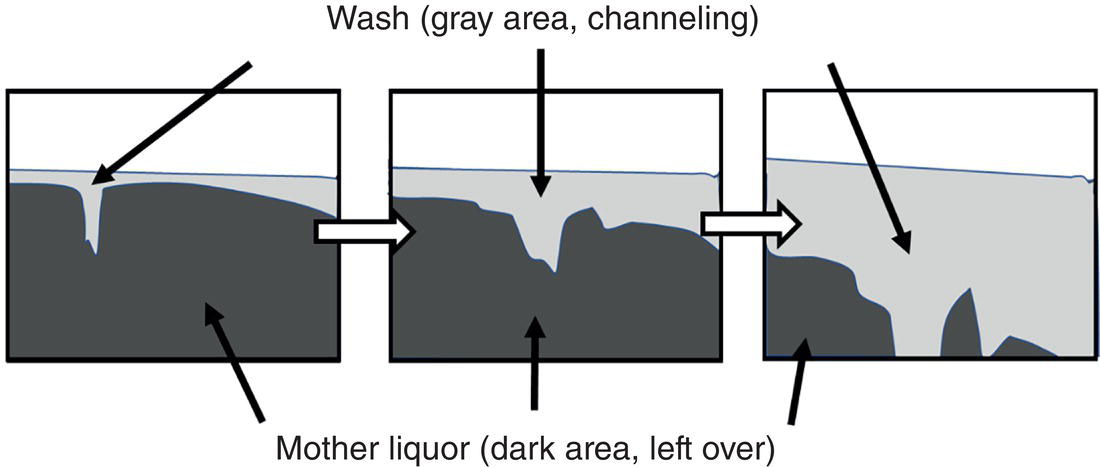
Figure 11.6 Cake wash with channeling and mother liquor left‐over.
Per authors’ opinion, the risk of bypassing increases upon scale‐up. One cause is that the height of cake will generally increase upon scale‐up, and also filter surface area also increase. Since cake height increases, it increases overall filtration resistance through the wet cake. If there are weak spots in the filter surface, such as the junction between the filter wall and wet cake, liquid will flow more preferentially through these weak spots. The other cause can simply be a bigger filter surface area. It is more challenging to ensure even distribution of wet cake on the filter surface, and so is the even distribution of cake wash to cover the entire wet cake surface. Given these considerations, it is essential to have a proper equipment set‐up and cake washing protocol minimize the risk of incomplete wash.
11.3.2 Filtration and Cake Wash Protocol
To accomplish a proper cake wash for removal of impurities. Here are factors for consideration during the filtration/washing operations:
- How to form an evenly distributed wet cake?
- How to wash the wet cake uniformly with minimum bypassing to ensure successful removal of mother liquor/impurities
In Step 1, it is critical to ensure formation of an evenly distributed wet cake. If slurry is fed into the filter from a single point pointing downward directly, the wet cake is unlikely to be evenly distributed. Furthermore, the stream of feed slurry may “dig” hole on the surface of the wet cake which is highly problematic for the operation, to say the least. To address this issue, one approach is to design the feed pipe to have multiple “side” discharge openings so that feed stream will be sprayed across and fall onto the entire filter medium. Another common practice is to smooth the wet cake surface periodically during this step. As to the centrifugal filter, this need is naturally achieved by rotating the centrifuge filter continuously during the filtration.
Near the end of Step 1, when there is no more liquid above the top surface of wet cake, another precaution is avoidance of over‐deliquoring of wet cake. While deliquoring may reduce the amount of mother liquor within the wet cake, it also generates “dead” spots in the wet cake which cannot be washed away during the Step 2 cake washing. Figure 11.7 shows a cake washing study by Ruslim et al. (2007), where C* is the dimensionless remaining impurity level. The data clearly show that for the non‐deliquored cake, i.e. saturated cake, washing can effectively remove the impurities from the wet cake nearly 100%, and is highly efficient. On the other hand, for the de‐liquored cake, washing efficiency drops linearly as degree of wet cake saturation decreases. With this study and other similar experience by authors, it is recommended to avoid deliquor the wet cake, so the bulk of the wet cake remains saturated at the end of Step 1 filtration. Certainly, for the excessive liquor layer on top of the surface of wet cake, it can be filtered out.
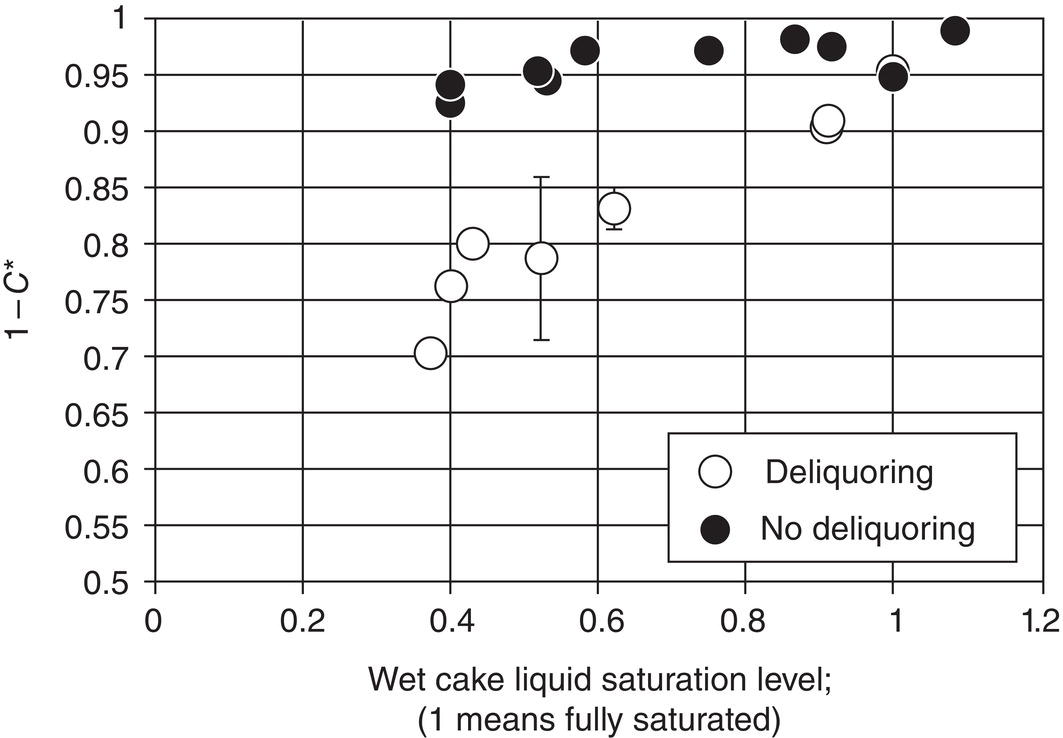
Figure 11.7 Effect of wet cake saturation level on washing efficiency.
Source: Ruslim et al. (2007), with permission Elsevier.
In the second step, the wash is introduced to remove the mother liquor from the wet cake. There are two types of cake wash modes. The first one is displacement wash mode and the second is slurry wash mode. Displacement wash is simply adding wash on top of the wet cake surface and let the wash passing through the wet cake without mixing. Slurry wash is simply stirring the saturated wet cake with the wash to fully suspend and mix the wet cake and wash first, and then filter the liquid through the filter medium. Estime et al. (2011) did a side‐by‐side comparison between the displacement wash and slurry wash. The following washing procedures were employed:
- Slurry wash—The wet cake is transferred to a reactor from the filter and suspended/mixed with 1 wet cake volume of wash thoroughly in a reactor first, followed by transferring the slurry back to the filter funnel and filtering. This is repeated three times.
- Displacement wash—The wet cake remains on the filter funnel. One wet volume wash is introduced to the wet cake and filter directly in the filter funnel. This is repeated three times as well.
Figure 11.8 shows the particle morphology and particle size distribution of the crystals. As shown, the morphology and particle size distribution of these crystals remain intact. Examining the SEM photos, some fine particles in the starting materials disappear and the edge of larger particles seem to be smoothened. These observation suggests that wash is removing impurities, including dissolving some fine particles and compound on the surface solid. However, the bulk shape and size of particles remain similar.
Figure 11.9 plots the results of filtrate normalized impurity level in the filtrate after each wash. Only the data using the actual batch materials are shown. The data using the reconstituted materials are similar and not presented here. Two theoretical filtration concentration profile of slurry wash with wet cake loss on drying (LOD) of 40 and 80% are also shown.
As shown in Figure 11.9, the displacement wash in overall is better than the slurry wash. Its performance, as expected, is not ideal plug displacement as the filtrate impurity level is not less than 0.01 (or 1%). As a matter of fact, from the first displacement cake wash as shown Figure 11.9, the impurity level drops only to ~40% of the initial impurity level. Also, as shown in Figure 11.9, while slurry wash is not as effective as displacement wash, it is still capable of removing the impurity very robustly. For comparison purpose, based upon a theoretical estimation of cake LOD of 40%, three slurry washes will achieve the same degree of rejection of impurity as three displacement wash in the current case. At a higher cake LOD, the washing efficiency will drop.
Examining the data in more detail, the data show the washing efficiency is less effective in the first wash. It may suggest the cake LOD is higher in the first wash, but cake LOD is lower in the second, and third wash. One possibility is dissolution of some fine particles in the first wash, which leads to reduction of residual liquor in the wet cake for the second and third wash.
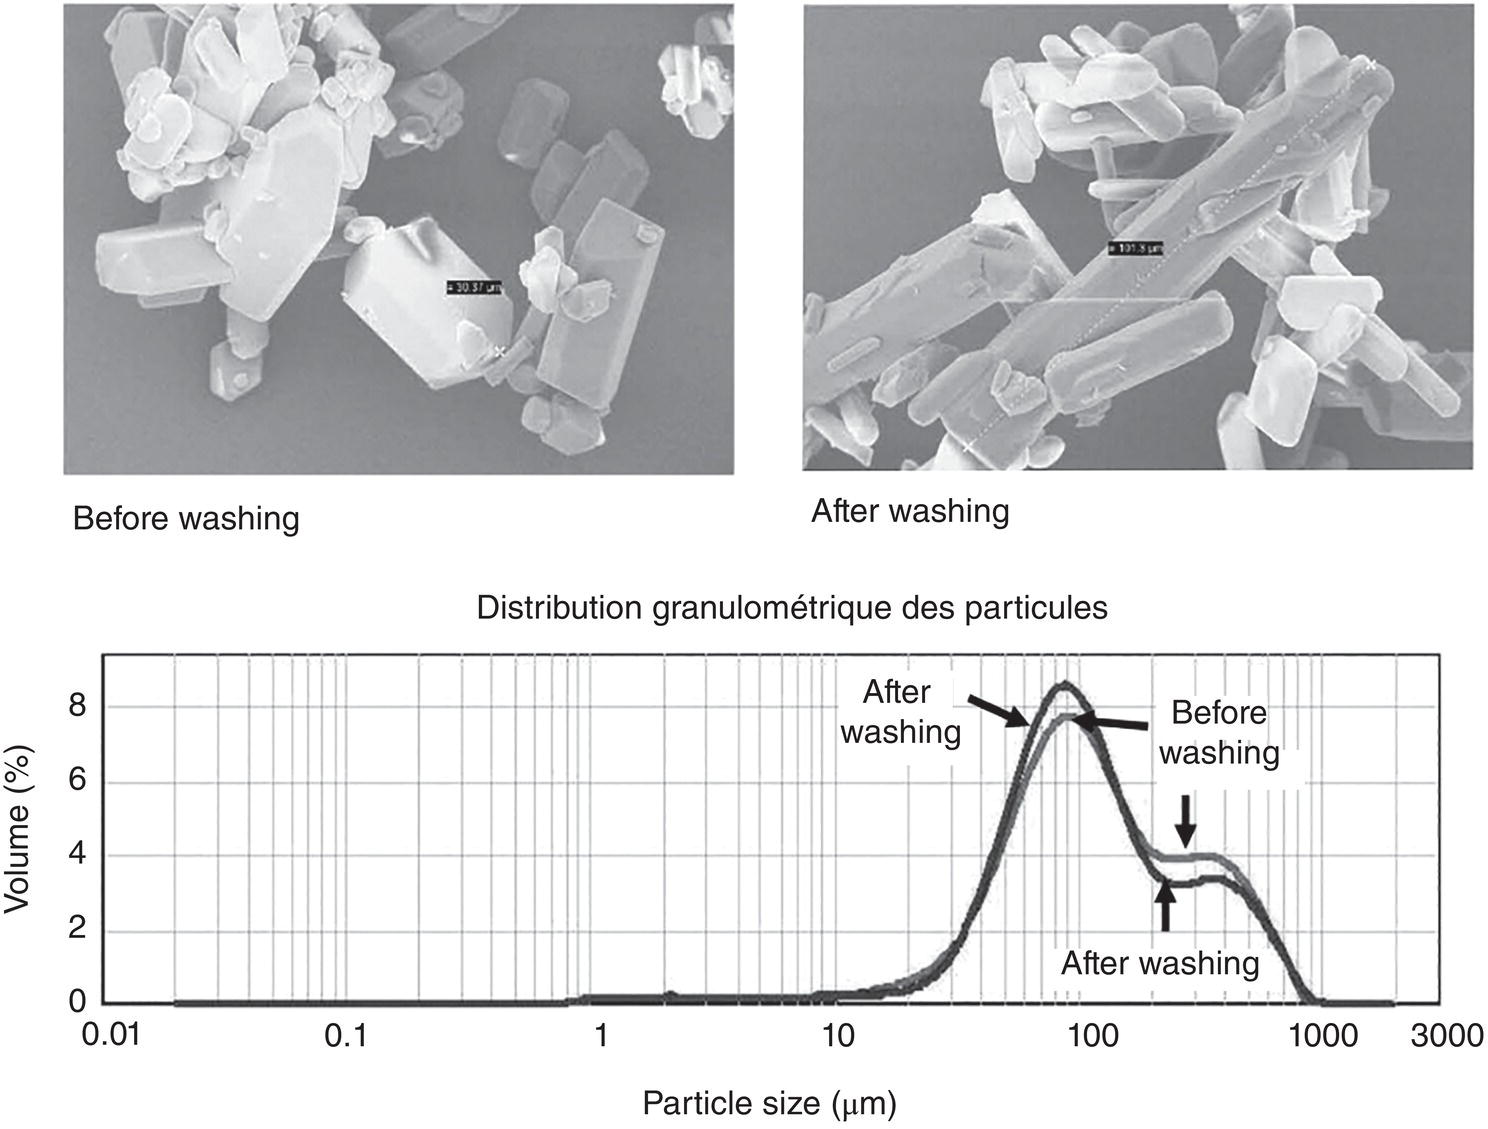
Figure 11.8 Particle image and size distribution before and after the washing.
Source: Estime et al. (2011) with permission Elsevier.
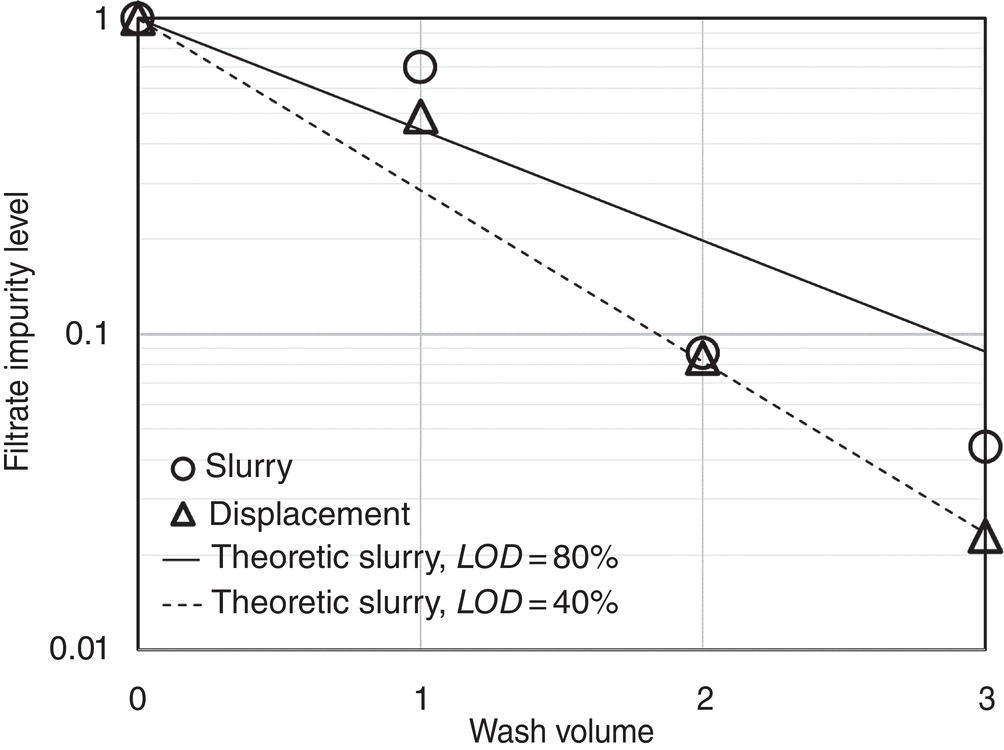
Figure 11.9 Filtrate impurity profile after each wash.
Source: Estime et al. (2011) with permission Elsevier.
As illustrated in earlier Figures 11.5 and 11.6, due to the tortuous nature of wet cake interparticle structure, there will be some degree of dispersion of wash and mother liquor in the cake. Also, due to particle size and operational variation, there can be non‐even cake distribution and compression. Some region in the wet cake can have a higher flow resistance, and some regions will have lower flow resistance. Therefore, the bulk of the wash can flow preferentially through these low resistive paths and bypass regions of wet cake of higher resistance. In consideration of wide variation of these factors, the recommended protocol for cake wash consisting of combination of displacement and slurry washes is listed below:
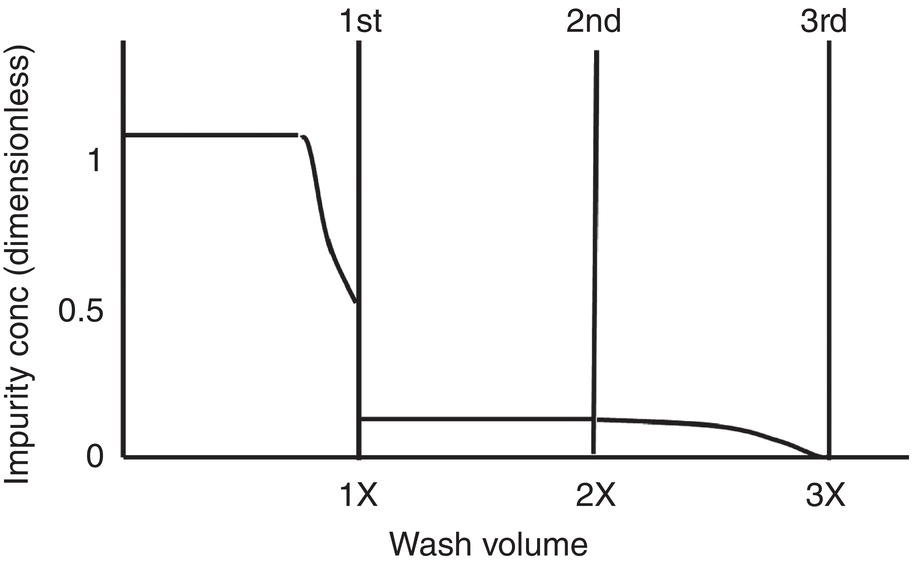
Figure 11.10 Impurity concentration in the filtrate after each wash.
- First displacement wash (1X of wet cake volume)
- Second slurry wash (1X of wet cake volume)
- Third displacement wash (1X of wet cake volume)
The impurity concentration profile after each wash is further highlighted in Figure 11.10. Assuming 20% residual liquor is bypassed in the wet cake in the displacement wash, the impurity level of the filtrate will drop to 20% of the initial impurity level at the end of first displacement wash. Assuming the wet cake LOD is 60% and adding wash of one wet cake volume, the impurity level in the filtrate will drop to 7.5%, i.e. 20% ∗ 60% / (1 + 60%) after the second displacement wash. The impurity level will further drop to 1.5%, i.e. 7.5% ∗ 20%, after the third displacement. This rejection efficiency would be acceptable for almost all cases in practice.
11.3.3 Filtration Model
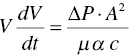
To model the filtration fluidic mechanics for a typical pot filter, Poiseulle’s law is used
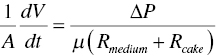
with
For the specific cake resistance α, Kozney equation is shown below
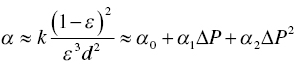
where A is the filter area, d is particle size, k is proportional constant, ∆P is the pressure difference, R is the filter medium or cake resistance, V is the volume of filtrate or slurry, W is the cake mass, α is specific cake resistance, ϵ is wet cake porosity, and μ is viscosity of filtrate or slurry.
Based upon these equations, the filtration rate dV/dt is proportional to the pressure difference ∆P, and inversely proportional to the resistance of filter medium and cake, Rmedium + Rcake Increasing the pressure difference will increase the filtration rate. In the meanwhile, decreasing the cake filtration resistance will also facilitate the filtration rate.
From Eq. (11.3), the specific cake resistance α, decreases with particle size and cake porosity ϵ. In general, larger particles, i.e. size greater than 10 or 20 μm, the cake resistance is low and filtration is smooth. Also, for finer particles with size in the range of few μms or so, the cake resistance will be higher and filtration will slow down. However, if the particle size distribution is uniform, it can minimize the cake resistance and facilitate the filtration. For cases with non‐uniform particle size distribution, the filtration rate can be slow because the finer particles may blind the pores in the wet cake. Besides particle size distribution, cake porosity can also be affected by the operating pressure. As highlighted in equation 11.3, if specific cake resistance α increases with pressure difference, i.e. compressible cake, the filtration rate will decrease.
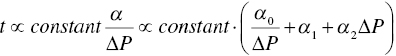
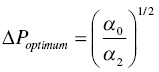
The specific cake resistance α can be determined by integrating Eq. (11.2) into Eq. (11.4a) and plotting the V over time under different pressure difference ∆P. As shown in Figure 11.11, under different ∆P, the slope ![]() will vary. After establishing the correlation between α (per the slope value) and ∆P, it allows the calculation of optimum ∆P for minimizing filtration time cycle. As illustrated in Eq. (11.4b and 11.4c), if cake is incompressible, i.e. α2, is zero, there is no limit for ∆P and its value can be as high as practically achievable. However, if the cake is compressible, i.e. α2, is nonzero, there will be an optimum ∆P to optimize the filtration time. Table 11.2 further illustrates the range of specific cake resistance value for filtration performance. Typically, crystals such as 1‐D needle or 2‐D plate can have higher degree of pressure dependence. The specific cake resistance can be greater than 1 × 10¹⁰ or the filtration can be slow. For crystals with 3‐D shape, it has a lower degree of compressibility and lower‐specific cake resistance (<1 × 10¹⁰, and the filtration will be moderate or fast.
will vary. After establishing the correlation between α (per the slope value) and ∆P, it allows the calculation of optimum ∆P for minimizing filtration time cycle. As illustrated in Eq. (11.4b and 11.4c), if cake is incompressible, i.e. α2, is zero, there is no limit for ∆P and its value can be as high as practically achievable. However, if the cake is compressible, i.e. α2, is nonzero, there will be an optimum ∆P to optimize the filtration time. Table 11.2 further illustrates the range of specific cake resistance value for filtration performance. Typically, crystals such as 1‐D needle or 2‐D plate can have higher degree of pressure dependence. The specific cake resistance can be greater than 1 × 10¹⁰ or the filtration can be slow. For crystals with 3‐D shape, it has a lower degree of compressibility and lower‐specific cake resistance (<1 × 10¹⁰, and the filtration will be moderate or fast.
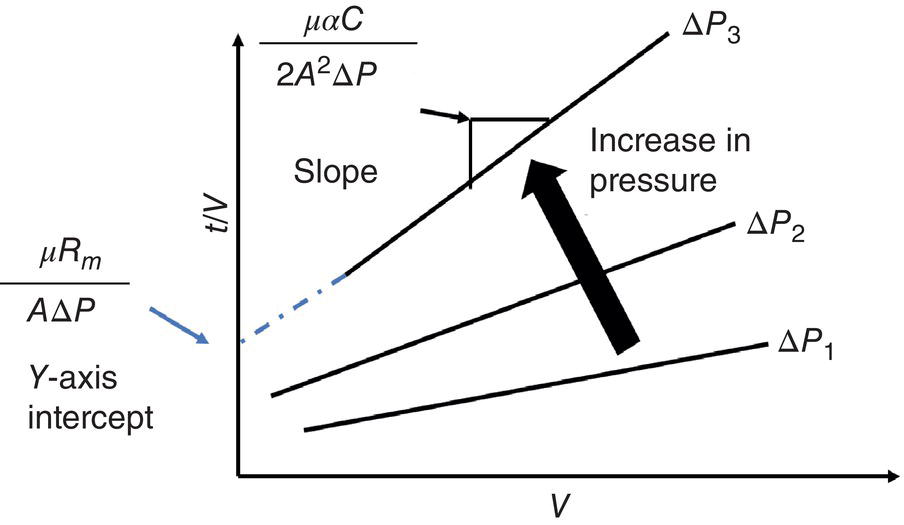
Figure 11.11 Filtration profile of t/V over V, under different ∆P.
Table 11.2 Filtration cake resistance ranking.
| α, specific cake resistance, m/kg | Filtration performance |
|---|---|
| 1 × 10⁹–1 × 10¹⁰ | Fast |
| 1 × 10¹⁰–1 × 10¹¹ | Moderate |
| 1 × 10¹¹–1 × 10¹² | Slow |
| >1 × 10¹² | Very slow |
To model the filtration fluidic mechanics in a centrifugal filter, the terms of ∆P and A in Eq. (11.2) can be replaced by centrifugal force and area in the centrifuge as shown in equations 11.5a and 11.5b below:
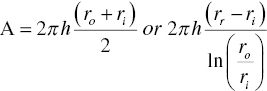
where ro is the outer radius of the wet cake in the centrifuge, ri is the inner liquid or wet cake radius in the centrifuge, and h is the height/thickness of wet cake in the centrifuge.
It should be pointed out that applying Eqs. (11.2), and (11.5a, b) to a centrifugal filter is a simplification to facilitate consistence of model analysis between typical pot filter and centrifuge filter. In the centrifuge filter, the actual driving force is centrifugal force as described in Eq. (11.1). The filtrate experiences the centrifugal force and flows outward toward the outer radius of wet cake. As a matter of fact, a detailed analysis by Zeitsch (1990) illustrates that the wet cake can be under vacuum, and the pressure gradient can actually increase (not decrease) along the radius of wet cake. This scenario would be analogous to a centrifugal pump where liquid is sucked into the inlet of pump under vacuum and discharged at the outlet under pressure. In contrary, for a typical pot filter, the upstream pressure is always higher than the downstream pressure to drive the filtration, so the pressure gradient decreases.
Other simplification for the centrifugal model includes that the filtrate velocity remains constant instead of being accelerated within the centrifuge. Also, the vector direction of filtrate velocity shall not be perpendicular to the circumference of the centrifuge. Instead, the filtrate velocity vector should consist of a large portion parallel to the circumference of the centrifuge and a small portion perpendicular to the circumference of the centrifuge. This should be similar to the case as in the centrifugal pump. More interestingly, it is postulated that particles in the centrifuge cake may be compressed and preferentially laid in parallel to the circumference of the filter, especially for crystals of 1‐D or 2‐D morphology. As a result, the filtrate flow vector, which consists of a small portion of perpendicular direction and a large portion of tangential direction, may experience less cake resistance in passing through these parallel‐orientated crystals. These speculations seem to be consistent with authors’ observations of centrifugal filtration with needle crystals. Nevertheless, more in‐depth investigation and analysis would help to clarify and substantiate these hypotheses.
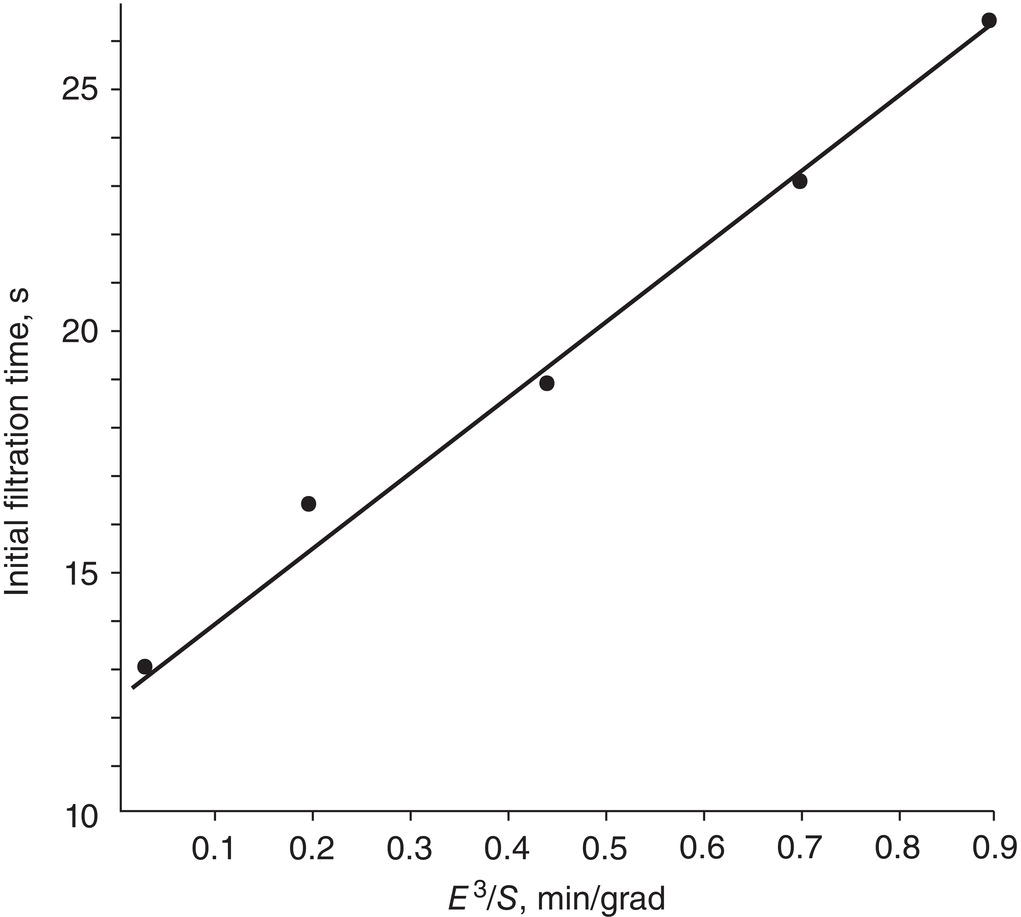
Figure 11.12 Filtration rate vs. slurry settling rate.
Source: Dakkuri Ecanow (1976), with permission Elsevier.
11.3.4 Settling Rate vs Filtration Rate
Other than conducting filtration experiments in the laboratory to collect cake resistance data for modeling and predicting filtration performance, a simple and qualitative way to assess the rate of filtration is to observe the slurry settling behavior in the crystallizer. Dakkuri and Ecanow (1976) demonstrate that the filtration rate or time is inversely proportional to the slurry settling rate as shown in Figure 11.12, where E is the volume occupied by the liquid, and S is solid particle settling velocity, length/time. It shows the faster the settling rate S is, the shorter the filtration time needs or the easier the filtration becomes.
This simple rule of thumb provides a quick assessment of filtration performance in the laboratory. Simply saying, once the agitation of slurry in the crystallizer is stopped, if a clear supernatant layer can be observed on top of the slurry within for example few minutes, it is a good indication that filtration operation will be smooth, and vice versa. In some cases, the bulk of the solid settles, while the top layer maintains some cloudiness and remains unclear. It implies the slurry contains both fine and large particles, and there can create filtration difficulty.
11.4 PROCESS DESIGN AND SCALE‐UP
For process design and scale‐up, the same working principles can be applied from the laboratory scale to the pilot plant and manufacturing factory scale. Ignoring the filter medium resistance and substituting W by c·V, Eq. (11.2) can be rewritten as
Integrating eq. (11.6a), it becomes
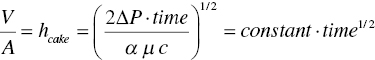
or
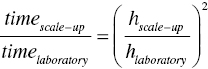
where hcake is the wet cake height (or thickness).
Equation (11.6b) shows that filtration time will be inversely proportional to the pressure differential, and proportional to the square power of cake height. These equations provide a useful assessment on potential scale‐up issue on filtration.
Let us assume the following parameters are maintained upon scale up:
- specific cake resistance α,
- liquid viscosity μ,
- slurry concentration c, and
- ∆P
Also, let us assume in the laboratory, the batch size is 10 g, filter diameter is 5 cm and the cake height is 1 cm, respectively. Upon scale‐up to a 10 kg batch in the pilot plant, the length scale increases by 10‐fold (1/3 power of 10 kg/10 gm). The filter diameter increases from 5 to 50 cm and the cake height also increase from 1 to 10 cm. Based upon above equations, the filtration time can increase 10 × 10 = 100 times. In other words, if it takes 10 minutes in the lab to complete the filtration of 10 gm material, it may take 10 × 100 = 1000 minutes or 16 hours to complete the filtration of the 10 kg material. A period of 10 min in the laboratory is fully acceptable. But a period of 16 hours of filtration time in the pilot plant likely would create operational concerns, not to mention a longer time with a larger batch in the factory.
11.4.1 Agitated Filter Dryer
Agitated filter dryer in general is less productive than centrifuge filter. Also, it is more restrictive in handling compressible cake. However, since it integrates filtration and drying into a single device, it can maintain the same temperature as the crystallization temperature during filtration and avoid transferring wet cake to dryer for drying. Agitated filter‐dryer is a common equipment used in the pharmaceutical industry. The operating protocol for the agitated filters follows closely as illustrated in Figure 11.2 and Figure 11.13a
- Step 1—load the slurry into the filter and filter the slurry through the filter medium. In this step, the agitator blade is raised to above top of the wet cake. The blade can be rotated at few rpms periodically in the pumping down direction. It helps smoothen the surface of the wet cake during filtration for more uniform filtration and cake washing.
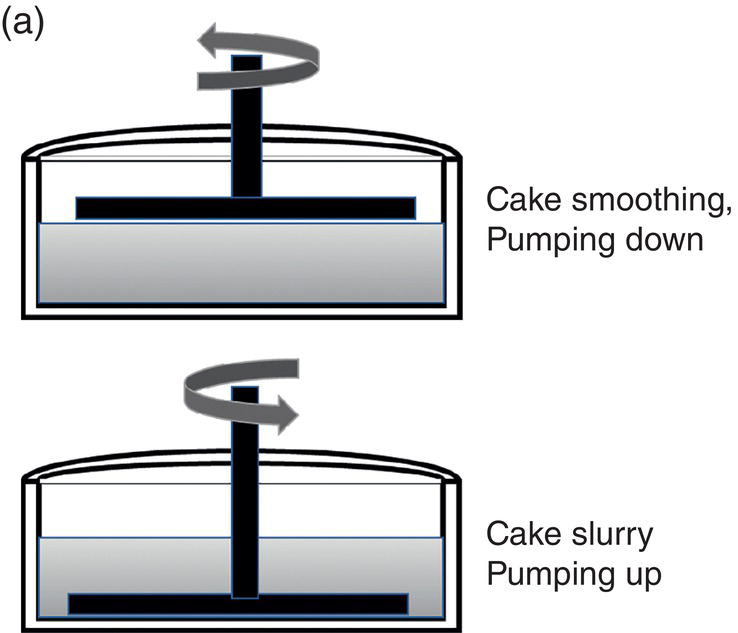
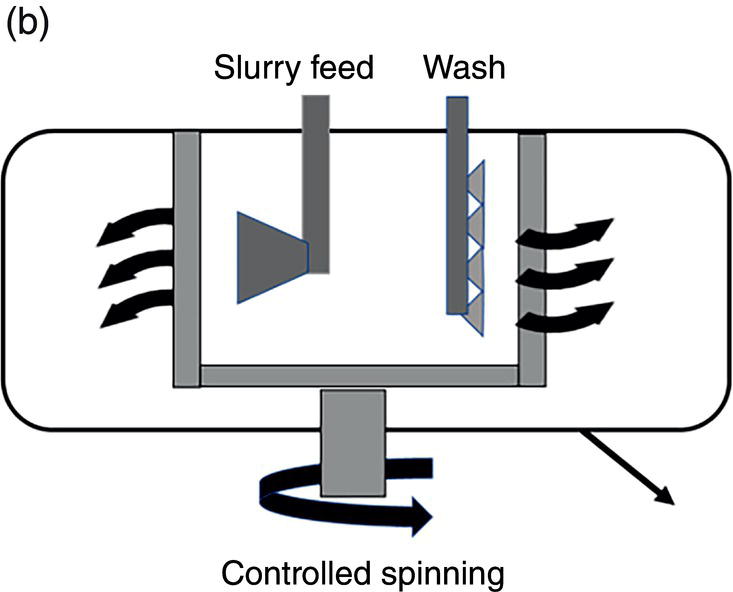
Figure 11.13 (a) Filtration operation—agitated filter. (b) Filtration operation—centrifuge.
- Step 2—wash the wet cake via displacement, slurry and displacement approaches. During the displacement wash, the blade will be raised to above the top of the wet cake. The blade can be rotated at few rpms periodically in the pumping down direction. It helps to smooth the cake surface, fills up cracks and improve the washing efficiency. During the slurry wash, the filtration will stop. Wash will be charged to the filter and the blade should be lowered to the bottom of the wet cake and just above the filter medium. The blade is rotated constantly at higher rpms in the pumping up direction in the slurry wash period. This help to re‐suspend the wet cake from the bottom and mix with the wash thoroughly. After agitating the slurry for a period of time, the agitation will stop and blade will be raised to above the surface of the slurry to reinitiate the wash.
- Step 3—remove excess wash from the wet cake. The pressure across the wet cake and filter medium will be increased to maximum to fully deliquor the wash from the wet cake. Again, the blade is raised to above the top of the wet cake in this step.
11.4.2 Centrifuge Filter
In comparison to agitated filter, centrifuge filter is much more productive. It is also more capable of handling compressible cake, such as particles of 1‐D needle or 2‐D plate crystals. As speculated in earlier Section 11.2.3, the filtrate flow direction within the wet cake may be more in parallel with the particle orientation in the centrifuge cake, thus the specific cake filtration resistance is reduced. This may be the fundamental reason to explain this unique capability. Centrifuge is much less used in the laboratory, but is more frequently used in the pilot plant and factory. Presumably it is due to its high productivity. Centrifuge filter can be jacketed for controlling the temperature, similar to the agitated filter‐dryer.
For the centrifuge filtration, its operation protocol also follows closely as illustrated in Figure 11.2 and Figure 11.13b:
- Step 1—load the slurry and filter the mother liquor. In this step, the centrifuge spinning rate is controlled and can be at a lower operating region at few hundreds of rpms. The slurry feed rate is monitored and adjusted to balance the slurry feed rate and mother liquor filtration rate through the centrifuge filter basket. Over spinning should be avoided to minimize cake compaction and cracking of the wet cake. The spinning of centrifuge during loading the slurry greatly facilitate uniform distribution of wet cake in the centrifuge.
- Step 2—wash the wet cake. In this step, washes are sprayed over the entire height of wet cake in the centrifuge. Again, the centrifuge rotational speed is controlled to avoid over spinning and formation of crack in the wet cake. As the thickness of wet cake increases, the centrifuge rotational speed may increase accordingly to balance wash feed rate and filtration rate. For centrifuge, only the displacement wash is executed, not the slurry wash in this step. However, since cake is spinning, the entire wet cake surface can be evenly exposed to the wash. Therefore, it can facilitate the removal of mother liquor, in the absence of slurry wash.
- Step 3–remove excess liquor wash from the wet cake. In this stage, the centrifuge spinning rate will increase to maximum to fully deliquor the wet cake. After fully deliquoring the wet cake, the wet cake can be discharged from the centrifuge.
11.4.3 Other Operation Complications
In addition to operational protocols during filtration as discussed above, there can be other unexpected complications during the operation, for example slurry break‐through or binding of filter medium.
- Breakthrough of particles through the filter medium. Breakthrough can happen when a portion of the particle in the slurry is smaller than the pore opening in the filter medium. A typical solution is to recycle the mother liquor containing these breath‐through particles back to the filter. When more cake is built up in the filter, the cake itself can become the filter medium to trap these fine particles and stop the breakthrough. Sometime, the breakthrough can be caused by improper filter set‐up which creates open leak spots. In this case, there is likely continuous breakthrough throughout the entire filtration. Unfortunately under this situation, the filter medium needs to be re‐set and a detailed investigation with corrective action is required.
- Filter medium blinding. This can occur over few filtration cycles in a multiple batch campaign. After multiple batches are filtered, the filter medium is blinded by fine particles from previous batches. For this situation, solvent cleaning of filtration medium in between batches appear to be the best solution.