STEP 5
DEI Impact—Evaluate Results
Data is a mirror… of our biases and our realities.
DEI is a never‐ending journey.

Data‐Driven DEI—Step 5: DEI Impact
There has been a pattern throughout this book of combining quantitative and qualitative tenets:
- In Step 1: DEI Inventory, we saw how a good DEI assessment combines quantitative research methods (i.e., surveys) with qualitative research methods (i.e., interviews and focus groups).
- In Step 2: DEI Imperatives, we combined qualitative objectives with quantitative goals.
- In Step 3: DEI Insights and Step 4: DEI Initiatives, we leveraged promising and proven practices, to determine qualitative strategies and quantitative measures.
Here in Step 5: DEI Impact, we continue this pattern by presenting two important pathways to determine and demonstrate DEI impact. First, we dive into DEI data reporting, which leans more heavily on quantitative traditions and science. Most commonly in the form of DEI scorecards and dashboards, DEI data reporting is about gauging progress, determining impact, and engendering accountability for DEI performance. We round out this discussion with a focus on evaluating results and generating findings to comprehensively demonstrate DEI outputs and outcomes. As you will see, this discussion makes clear how re‐administering the same DEI assessment you identified in Step 1: DEI Inventory (or something comparable) can be a key component of evaluating results and generating findings here in final Step 5: DEI Impact. You will recall that the DEI assessment established a baseline or starting data point for your Data‐Driven DEI journey. By conducting re‐assessments, you can compare results and essentially establish new baselines or reference data points for the Data‐Driven DEI cycle to iterate from Step 1 through Step 5 over and over again.
We conclude this step by delving into the power of DEI storytelling, which leans more heavily on qualitative traditions and art. Data storytelling is about humanization, communication, motivation, and inspiration by uplifting voices and sharing narratives of DEI success and lessons learned. It integrates results and findings to craft and communicate compelling DEI stories using narrative, data, and visuals. As you will see, DEI data storytelling enables you to personalize the DEI journey, contextualize data, chronicle progress, synthesize findings, integrate results, and comprehensively demonstrate impact.
DEI Data Reporting
Data reporting is the process of collecting data and formatting it in a way that it is easily understood, interpreted, and analyzed. DEI data reporting enables you to understand, interpret, and analyze DEI data to gauge progress, determine impact, evaluate results, and engender accountability with you and others for DEI performance. More specifically, DEI data reporting offers three value propositions:
- Gauge Progress—In Step 4: DEI Initiatives, we introduced “outputs” as intermediate results that are linked to the completion of strategies. DEI data reporting enables you to gauge progress by tracking and monitoring the DEI measures associated with outputs—the various processes, activities, programs, efforts, and initiatives you have undertaken to achieve your DEI objectives and goals.
- Determine Impact—In Step 2: DEI Imperatives, we introduced “outcomes” as final results that are linked to the achievement of objectives. DEI data reporting enables you to track and monitor the DEI metrics and KPIs that determine your and your organization's impact and effectiveness in accomplishing outcomes—the goals associated with your objectives.
- Engender Accountability—DEI data reporting helps in holding you and others accountable for achieving DEI objectives and goals by clearly capturing and communicating expectations and performance. DEI data reporting provides constant reinforcement and reminders to “do the right things” and constant feedback of whether you and your organization are “doing things right.” In a growing set of circumstances, rewards, compensation, and bonuses are tied to performance against DEI objectives and goals to foster greater accountability.
Two of the primary ways that DEI data can be reported effectively are a DEI scorecard and a DEI dashboard. Next, I will define scorecards and dashboards, provide examples, and help you decide which one is the best for you and/or your organization.
DEI Scorecards
A scorecard is a snapshot of the current and target values for measures, metrics, and KPIs (i.e., goals that quantify objectives and measures that quantify strategies) along with a trend analysis (i.e., increasing, decreasing, or unchanged relative to the target) over a period. Scorecards are static reports generated at a specific point in time and then updated at specific intervals such as weekly or monthly. Scorecards are useful for tracking and monitoring progress toward achieving targets for measures, metrics, and KPIs at a strategic and high level, and are related to a specific topic such as DEI. Strategic decisions can be made by examining the gap between current and target values for measures, metrics, and KPIs, identifying the highest‐priority and/or largest gaps, and focusing efforts and resources accordingly.
You can easily and manually create your own personal DEI scorecard (examples and templates are provided in the next section). There are also personal goal‐tracking, habit‐tracking, task‐tracking, and planning apps, tools, and platforms that can technology‐enable a personal DEI scorecard. Similarly, organizations can manually or automatically create an organizational DEI scorecard (examples and mockups are provided in the section entitled “An Organizational DEI Scorecard”), albeit with varying degrees of effort based on the extent to which data is available, accessible, integrated, and centralized. The format and structure for an organizational DEI scorecard can also be cascaded down to generate divisional, departmental, and other team‐specific DEI scorecards. You and others, including executives, managers, and supervisors, can then be held accountable for your performance, as a scorecard paints a clear and ongoing picture of what is expected and how you are performing against those expectations.
Continuing an example from the previous step, if your personal DEI objective is to “Be an inclusive leader …” and one of your associated goals is to “Improve my 360° assessment scores by 10% …” and one of your associated strategies is to “Read articles about Intrinsic Inclusion™” and one of your associated measures is to “Complete three (3) articles within four (4) months,” then a personal DEI scorecard could allow you to easily track and monitor your progress toward achieving the 10% increase and completing the three articles and the extent to which your performance has increased, decreased, or remained unchanged relative to these targets, say, over the past month.
Continuing another example from the previous step, if your organizational DEI objective is to “Renew a diverse, representative, and high‐performing workforce …” and one of your associated goals is to “Increase representation of supervisors and executives of color by 5% within three years …” and one of your associated strategies is to “Design and deliver a leadership development program for Black, Hispanic, and Native American employees …” and one of your associated measures is to “Achieve 100% completion of participants in a leadership development program …” then a scorecard can allow you to easily track and monitor your progress toward achieving the 5% increase and the 100% completion rate and the extent to which your performance has increased, decreased, or remained unchanged relative to these targets, say, over the past quarter.
Scorecards can be presented in a variety of ways as tables, charts, and graphics using office software (i.e., documents, slides, spreadsheets), within an intranet or portal, or as a part of a dashboard.
A Personal DEI Scorecard
An example of a personal DEI scorecard is shown in Table 5.1 using the same elements as the personal DEI strategic plan in the previous step. In addition to capturing objectives, goals, strategies, and measures, it also tracks the baseline from Step 1: Inventory (assessment), the target from Step 2: Imperatives, and the actual results you have achieved after you leveraged Step 3: Insights to inform and implement the strategies from Step 4: Initiatives. The score is a measure of your performance ranging from 0 (poor performance) to 100 (excellent performance) in achieving your target. It is simply calculated as follows:
The total score represents the average across all scores.
TABLE 5.1 A Personal DEI Scorecard
| OBJECTIVES AND GOALS | |||||
| Objective: | Inclusion: Be an inclusive leader who personalizes individuals, treats people and groups fairly, and leverages the thinking of diverse groups. | ||||
| No. | Goal | Baseline | Target | Actual | Score |
| 1. | Improve my diverse 360° assessment scores by 10% with women in science, technology, engineering, and math (STEM) over the next 12 months (to mitigate the impact of my Gender‐Science IAT results being a “slight preference” of associating women with science and men with liberal arts). | 4.17 | 4.54 | 4.43 | 98 |
| 2. | Improve my 360° assessment scores by 10% with people of color over the next 12 months (to mitigate the impact of my Race IAT results being a “slight automatic preference” for white people over Black people). | 4.05 | 4.45 | 4.32 | 97 |
| 3. | Increase my I3™ rating from the second level to the third level by the end of the year. | Level 2 | Level 3 | Level 3 | 100 |
| TOTAL | 98 | ||||
| STRATEGIES AND MEASURES | |||||
| No. | Strategy | Measure | Target | Actual | Score |
| Crawl (Time: 4 months) | |||||
| (1) | Books, Magazines, Articles, and Blogs: Read the book, Intrinsic Inclusion: Rebooting Your Biased Brain. | Complete one (1) book within four (4) months. | 1 | 1 | 100 |
| (2) | TV Shows, Videos, and Podcasts: Visit the Intrinsic Inclusion™ website to learn more about the four inclusion accelerators. | Complete one (1) full review of the website within four (4) months. | 1 | 1 | 100 |
| (3) | Travel, Site Visits, and Excursions: Shadow an inclusive leader for a day to observe their behavior and/or interview an inclusive leader to gain insight. | Shadow and/or interview one (1) inclusive leader within four (4) months. | 1 | 1 | 100 |
| (4) | Journaling: Maintain a journal. | Complete one (1) journal entry each week for four (4) months or sixteen (16) weeks. | 16 | 14 | 88 |
| (5) | Personal Interactions: Share the objectives, goals, strategies, and measures for the overall learning journey with friends or family members to provide motivation and accountability. | Share four (4) key takeaways and lessons learned with friends or family members within four (4) months. | 4 | 3 | 75 |
| SCORE | 87 | ||||
| Walk (Time: 4 months) | |||||
| (6) | Books, Magazines, Articles, and Blogs: Read articles on Intrinsic Inclusion™ by Janet B. Reid, PhD, and Vincent Brown in Psychology Today. | Complete three (3) articles within four (4) months. | 3 | 4 | 133 |
| (7) | TV Shows, Videos, and Podcasts: Watch lecture or seminar by the authors, Janet B. Reid, PhD, and Vincent Brown, on YouTube. | Complete one (1) video within four (4) months. | 1 | 1 | 100 |
| (8) | Workplace Activity: Participate in a workplace event or celebration sponsored by the organization's Black employee resource group (ERG). | Participate in one (1) event or celebration within four (4) months. | 4 | 3 | 75 |
| (9) | Journaling: Maintain a journal. | Complete one (1) journal entry each week for four (4) months or sixteen (16) weeks. | 16 | 12 | 75 |
| (10) | Storytelling: Share the key takeaways and lessons learned from these experiences with a colleague. | Share four (4) key takeaways and lessons learned with a colleague within four (4) months | 4 | 4 | 100 |
| SCORE | 86 | ||||
| Run (Time: 4 months) | |||||
| (11) | Books, Magazines, Articles, and Blogs: Read the book, The Phoenix Principles: Leveraging Inclusion to Transform Your Company and complete The Phoenix Principles Work Book. | Complete one (1) book within four (4) months. | 1 | 1 | 100 |
| (12) | Training Programs: Attend a facilitated learning experience (FLE) by an Intrinsic Inclusion™ certified instructor to learn the methodology and participate in expertly facilitated tasks, exercises, and activities for applying the inclusion accelerators. | Complete one (1) training program within four (4) months. | 1 | 1 | 100 |
| (13) | Experiential Learning and Development Programs and Workplace Activities: Apply the MODE model after the FLE at work while seeking feedback from Black and women colleagues (“Field Testing” chapter, “Building MODE into the Routine” section). | Complete four (4) exercises applying the MODE model at work within four (4) months. | 4 | 5 | 125 |
| (14) | Journaling: Maintain a journal. | Complete one (1) journal entry each week for four (4) months or sixteen (16) weeks. | 16 | 17 | 106 |
| (15) | Communities of Learning: Join a diverse peer learning group from the FLE that meets regularly to share stories, offer encouragement, and hold each other accountable to meet learning and development objectives. | Complete one (1) peer learning group meeting each month for four (4) months. | 1 | 1 | 100 |
| SCORE | 109 | ||||
| Total Score | 93 | ||||
An Organizational DEI Scorecard
An example of an organizational DEI scorecard can be found in Table 5.2 using the same elements as a portion of the organizational DEI strategic plan in the previous step. In identical fashion to the personal DEI scorecard, it captures objectives, goals, strategies, and measures; baseline, target, and actual figures; a score and a total score.
TABLE 5.2 An Organizational DEI Scorecard
| OBJECTIVES AND GOALS | |||||
| Objective #2: | Category 4: Recruitment and Category 5: Advancement and Retention: Renew a diverse, representative, and high‐performing workforce that draws from all segments of society by achieving diverse representation at every level throughout the organization. | ||||
| No. | Goal | Baseline | Target | Actual | Score |
| 2.1 | Increase representation of people of color by 50%. | 6.0% | 9.0% | 10.0% | 111 |
| 2.2 | Increase representation of supervisors and executives of color by 25% within three years. | 3.0% | 3.75% | 3.5% | 93 |
| 2.3 | Increase representation of women supervisors and executives by 10% within three years. | 30.0% | 33.0% | 32.5% | 98 |
| 2.4 | Increase representation of persons with disabilities employees by 40% within two years. | 2.0% | 2.8% | 2.5% | 89 |
| Total Score | 98 | ||||
| STRATEGIES AND MEASURES | |||||
| No. | Strategy | Measure | Target | Actual | Score |
| (1) | Conduct a Regretted Loss Assessment to understand underlying reasons for talent attrition. | Complete Regretted Loss Assessment within six (6) months. | 1 | 1 | 100 |
| (2) | Implement inclusive recruiting program that expands the range of partner colleges and universities representing people with disabilities and Indigenous people. | Complete design and begin execution of inclusive recruiting program within nine (9) months. | 1 | 1 | 100 |
| (3) | Revise hiring policies and procedures to include inclusive language for position descriptions, diverse interview panels, and diverse interview slates. | Complete revision of hiring policies and procedures within twelve (12) months. | 1 | 1 | 100 |
| (4) | Design and deliver a mentorship, sponsorship, and allyship training program for managers and leaders using the Ally Conversation Toolkit (ACT). | Complete mentorship, sponsorship, and ACT allyship training program for managers and leaders within six (6) months.
| 1 100 4.5 4.5 | 1 95 4.6 4.8 | 100 95 102 107 |
| (5) | Design and deliver a leadership development program for mid‐level women managers employees. Design and deliver a leadership development program for Black, Hispanic, and Native American employees. | Complete leadership development programs within six (6) months.
| 1 100 4.5 4.5 80 | 1 98 4.4 4.5 90 | 75 98 98 100 113 |
| Total Score | 99 | ||||
DEI Dashboards
A dashboard is a dynamic platform that provides access to current, target, and historical values for measures, metrics, and KPIs (i.e., goals that quantify objectives and measures that quantify strategies) with the ability to interactively apply different filters and run various analyses. Dashboards can include all the features of scorecards along with an even wider array of features, functionalities, and options. Dashboards are real‐time reports that are updated continuously based on direct connections to source data. Dashboards therefore offer the ability to interactively drill down deeper to underlying, related, and historical data, filter the data according to certain variables and criteria, and perform a range of analysis by generating standard and customized reports and visualizations. Dashboards are not only useful for tracking and monitoring progress toward achieving targets for measures, metrics, and KPIs at a strategic and high level, but also for going much deeper to an operational and low level to understand more precisely what is feeding various numbers and driving various trends. Moreover, because dashboards can be related to multiple topics such as DEI, human resources, operations, finance, accounting, and more, by aggregating and integrating data from other systems, dashboards are excellent tools for exploring the interrelationships between and across several categories and data sets.
A personal goal‐tracking, habit‐tracking, task‐tracking, or planning app, tool, or platform would be required to create a personal DEI dashboard. Continuing the personal example above, a personal DEI dashboard would not only allow you to track your goals, such as a 10% increase in your 360° assessment scores, and monitor progress against your measures, such as completing three articles, but also allow you to set deadlines with automatic reminders for your goals, update your status, view weekly and monthly trends, chart progress, and more, to help make certain you are accomplishing your goals in a timely manner.
Continuing the organizational example above, an organizational DEI dashboard would not only allow you to track your goals, such as a 5% increase in representation of supervisors and executives of color within three years, and monitor your progress against your measures, such as a 100% completion rate for participants in a leadership development program, but also allow each person, team, department, and division to go deeper, see the level of detail they desire, and customize their experience to make the most valuable and useful information readily available.
Creating an organizational DEI dashboard requires a business intelligence software tool, application, or platform. These tools enable the creation of tables, charts, graphics, infographics, and visualizations through a mobile app, desktop application, intranet, portal, or browser. They also support various customizations and personalizations including the ability to integrate with third‐party applications and databases, generate standardized or tailored scorecards and dashboards for specific divisions, departments, and teams, and control who has permission to access certain data based on roles.
A Personal DEI Dashboard
An example of a personal DEI dashboard is shown in Figures 5.1 through Figures 5.8. There are several mobile apps that allow you to track activities that could be used to develop a personal DEI dashboard including nTask, Strides, Coach.me, Way of Life, ATracker, Habitica, Toodledo, Timelines, and Goals on Track.1 The examples provided herein were developed using Strides based on the personal DEI strategic plan previously shown in Table 4.7. As you can see from the figures, the app allows you to enter your DEI strategies and measures as daily goals (Figure 5.1), maintain daily journal entries of progress toward goals (Figure 5.2) with associated notes (Figure 5.3), track and visualize your progress for tasks (Figure 5.4), break tasks into subtasks (Figure 5.5) with associated notes (Figure 5.6), track and visualize your progress for subtasks (Figure 5.7), and receive positive encouragement (Figure 5.8).
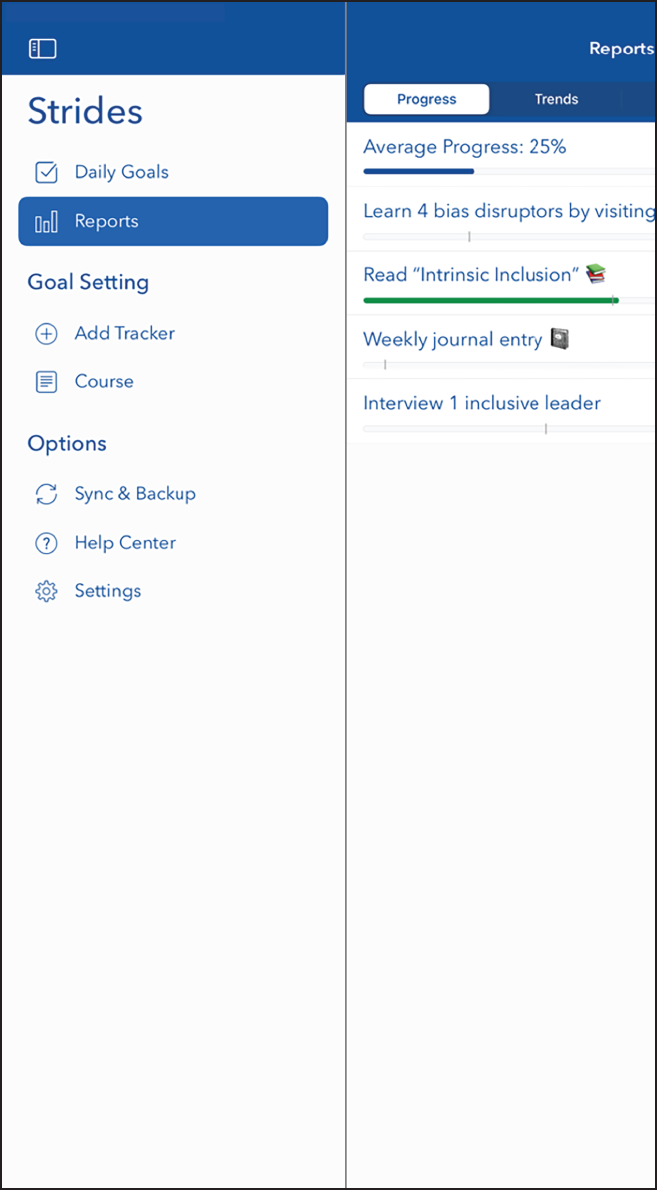
FIGURE 5.1 Personal DEI Dashboard (Part 1 of 8)
An Organizational DEI Dashboard
Examples of an organizational DEI dashboard can be found in Figures 5.9 through 5.11. These dashboards are meant to be illustrative, not exhaustive, and depict DEI minimum viable metrics (MVMs) and KPIs—a core set of essential DEI metrics that every organization should consider tracking (with organizational and/or industry comparators, if available):

FIGURE 5.2 Personal DEI Dashboard (Part 2 of 8)
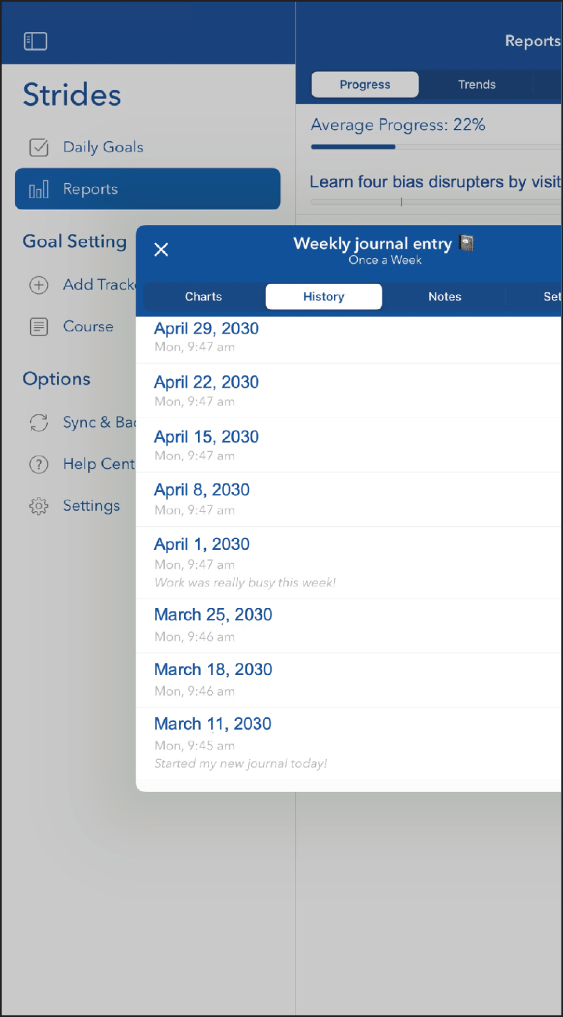
FIGURE 5.3 Personal DEI Dashboard (Part 3 of 8)

FIGURE 5.4 Personal DEI Dashboard (Part 4 of 8)
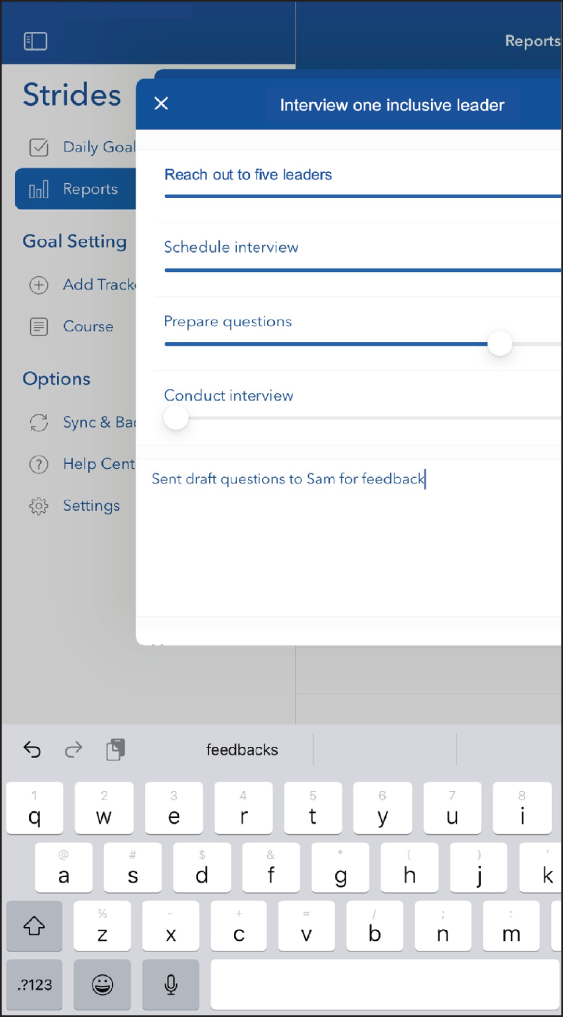
FIGURE 5.5 Personal DEI Dashboard (Part 5 of 8)
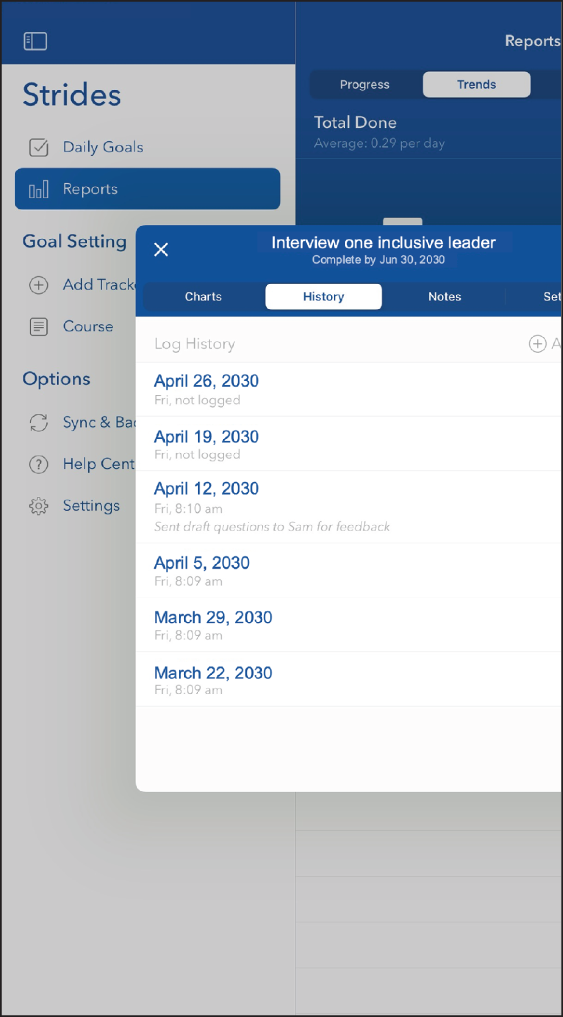
FIGURE 5.6 Personal DEI Dashboard (Part 6 of 8)
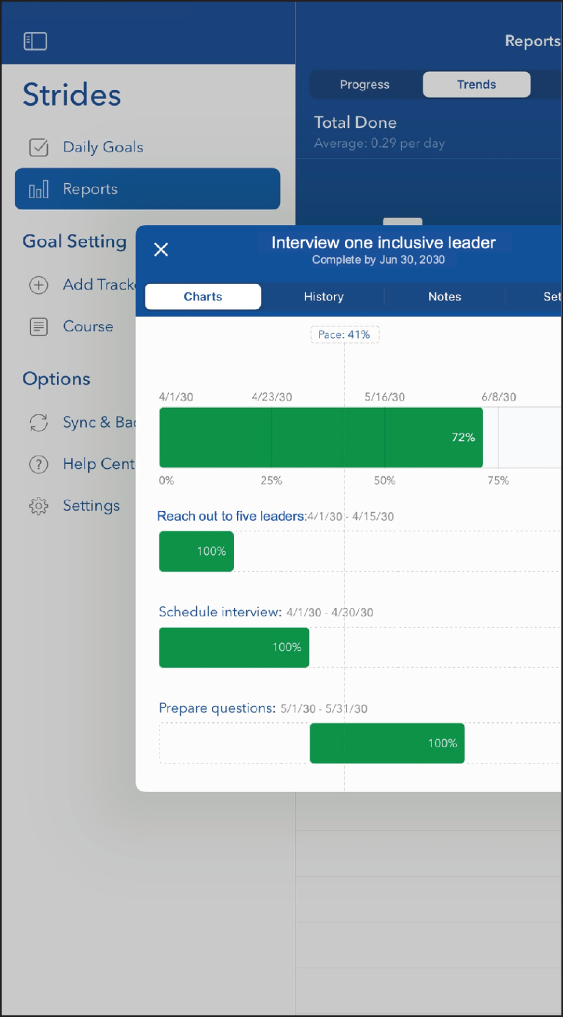
FIGURE 5.7 Personal DEI Dashboard (Part 7 of 8)

FIGURE 5.8 Personal DEI Dashboard (Part 8 of 8)
- DEI Strategic Plan Scorecard—A scorecard representing the current status of the DEI strategic plan's objectives, goals, strategies, and measures with the ability to drill down. By tracking this data, you can effectively gauge progress, determine impact, engender accountability, evaluate results, and generate findings to comprehensively demonstrate DEI outputs and outcomes. The scorecard is depicted on the left‐hand side of Figure 5.9, while the drill‐down for Objective #2 is depicted on the right‐hand side of Figure 5.9.
- Workforce: Diversity (Representation)—Disaggregated representation data by demographics and management status. By tracking diversity data, you can effectively monitor how representative your workforce is overall and benchmark it against the general population, your industry, departments and divisions, and the geographies where you have offices, do business, and/or deliver products/programs/services. This representation is depicted in the upper left‐hand corner of Figure 5.10 while the benchmarking is depicted in the lower left‐hand corner of Figure 5.10.
- Workplace: Inclusion Index—A composite index or measure of inclusion and/or belonging or some related measure disaggregated by demographics. By tracking an inclusion and/or belonging index, you can effectively monitor how people are experiencing your organizational culture and climate as a leading indicator. This is depicted in the lower right‐hand corner of Figure 5.10.
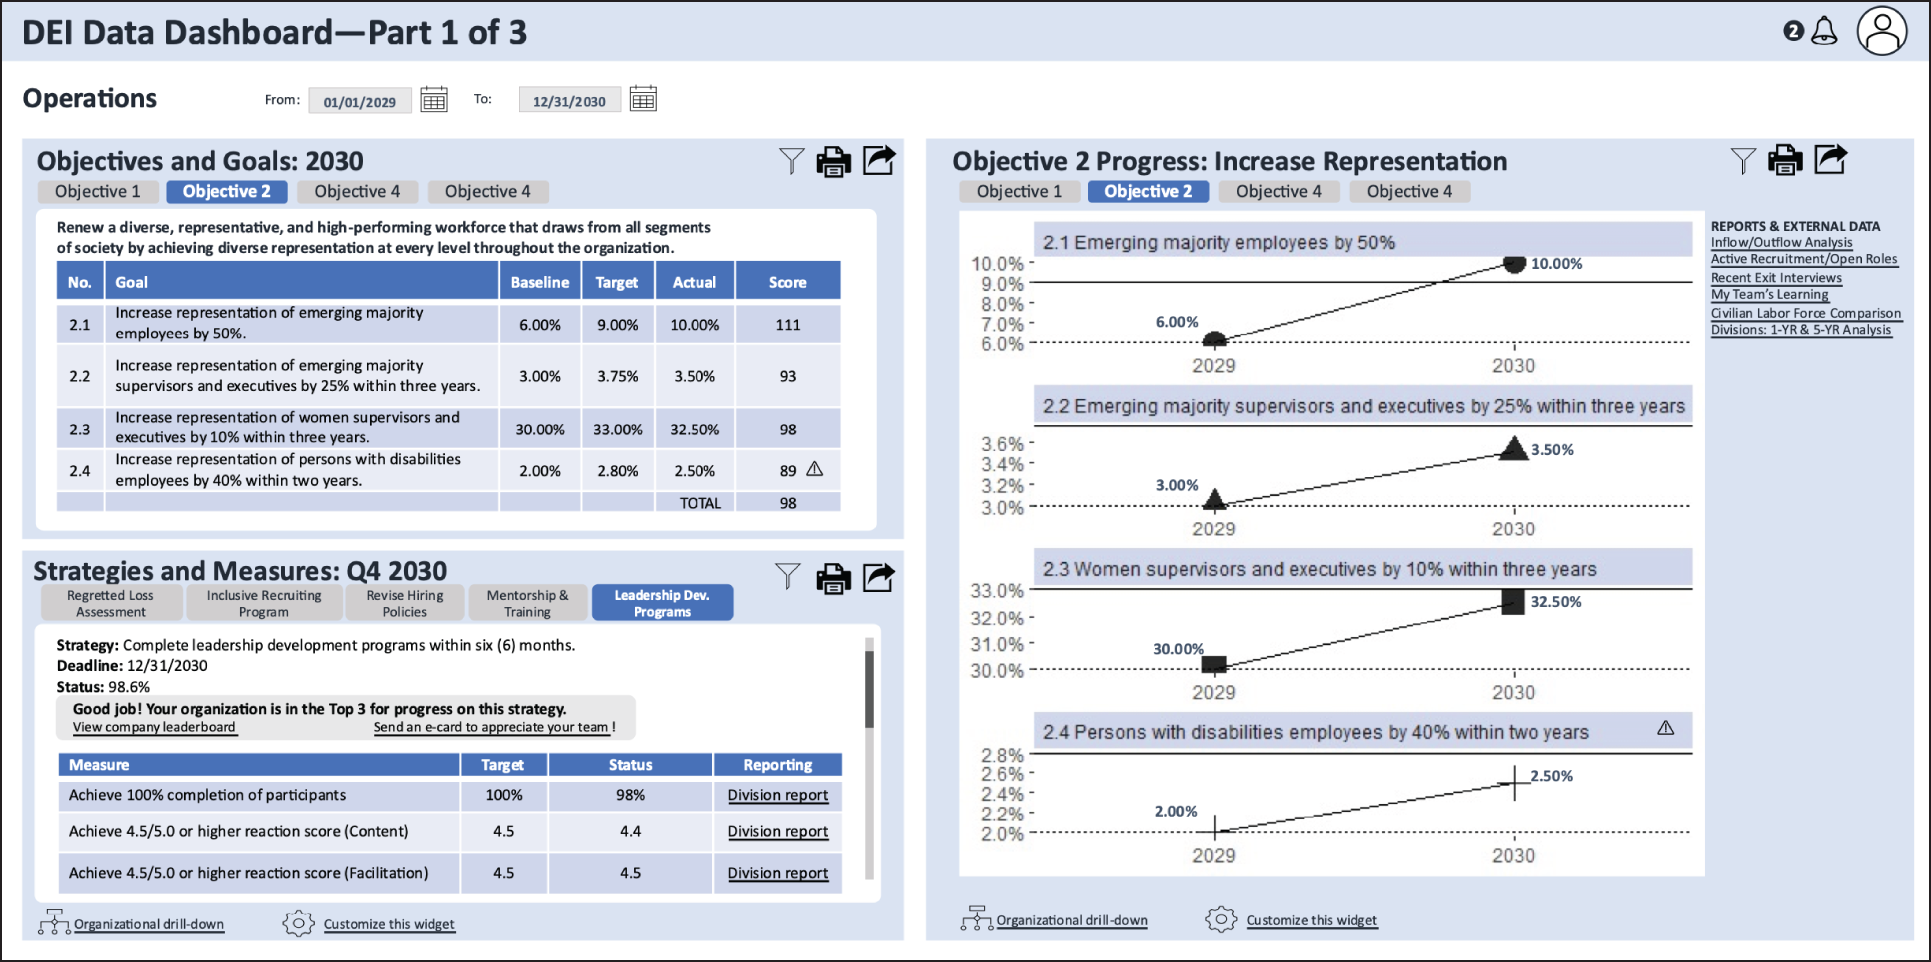
FIGURE 5.9 Organizational DEI Dashboard (Part 1 of 3)

FIGURE 5.10 Organizational DEI Dashboard (Part 2 of 3)
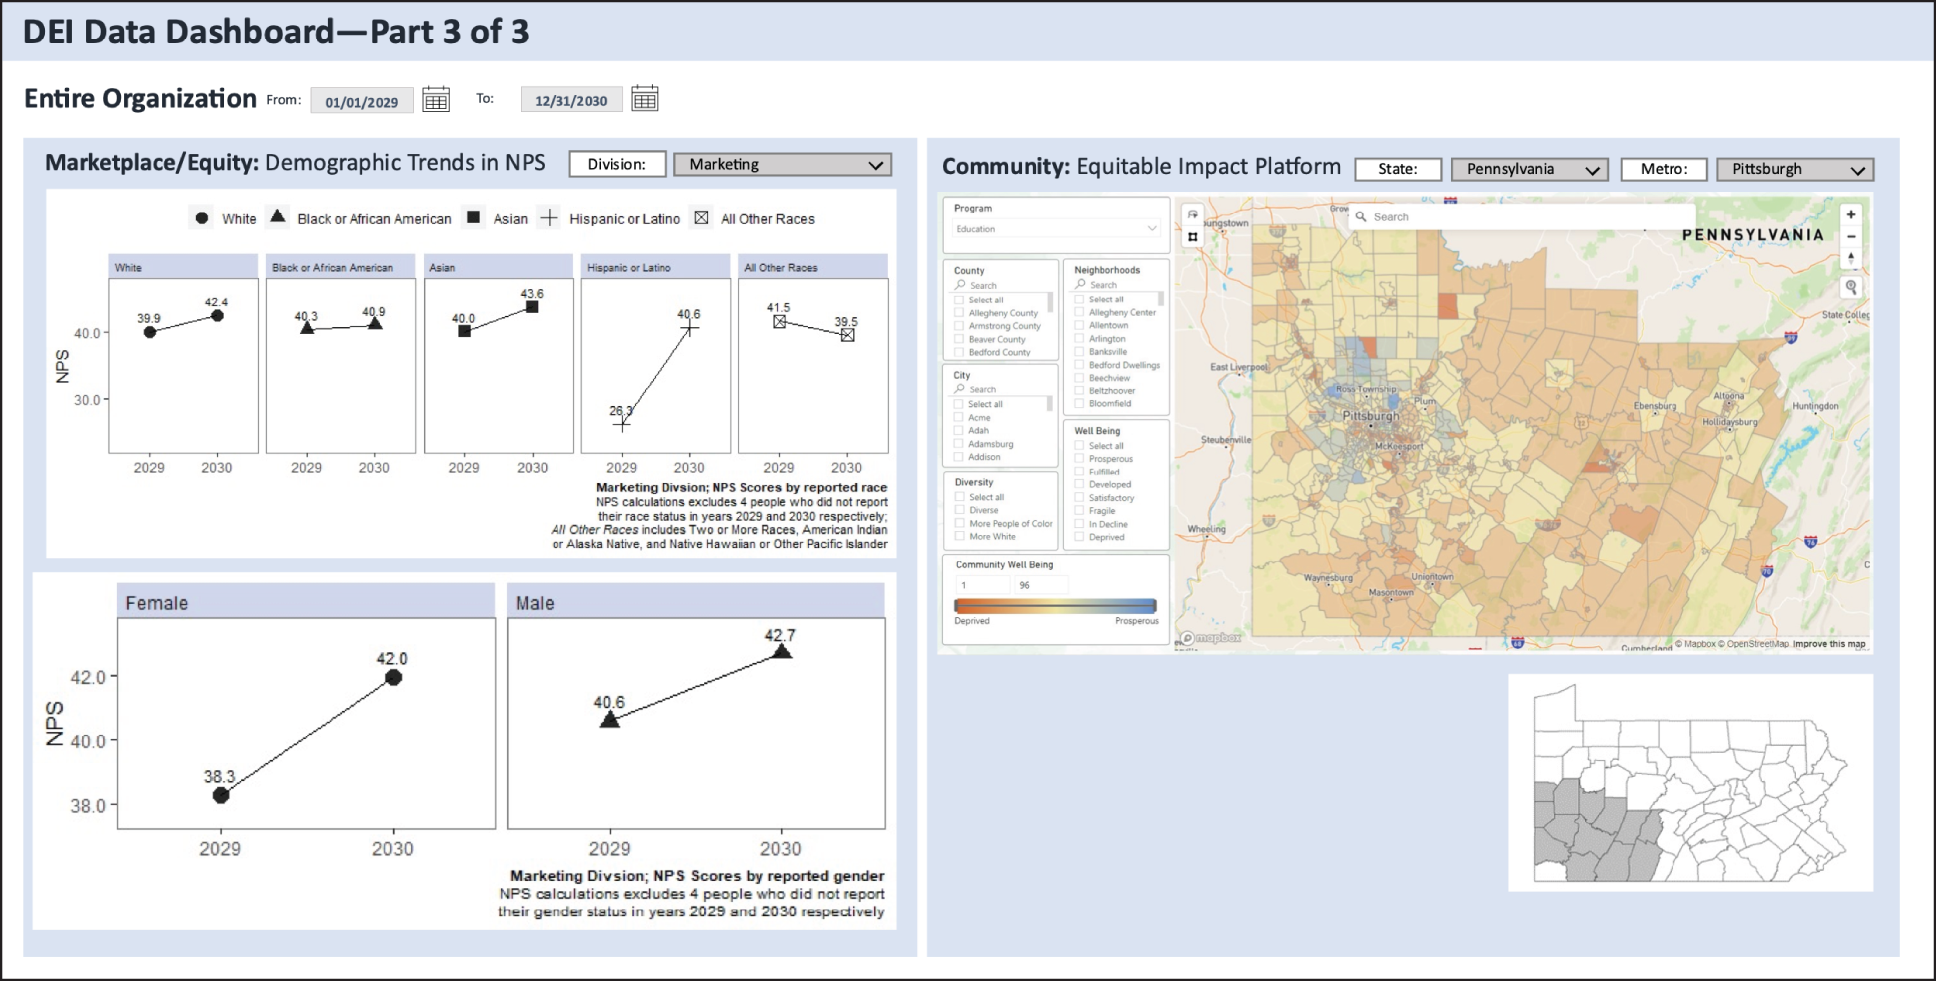
FIGURE 5.11 Organizational DEI Dashboard (Part 3 of 3)
- Workplace: Equity (Internal)—Rates of change across hiring, promotions, retention/separations (including voluntary and involuntary losses), and complaints disaggregated by demographics. By tracking these rates of change you can effectively monitor equity or inequity across the entire human resources (HR) lifecycle as a leading indicator. This is depicted in the upper right‐hand corner of Figure 5.10.
- Marketplace: Equity (External)—A composite index or measure of customer or stakeholder satisfaction and/or outcomes disaggregated by demographics. One popular and simple measure is the Net Promoter Score (NPS), which asks respondents to rate their answer to the question, “On a scale of 0 to 10, how likely are you to recommend our organization/product/service to a friend or colleague?” By tracking NPS, or something comparable, you can effectively monitor how equitably you are meeting the needs of your customers or stakeholders as a leading indicator. This is depicted on the left‐hand side of Figure 5.11.
- Community—A measure of community diversity, inclusiveness, well‐being, and equity for office locations and other geographies of particular interest including partner communities for social and economic investment including recruiting, hiring, philanthropy, corporate social responsibility (CSR), environmental sustainability, supplier diversity, and the like. By tracking these indicators, you can pinpoint areas that can most benefit from social and economic investment. This is depicted on the right‐hand side of Figure 5.11, which also represents an image from BCT's Equitable Impact Platform™ (EquIP™), which was previously cited as a “What Works” model for organizations and is highlighted again in the conclusion.
Creating a DEI Scorecard or Dashboard
While this topic is useful for people, it is of paramount importance for organizations as they are responsible for a diverse set of stakeholders and managing a broader array of data. A core and basic principle for creating a DEI scorecard or dashboard for organizations is data disaggregation (mentioned previously in Step 1: DEI Inventory for Organizations) or stratifying data by salient subgroups according to the following layers of “The Four Layers of Diversity” (previously shown in Figure 1.20):
- Internal Dimensions: The internal dimensions or “primary layer” of diversity includes age, gender, sexual orientation, physical ability, ethnicity, and race.
- External Dimensions: The external dimensions or “secondary layer” of diversity includes geographic location, income, personal habits, recreational habits, religion, educational background, work experience, appearance, parental status, and marital status.
- Organizational Dimensions: The organizational dimensions or “organizational layer” of diversity include functional level, work‐content field, division/department/unit/group, seniority, work location, union affiliation, and management status.
It is imperative that this information be captured in the data system(s) producing your organizational DEI scorecard or dashboard. Whether it is a human resources information system (HRIS), learning management system (LMS), enterprise resource planning (ERP) system, customer relationship management (CRM) system, or other DEI‐related data system, your ability to produce disaggregated reports will be defined (or delimited) by the data that is captured (or not) in the system. Similarly, by expanding the range of subgroups you captured (or not) in your organizational DEI assessment survey, you set the stage (or close it) to generate disaggregated organizational DEI assessment reports according to these groups. Stated simply, disaggregated data in leads to disaggregated data out.
Visualizing Data
The following are tips—adapted from the National Equity Atlas, produced by PolicyLink and the University of Southern California (USC) Equity Research Institute (ERI)—for visualizing data and creating effective scorecards and dashboards with deeply disaggregated data to power your DEI reporting.2
Steps to creating a scorecard or dashboard:
- Decide what story you are trying to tell with the data and what next steps you hope the audience will take to advance the DEI journey.
- Choose your mix of quantitative and qualitative data visualizations based on the key DEI issues of your DEI journey.
- Create great data displays using best practices.
- Review your data visualizations and narrative to make sure they tell a cohesive story.
Decide What Story You Are Trying to Tell with the Data
DEI scorecards and dashboards should tell a clear story about you and/or your organization, highlighting what the issues are, why they matter, and how others can take action to make meaningful progress on DEI. We will discuss DEI storytelling in great length later in this step but, in the context of scorecards and dashboards, when displaying data, you should be able to answer:
- What does the data show?
- Why does it matter?
- What are the solutions?
These three basic guiding questions can also help you in designing your scorecard or dashboard. Each element of your data visual should support your articulation of those three questions, and focusing on the goal of your data visual can also help you eliminate unneeded components that may be taking up valuable space or distracting your audience.
Choose Your Mix of Quantitative and Qualitative Data Visualizations
There are a wide variety of data visual types you can choose from. Below are some of the quantitative and qualitative data visual types for displaying disaggregated data for DEI scorecards and dashboards, based on the comparisons you want to highlight in the data.
Visualizing Quantitative Data
Among options for visualizing quantitative data are bar charts, column charts, grouped bar charts, trend lines, dot plot graphics, and maps. Table 5.3 provides guidance on how to choose a chart type and examples are provided thereafter.
Comparing between a Few Groups
For example: Compare differences by race and ethnicity
Consider using: Bar Chart
As shown in Figure 5.12, bar charts are useful for showing categorical data, such as data by race or by gender, where you are showing comparison between groups. A horizontal bar chart makes it easy for viewers to compare between bars to recognize which bars are longer and which are shorter. Vertical gridlines provide a quick reference to estimating length and comparing differences, and labels provide exact percentages or numbers, which are particularly useful when comparing between groups with smaller differences.
Comparing between Many Groups
For example: Compare units, departments, divisions, or locations
Consider using: Column Chart
As shown in Figure 5.13, column charts are vertical bar charts, and are also useful for comparison between groups, particularly when there are more than seven categories. They are also useful for illustrating ranking across many groups, such as helping users to identify how their city or state compares with other cities and states.
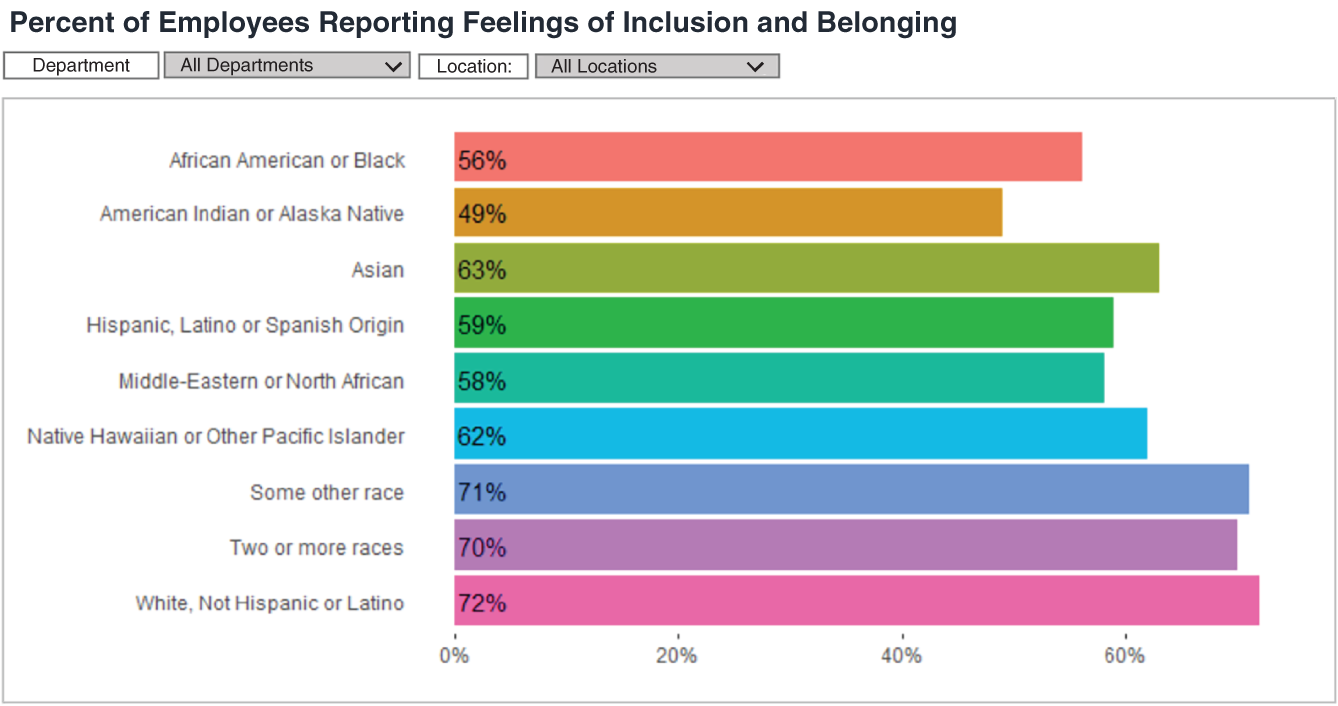
FIGURE 5.12 Bar Chart
TABLE 5.3 How to Choose a Chart Type
| If you'd like to: | For example: | Consider using: |
| Compare between a few groups | Compare differences by race and ethnicity | Bar chart |
| Compare between many groups | Compare units, departments, divisions, or locations | Column chart |
| Compare between groups and subgroups | Compare differences between groups by race and gender | Grouped bar chart |
| Show gaps and change over time | Show different rates over time by management status | Trend line |
| Show clusters and gaps between groups over time | Show distribution between equity scores for different years | Dot plot graph |
| Display and compare geographically related | Compare differences between and across office locations | Map |

FIGURE 5.13 Column Chart
Note that the labels for the categories can be displayed at an angle to maximize space.
Comparing between Groups and Subgroups
For example: Compare differences between groups by race and gender
Consider using: Grouped Bar Chart
As shown in Figure 5.14, grouped bar charts allow you to include additional subcategories in your comparison, for example, when you are showing differences between groups by race and gender. Grouping the bars together shows rates by race/ethnicity, while using two different colors for gender allows viewers to also compare each gender across racial groups.
Show Gaps and Change Over Time
For example: Show different rates over time by management status
Consider using: Trend Lines
As shown in Figure 5.15, trend lines are a useful way to illustrate change over time. Using markers can help users identify key points on your chart, and using different colors for each line makes it visually clear for comparison between different groups represented.

FIGURE 5.14 Grouped Bar Chart
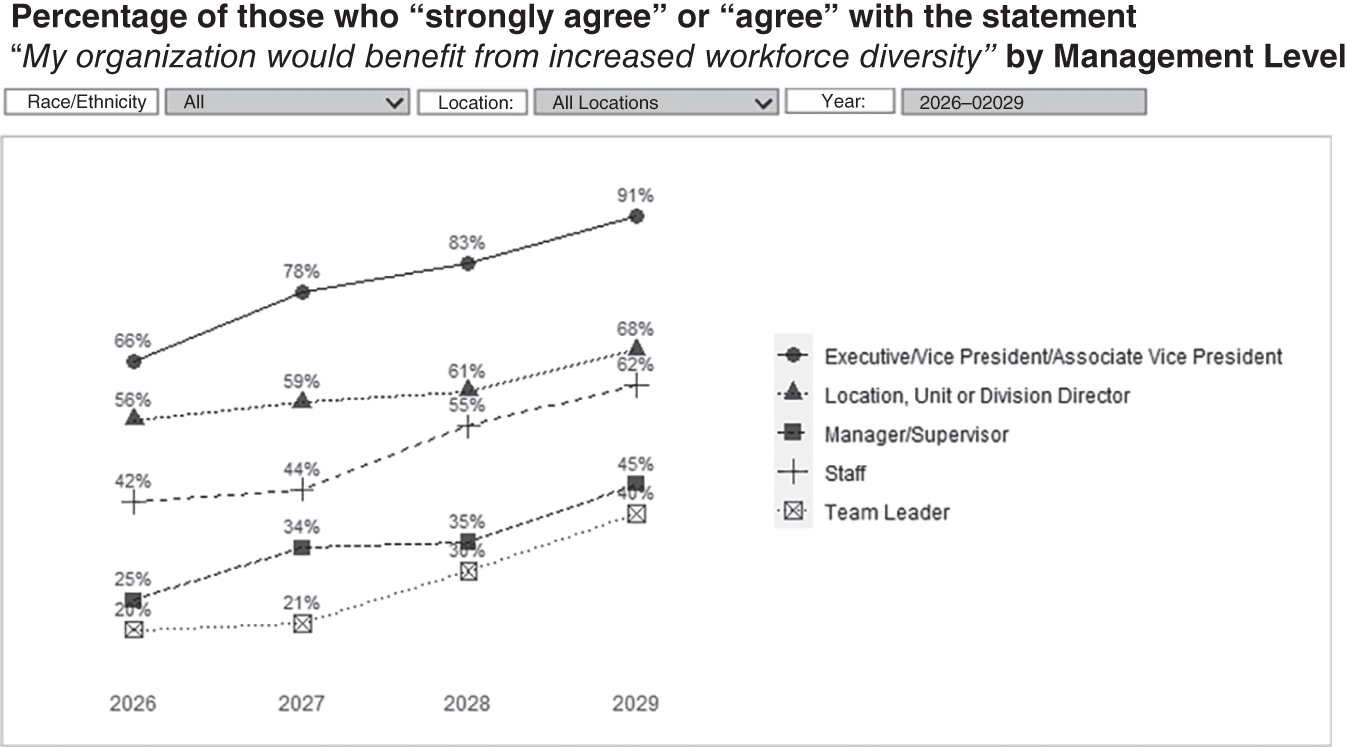
FIGURE 5.15 Trend Lines

FIGURE 5.16 Dot Plot Graph
Show Clusters and Gaps between Groups over Time
For example: Show distribution between equity scores for different years
Consider using: Dot Plot Graph
As shown in Figure 5.16, dot plots are useful for showing distribution comparison between categories, and also show patterns of that distribution. They are efficient for when comparing between groups. One way to highlight differences between multiple groups and to bring attention to particular groups of focus is to change the shape and size of the dots.
Display and Compare Geographically Related Data
For example: Compare differences between and across office locations
Consider using: Maps
As shown in Figure 5.17, maps are used to illustrate differences between geographies and allow users to quickly compare across multiple geographies. Maps can help users contextualize data in a familiar frame of reference and take in multiple data points at once.
Visualizing Quantitative Data In her article “How to Visualize Qualitative Data,” Ann K. Emery of Depict Data Studio outlines several ways to bring qualitative data to life.3 Among the options are word clouds including packed bubbles, icons beside descriptions and responses, color‐coded phrases, and closed‐ended data beside open‐ended data. Descriptions and examples are provided below.
Word Clouds Emery writes, “Here's the most obvious strategy for visualizing text‐based data: the word cloud, also known as a tag cloud. Frequent words or phrases are shown in larger, bolder font. Less‐frequent words or phrases are shown in a smaller font. Data visualization novices love to love word clouds, while data visualization experts love to hate word clouds. Word clouds are okay for visualizing one‐word descriptions [and for before/after comparisons], but not for visualizing all your qualitative data. I'm not advocating for run‐of‐the‐mill word clouds where you simply dump your interview transcripts into a word cloud and hope for the best. Simply looking at how often a word or phrase appears in your dataset is not a sufficient way to analyze your data! Instead, I'm talking about intentional word clouds—when you've considered other options and have purposefully chosen a word cloud as your visualization of choice.”
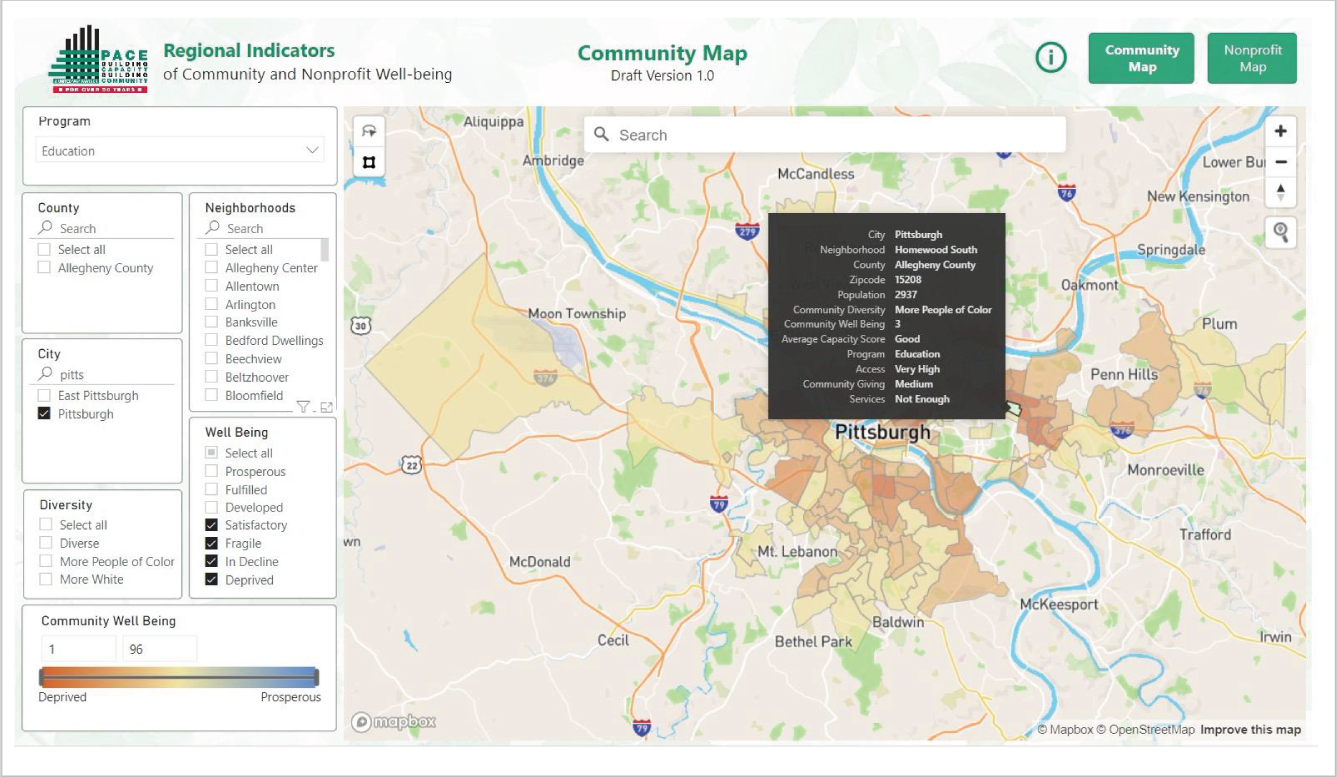
FIGURE 5.17 Map
Source: Generated by the Equitable Impact Platform™ (EquIP™).

FIGURE 5.18 Before/After Word Cloud
Figure 5.18 provides an example of a before/after word cloud depicting one‐word descriptions of an organization's culture before and after embarking upon a DEI journey.
Figure 5.19 shows the same data in the before/after word cloud using packed bubbles, which are similar to word clouds. Whereas word clouds depict word frequency via font size, packed bubbles depict word frequency via bubble size.
There are a multitude of no‐cost and low‐cost tools for generating word clouds. Two of my favorites are: www.jasondavies.com/wordcloud/ and www.freewordcloudgenerator.com.
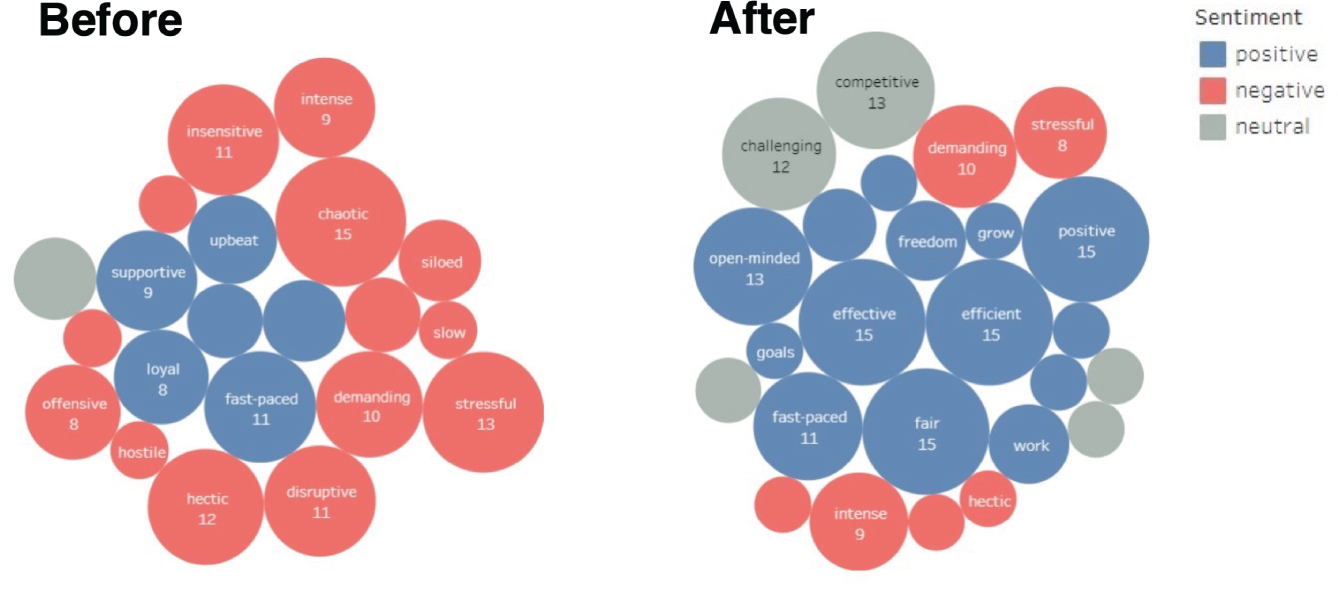
FIGURE 5.19 Before/After Packed Bubbles

FIGURE 5.20 Icons beside Descriptions and Responses
Icons beside Descriptions and Responses Using icons beside descriptions and responses is almost a no‐brainer, especially to break up long sections of text and make them more visually appealing.
Figure 5.20 shows a series of icons used to visually enhance a summary of barriers facing women to becoming executives.
Color‐Coded Phrases Color‐coded phrases are an easy and effective way to visually depict themes within qualitative data. It is recommended that you color‐code both the words and the background/highlighting of the words for easier readability using colors with high contrast such as black letters against a green background/highlight.
Figure 5.21 shows the same focus groups transcripts that were presented previously in Step 1: DEI Inventory using color coding to represent challenges and opportunities for women and people of color. While you cannot discern the colors in this printed text, the responses at the top are presented with black letters against a red highlight, while responses at the bottom are presented using black letters against a green highlight.

FIGURE 5.21 Color‐Coded Phrases
Closed‐Ended Data beside Open‐Ended Data Presenting closed‐ended data beside open‐ended data can be an effective way to visualize both quantitative data that captures what people think/feel and qualitative data that describes why they think/feel that way. Figure 5.22 shows closed‐ended and open‐ended data side by side from an unconscious bias seminar evaluation.
Word clouds, icons besides descriptions and responses, color‐coded phrases, and closed‐ended data beside open‐ended data are all visual representations of qualitative data that can be helpful both in analyzing qualitative data and when results are being communicated. Other options to consider include flow charts, matrixes, diagrams, sketches, drawings, images, cartoons, and analogies.
Creating Great Data Displays In summary, below are key elements of data displays that work.
Headers Headers provide short narrative explanations for the data display. Types of headers include:
- Title for the full display
- Narrative header that describes the key narrative frame for your visual
- Technical title that describes in literal terms what the data displays
Chart Elements This is the area on the chart that displays the data in the chart type chosen. Within the chart, common elements include:
- Axis titles
- Axis
- Ticks
- Gridlines
- Legends
- Markers

FIGURE 5.22 Closed‐Ended beside Open‐Ended
- Data labels
- Rollover: Many dashboard tools offer an additional feature that appears when a viewer clicks on or hovers the mouse over a data point in the visual. Rollovers can provide additional information and increase interactivity for your visualization.
Data Sources It is important to share the original sources of the data displayed in the chart/graph/map. If you have conducted analysis of the source data, you can add “[Your name or organization] analysis of data from [source of data] …”
Methods If you conducted analysis of data presented in the graphic, you should provide a description of the methods that you used to analyze the data. See Figure 5.23.
Review Your Data Visualizations and Narrative to Make Sure They Tell a Cohesive Story Scorecards and dashboards can only tell you what is happening. Data storytelling can tell you why it is happening. Again, we will take a deep dive into DEI storytelling after we discuss developing effective DEI scorecards and dashboards and determining which one is the best fit for you and/or your organization.
Developing Effective DEI Scorecards and Dashboards
A good scorecard and dashboard should not only be easy and intuitive to interpret but should also reflect the very principles of DEI that a person and/or an organization seeks to uphold such as inclusivity, transparency, and accessibility. The following are guiding principles along these lines:
- Focus on people first. Descriptors, headings, legends, and other data labels should be centered on people first and not their characteristics or the demographic group to which they belong. For example, “disabled people” and “homeless people” are centered on disability and homelessness, whereas “people with disabilities” and “people experiencing homelessness,” are centered on people. Similarly, phases such as “Hispanic people,” “Native American employees,” and “Black executives” are centered on people when compared to “Hispanic” and “Native American” and “Black,” which are centered on race, ethnicity, and skin color.
- Disclose availability of data. When reporting data, be explicit about the availability of data according to groupings such as regions, organizational units, and demographic characteristics. For example, in their April 2021 report, “Your Voice Counts: Diversity at Reuters,” Reuters disclosed that 99.9% of their employees supplied data on their gender, 17.3% on their gender identity, 16.5% on their sexual orientation, 50.0% on their race/ethnicity, and 2.1% on the disability status, which is extraordinarily helpful when interpreting the extent to which their data is, or is not, representative of these voices.4

FIGURE 5.23 Elements of an Effective Data Display
- Order labels and responses purposefully. In an article entitled “Are Your Data Visualizations Racist?”5 in the Stanford Social Innovation Review, Alice Feng and Jonathan Schwabish write, “Often, surveys and other data collection methods will order responses in ways that reflect historical biases. Rather than using orders that reinforce ‘white’ and ‘male’ categories as norms, consider ordering labels by sample size or magnitude of results,” or alphabetically.
- Carefully consider colors, icons, and shapes. Scorecard and dashboard designers often employ color conventions such as red, to indicate below‐target or poor performance, yellow, to indicate close‐to‐target or narrowly missed performance, and green, to indicate on‐target or above‐target performance. Be mindful that red/green color blindness is the most common, so to ensure accessibility, you should “avoid green on red and red on green,” advises the Carnegie Museums of Pittsburgh Innovation Studio. “Color should not be the only indicator for interactive elements. For example, underline links on hover, or mark a required field with an asterisk”6 and provide symbols and other visual cues to indicate rates of change such as up or down arrows to indicate increases or decreases and heat maps—data visualizations that depict variations in phenomena using variations in color—to indicate relative magnitudes. Additionally, “In many visualizations, colors can be associated with stereotypes (e.g., pink for women, blue for men) that can reinforce biased perceptions in readers. Similarly, images or icons can reinforce stereotypes (e.g., a woman as a nurse but a man as a doctor). In visualizations, images and colors can help readers connect with the data, but [people] should be mindful of their capacity to exacerbate stereotypes,” also according to Feng and Schwabish.
- Ensure accessibility. Section 508, an amendment to the United States Workforce Rehabilitation Act of 1973, is a U.S. federal law mandating that all electronic and information technology developed, procured, maintained, or used by the federal government be accessible to people with disabilities. Technology is deemed to be accessible if it can be used as effectively by people with disabilities as by people without disabilities. Section 508 uses Web Content Accessibility Guidelines (WCAG) 2.0 to ensure compliance for data accessibility. Make certain data is perceivable, user interface components and navigation are operable, information is understandable, and content is robust enough that it can be interpreted reliably by a wide variety of user agents, including different browsers and assistive technologies.7
- Avoid aggregating into groups that may obscure the realities of subgroups. According to their full report, “Do No Harm: Applying Equity Awareness in Data Visualization” by the Urban Institute, “… a big issue when deciding which groups to include in an analysis or show in a data visualization is the underlying sample size. When there are ‘too few’ observations, populations may be lumped together to make analysis more convenient. Doing so, however, can have harmful effects on the communities that are lumped together. The UCLA Center for Health Policy Research conducts outreach and works with Asian American, Native Hawaiian, and Pacific Islander (NHPI) communities.”8 In the report, Ninez Ponce, MPP, PhD, a professor at the UCLA Fielding School of Public Health, says, “It's a disservice to NHPIs to aggregate to an [Asian American and Pacific Islander] group because the generally better stats of Asians hide the vulnerabilities of NHPIs. That actually could be harmful for the Native Hawaiian Pacific Islander community.” For example, according to the U.S. Census Bureau's American Community Survey (ACS), the overall poverty rate for “Asian or Pacific Islander” is 9.7% but underlying this rate for several aggregated groups lies a wide range of poverty rates ranging from a low of 4.5% for those who identify as Chinese and Japanese to a high of 27.8% for those who identify as Mongolian. It is only by closely examining and disclosing these underlying numbers that the experiences of these subgroups can be properly contextualized.
As you can see, developing an effective DEI scorecard and dashboard is as much about best practices for data reporting as it as about best practices for DEI.
Choosing between DEI Scorecards and Dashboards
Table 5.4 summarizes the key differences between DEI scorecards and dashboards.
For people trying to decide between a scorecard and a dashboard, the good news is that you can have the best of both worlds. Given the range of personal goal‐tracking, habit‐tracking, task‐tracking, and planning apps, tools, and platforms, it is relatively easy to create a personal DEI scorecard and dashboard all in one (a list of options and an example was provided earlier). These tools support the monitoring and tracking of a scorecard with the trend analysis of a dashboard. However, if you prefer to keep it simple, you can use a simple template, like the one illustrated previously, that can be found on BCT's website.
TABLE 5.4 DEI Scorecards vs. Dashboards
| DEI Scorecards | DEI Dashboards | |
| Information | Current and target values for DEI measures, metrics, and KPIs along with a trend analysis. | Current, target, and historical values for DEI measures, metrics, and KPIs with the ability to interactively apply different filters and run various analyses. |
| Level | Executive Summary and High‐Level | Executive Summary and Drill Down |
| Orientation | Strategic | Strategic and Operational |
| Interactivity | Static | Dynamic |
| View | Current (Snapshot) | Current (Snapshot) and Historical |
| Interval | Point in time | Real time |
| Updates | Periodic (weekly/monthly) | Constant |
| Topics | Single (e.g., DEI) | Multiple (e.g., DEI and more) |
| Technology | Optional | Required |
| Access | Less Control | Full Control |
For organizations trying to decide between a scorecard and a dashboard, the decision is determined by what is the best fit for you and/or your organization and what arrives at the right cost/benefit, while recognizing that you can also do both.
Scorecards are relatively easier to implement and can be produced manually, again, with varying degrees of difficulty depending on the extent to which data is available, accessible, integrated, and centralized. Scorecards can be an excellent fit for organizations that are new to DEI, when the single topic of DEI is sufficient for their strategic purposes, and/or they do not have the data and technological infrastructure and capacity to support a dashboard. The downside of a scorecard is the inability to drill down and see historical trends across multiple topics. By comparison, dashboards provide these and other features and functionalities including automation, integration, customization, and personalization, across multiple topics including DEI, and can produce scorecards. While dashboards can require more effort to implement due to the organizational coordination, data integration, and technology implementation requirements, there are a growing number of tools that minimize the hurdles and streamline the process. Dashboards can be a good fit for organizations that are already along their DEI journey and have reasonably mature DEI programs. They are excellent for organizations that have multiple data sources and/or would benefit from an enterprise‐level, integrated, strategic, and operational view across multiple functions including but not limited to DEI. In summary, dashboards are highly recommended but only when there is a clear and compelling cost/benefit. Otherwise, a scorecard will more than likely suffice.
Now that we have fully explored DEI scorecards and dashboards, described best practices for their deployment, and discerned how to choose between them, I will turn our attention to evaluating results and determining DEI impact.
Determining DEI Impact
DEI scorecards and dashboards provide data analyses to gauge progress (i.e., outputs) and determine impact (i.e., outcomes) based on data that has been assembled or aggregated including the data previously collected from your DEI assessment. Back in Step 1: DEI Inventory for People, I commented that it is often by re‐administering the same assessment you identified during that step that you evaluate results. During Step 1: DEI Inventory for Organizations, I recommended that you evaluate your assessment instrument and develop your in‐depth interview and focus group protocol on the premise that they will likely be re‐administered according to a certain frequency (i.e., quarterly pulses, annually, biannually, etc.) to gauge progress, evaluate results, and demonstrate impact. The final piece of the puzzle to fully determining DEI impact is therefore to collect new data and evaluate that data against the data from your DEI assessment.
Collecting New Data
First, you must decide what portion of your assessment to re‐administer. For personal DEI assessments, we recommend re‐administering those that relate to competences, and perhaps adding new ones that relate to preferences and competences. With respect to competences, it is not uncommon to make progress against an assessment instrument and then regress or revert backwards, so by re‐administering the same instrument for competences, you are able to monitor these and other dynamics. Moreover, depending on your results, adding new instruments for preferences and competences offers fresh insights for your DEI journey. The question of whether to re‐administer a personal DEI assessment related to preferences is a nuanced one that I will answer in a moment.
You will recall that your overarching objective is to increase your level of competence in areas that are relevant to your DEI journey. It is not necessarily to change your preferences, but rather to develop an ability (i.e., a competence) to shift, stretch, flex, or expand into areas outside of your preferences and to mitigate blind spots. The immediate value of a personal DEI assessment is to know your preferences, so that you know your tendencies and your blind spots (and to understand the tendencies and blind spots of others), which only requires administering a personal DEI assessment for preferences once. Therefore, while it is useful to re‐administer a personal DEI assessment for competences, it is debatable whether it is useful to re‐administer one for preferences.
On this matter, the following are insights from Herrmann International based on research conducted with their HBDI® assessment for thinking preferences:9
Longitudinal studies of hundreds of HBDI® participants indicate that change can take place if there is a reason for it. Change seems to take place over a long period of time with an individual's desire and willingness to change, or with a change in their life's circumstances, or as result of a significant emotional event. Profiles do not change casually; rather, a dramatic change in the person's life is required to cause a change. Profiles often change when there is an event, or series of events, that has value‐shifting impact. Examples include a major change in the family (e.g., birth of a child, death, divorce), a major career change, going back to school, engaging in a completely different field of study, or maybe even going off to war. Changes to the profile in a 5% range can fairly easily occur, but usually the shape of the profile remains the same. However, if nothing has happened to the individual, and they continue to do the same things in the same way, then the profile will remain stable.
In other words, while the likelihood of preferences changing significantly is low and does not happen overnight, it does happen. Therefore, in addition to re‐administering your personal DEI assessment for competences, I recommend that you re‐administer your personal DEI assessment for preferences, too. This will either corroborate your prior results or illuminate changes. I also recommend combining a personal DEI assessment for preferences with a diverse 360° assessment because, as I cited in Step 1: DEI Inventory for People, the assessment not only reveals preferences and competences, covers a wide range of areas with depth, and seeks diverse perspectives on how well you function in diverse settings, but it also can be easily combined with other assessments. While you may not see significant changes in your personal DEI assessment for preferences within one to two years, you are almost certain to see changes in your diverse 360° assessment within one to two years, thus ensuring that you are receiving valuable feedback and data to inform your DEI journey.
At BCT, we recommend re‐administering a full organizational DEI assessment including quantitative (i.e., culture and climate survey) and qualitative (i.e., IDIs and focus groups) research methods. If you are unable to re‐administer a full organizational DEI assessment, for any number of reasons including cost and other circumstances, then you can explore the following alternatives, some of which were previously discussed in Step 1: DEI Inventory for Organizations:
- Develop a “Stratified Sampling Plan” that surveys a subset of your total employees but is representative of the population. This will reduce the number of people completing the survey.
- Deploy a “pulse survey,” that is, a shorter version of the survey, based on a subset of the original questions that is administered to only a subset of the entire organization. If designed properly to focus on the questions that matter most, a pulse survey can collect valuable information in a short amount of time.
- Reduce the number of questions in your in‐depth interview and focus group protocol. This will shorten the amount of time required from participants while still obtaining qualitative insights.
- Facilitate fewer IDIs and focus groups and/or only invite new voices to participate while ensuring that those voices are representative of the organization. This will reduce the number of people participating in IDIs and focus groups.
While we recommend re‐administering a full organizational DEI assessment, these alternative approaches are viable especially when underrepresented and/or marginalized voices are sufficiently represented in the assessment.
Second, to determine what data should be collected, you must determine the frequency to re‐administer your DEI assessment, which speaks directly to a related question: How long does it take for change to occur?
How Often Should Personal DEI Data Be Collected? How Long Does Personal Transformation Take? According to a study referenced earlier and published in the European Journal of Social Psychology in 2009 entitled, “How Are Habits Formed,” it takes 18 to 254 days for a new behavior to become automatic.10 The study also found that, on average it takes 66 days (roughly two months) to form a new habit. Similarly, in the article “How to Master Skill,” in the Harvard Business Review, Amy Gallo offers perspectives on the pace of personal transformation with insights from Heidi Grant Halvorson, a motivational psychologist and Joseph Weintraub, a professor of management and organizational behavior at Babson College:11
“Too often, we approach a new skill with the attitude that we should nail it right out of the gate,” says Halvorson. The reality is that it takes much longer. “It's not going to happen overnight. It usually takes six months or more to develop a new skill,” says Weintraub. And it may take longer for others to see and appreciate it. “People around you will only notice 10% of every 100% change you make,” he says.
This suggests that it is reasonable to re‐administer a personal DEI assessment for competences at least every six months to one year, depending on the level of effort you are putting forth, as it allows for sufficient time to see measurable changes. Per the insights from Herrmann International above, I recommend re‐administering a personal DEI assessment for preferences after any dramatic life changes or, at minimum, every one to two years.
Gallo also offers the following eight helpful tips for personal transformation and developing new skills:
- Check your readiness
- Make sure it's needed (and relevant)
- Know how you learn best
- Get the right help
- Start small
- Reflect along the way
- Challenge yourself to teach it to others
- Be patient
These guiding principles can help maximize your personal DEI learning journey toward achieving your personal DEI strategic plan.
How Often Should Organizational DEI Data Be Collected? How Long Does Organizational Transformation Take? In their article “Fast Forward: A New Framework for Rapid Organization Change,” in Ivey Business Journal, Elspeth Murray and Peter Richardson, argue that organizations should not have to wait three to five years to experience transformation. “We discovered that it was not so much what people did that led to success, but rather the fact that certain conditions were established during the change process,” they write.12 They proceed to identify the following 10 “winning conditions” for rapid change to be successful:
- Correct diagnosis of the change challenge—its nature, depth, breadth, and the forces at play.
- Early establishment of a shared understanding of the change challenge among the leadership team—a sense of vision, success measures, key programs and projects, and of the change process itself.
- Multiple and ongoing opportunities to enrich this shared understanding—frequent progress reviews and action plan updates.
- A sense of urgency, emphasizing speed when building an awareness and understanding of the need for change, without a crisis, and insisting on early tangible deliverables.
- A limited and focused agenda for change, identifying two, three, or four, major priorities, at a maximum, and driving them hard and fast.
- Rapid, strategic decision making and resource deployment; this is essential to build both speed and, subsequently, momentum.
- A human flywheel of commitment—engaging the early adopters very rapidly, and bringing along the “fence‐sitters” in a timely manner.
- Identifying the sources of resistance and dealing with them ruthlessly—eliminating the “drag” in the process that can prevent the build‐up of momentum, and waste valuable executive time.
- Effective follow‐through on changing key organizational enablers—ensuring that structure, communications, performance evaluation, and recognition/reward are aligned with the new direction.
- Demonstrating strong and consistent leadership—appropriate behaviors that provide tangible, early evidence of true commitment to the change process and the relentless pursuit of the new direction.
Murray and Richardson write, “The first three create guidance for a change initiative [direction], the next three generate and maintain speed, and the remaining four provide critical mass. Together, these winning conditions create the momentum required for success,” they write. “Thus, in terms of today's fast paced … environment, successful change occurs when sufficient speed and mass are generated quickly enough so that enough momentum is created to move the organization quickly, from its state of rest—the status quo—in the desired direction.”13
At BCT, we've observed clients achieve measurable progress with DEI transformation within one to two years when they establish these kinds of conditions. We therefore recommend that our clients conduct a full organizational DEI assessment—quantitative and qualitative—along a similar time horizon of no more than every one to two years. Moreover, we've seen some organizations conduct the DEI culture and climate component of their organizational DEI assessment as a monthly or quarterly “pulse” survey (defined in the previous section). This enables them to respond more quickly to changes and engender accountability on a more frequent basis (i.e., track the performance and provide feedback to managers, supervisors, and leaders).
Table 5.5 summarizes guidelines for the frequency of conducting a personal and organizational DEI assessment.
Evaluating Results
You will recall that Step 1: DEI Inventory involved administering a personal and/or organizational DEI assessment that generated a profile and a baseline, or reference data point, for your DEI journey. By re‐administering some or all of the prior DEI assessment, you can compare the current results to your baseline results while essentially establishing a new baseline or reference data point.
TABLE 5.5 Personal and Organizational DEI Assessment Frequency Guidelines
| Personal DEI Assessment | Organizational DEI Assessment | |
| Frequency | Personal Preference: Every 1–2 years | Full Assessment: Every 1–2 years |
| Personal Competence: Every 6–12 months | Partial Assessment (i.e., “pulse”): Monthly or quarterly |
For example, let's assume that during Steps 1 through 4 for people you took the Antiracist Style Indicator (ASI) as a part of your personal DEI assessment, and it assessed you as an “underfunctioning” antiracist. It is likely that somewhere embedded within your personal DEI objectives and goals was something akin to this: “increase my level of antiracist competence from ‘underfunctioning’ to ‘functioning,’” based on personal DEI strategies and measures informed by the promising and proven practices of a “What Works” model. It is only by re‐administering the ASI in Step 5 that you will know whether you have fulfilled your objective and achieved your goal for antiracist behavior. The data produced by re‐administering the ASI becomes your new baseline or reference data point, which takes you back to Step 1.
As another example, imagine that during Steps 1 through 4 for organizations, your organizational DEI assessment involved BCT's DEI Workforce and Workplace Assessment™ (DWWA™) survey combined with focus groups with members of the LGBTQIA+ community, whereas the DWWA™ survey revealed that they experienced statistically significant higher incidents of bullying and discrimination reports. It is reasonable to assume that among your organizational DEI objectives and goals was something similar to this: “decrease incidents of bullying and discrimination reports by 50% and increase feelings of inclusion and belonging by 25% among members of the LGBTQIA+ community,” by leveraging the promising and proven practices of a “What Works” model that informs the DEI strategies and measures established by your organization. While you may be tracking discrimination reports in your HRIS, it is only by re‐administering the DWWA™ and the focus groups in Step 5, or something comparable, that you will know whether you have fulfilled your objective and reached your goal for bullying, inclusion, and belonging. The data produced by re‐administering the DWWA™ and the focus groups becomes a new baseline or reference data point, which takes you back to Step 1.
When you analyzed your personal and/or organizational DEI assessment data in Step 1: DEI Inventory, you began with a blank slate. For people, you sought to generate findings and insights to your personal DEI preferences or personal DEI preferences and competences. For organizations, you sought to find and identify insights to organizational DEI challenges and opportunities, such as statistically significant differences between subgroups (e.g., women vs. men vs. nonbinary; people who are visually impaired vs. people who are deaf and hard of hearing; employees in the domestic office vs. employees in the overseas office; etc.) and between intersections of subgroups (e.g., domestic women who are visually impaired vs. international men who are deaf and hard of hearing). Data is a mirror. What you see is a reflection of you and/or your organization. Here in Step 5: DEI Impact, you have the potential to generate three kinds of findings:
- New findings—By using the same approach that you used to analyze your DEI assessment to analyze your DEI re‐assessment, you will uncover new findings and insights reflecting changes that have occurred since you conducted the prior DEI assessment. For example, one year later your personal DEI re‐assessment may reveal an unanticipated change in your personal DEI preferences due to a major change in your life's circumstances. Similarly, your organizational DEI re‐assessment may reveal a statistically significant and/or observable difference in uncivil behavior at an office location, that was not a finding from the baseline DEI assessment, due to an influx of new employees who are misbehaving.
- Emergent findings—By tracking and monitoring your DEI reports you will glean emergent findings and insights to your outputs, or progress relative to strategies and measures, as well as your outcomes, or impact relative to your objectives and goals. For example, at the end of your first year, you may find that you have completed 95% of your measures (i.e., outputs) and 90% of goals (i.e., outcomes).
- Comparative findings—By comparing current DEI measures, metrics, and key performance indicators (KPIs) to the past, you will illuminate comparative findings and insights; that is, measurable differences and/or statistically significant differences between your baseline DEI assessment and re‐assessment data. For example, one year later the comparison between the Intercultural Development Inventory® (IDI®) score of your personal DEI assessment may uncover a measurable increase from “minimization” (i.e., you de‐emphasize differences) to “acceptance” (i.e., you deeply comprehend differences). Along the same lines, one year later the DEI culture and climate survey of your organizational DEI assessment may uncover a significant decrease in the incidents of bullying toward members of the LGBTQIA+ community.
While it is the combination of emergent findings and comparative findings that allow you to comprehensively evaluate results in the present, the new findings will help inform next steps for the future.
Distinguishing between Correlation and Causation When evaluating results, tremendous care must be taken not to confuse causation with correlation. According to the Australian Bureau of Statistics, “Two or more variables [are] considered to be related, in a statistical context, if their values change so that as the value of one variable increases or decreases so does the value of the other variable (although it may be in the opposite direction):
- Correlation is a statistical measure that describes the size and direction of a relationship between two or more variables. A correlation between variables, however, does not automatically mean that the change in one variable is the cause of the change in the values of the other variable.
- Causation indicates that one event is the result of the occurrence of the other event (i.e., there is a causal relationship between the two events). This is also referred to as cause and effect.
Theoretically, the difference between the two types of relationships is easy to identify—an action or occurrence can cause another or it can correlate with another.14 If you misinterpret correlation for causation you may erroneously conclude that a particular DEI initiative has led to a particular DEI impact when, in fact, there is no basis upon which to draw that conclusion.
For example, let's assume that your organization is executing a DEI strategic plan with the following objectives:
- Objective #1: Increase the number of people with disabilities who are hired
- Strategy #1: Train managers on reasonable accommodations for persons with disabilities
- Objective #2: Increase promotions and advancement of Asian Americans and Pacific Islanders (AAPI)
- Strategy #2: Train managers on allyship for the AAPI community.
If the AAPI allyship training coincides with an increase in the number of people with disabilities hired, then the two variables, “number of managers trained in AAPI allyship” and “number of people with disabilities hired,” may have a correlational relationship with another (i.e., an increase in AAPI allyship trainings is associated with an increase in people with disabilities hired), but an action or occurrence of one does not likely cause another (i.e., an increase in AAPI allyship trainings does not lead to an increase in the people with disabilities hired, or vice versa). However, if we consider the two variables, “number of managers trained on reasonable accommodations for persons with disabilities” and “number of people with disabilities hired,” it is reasonable to expect that there may be a causal relationship between them. How can this be established? It is easier to establish correlation than it is to establish causation.
To establish correlation between two variables, you can simply calculate ther value or correlation coefficient or effect size, which measures the strength of a linear relationship between the two variables. It ranges between −1.0 and +1.0, whereas:
- An effect size of −1.0 indicates a strong negative correlation between two variables (an increase in one variable leads to a decrease in the other variable)
- An effect size of 0 indicates no correlation between two variables
- An effect size of +1.0 indicates a strong positive correlation between two variables (an increase in one variable leads to an increase the other variable)
A good rule of thumb is:
- An effect size between ±0.50 and ±1.0 is said to be a strong correlation
- An effect size between ±0.30 and ±0.49 is said to be a medium correlation
- An effect size below ±0.29 is said to be a small correlation
Correlation is determined simply by the strength of the effect size. The approach to establish causation is more complex, and the bar is much higher.
A prominent approach to establishing causation is to conduct a controlled experimental study (i.e., “a randomized control trial (RCT)”) that randomly assigns the intervention or “cause” to one group (i.e., the treatment group) and does not assign the intervention or “cause” to a comparable group (i.e., the control group) and then determines whether the outcome or “effect” produced by the treatment group represents a statistically significant improvement when compared to the control group. Continuing with the previous example, the intervention (cause) is training managers on reasonable accommodations for persons with disabilities and the outcome (effect) is the number of people with disabilities hired. A controlled experimental study would randomly select a group of managers to receive training on reasonable accommodations and randomly select a group of managers who would not receive the training, and then determine whether the proportion of people with disabilities hired by interview panels with managers who received the training represented a statistically significant increase when compared to the proportion of people with disabilities hired by interview panels with managers who did not receive the training. Conducting a controlled experimental study is often not ethical, practical, or appropriate in a real‐world setting. For example, most organizations would wisely prefer to train all of their managers as opposed to randomly training certain managers. In these instances, you can explore two options.
The first option you can explore is a quasi‐experimental study. For example, if you're able to track the interview panels with managers that happen to have been trained on reasonable accommodations (treatment group or Group A) and compare their results to interview panels with managers that happen to not have been trained on reasonable accommodations (control group or Group B), you can compare the outputs of the two groups—the proportion of people with disabilities hired—to determine if there is a statistically significant difference between them. While the determination of which managers would be trained on reasonable accommodations for people with disabilities was not randomly assigned, Group A and Group B represent a “naturally occurring experiment” nonetheless because they manifested organically by virtue of the fact that some managers happened to have been trained and some managers happened to have not been trained thus far. This approach can enable you to paint a picture of causation as long as you incorporate one final and important technique: blocking.
Blocking is the arrangement of experimental units in groups (blocks) that are similar to one another. Blocking stems from a determination of the variables considered salient for comparison (also known as the variables you want to “control for”). Stated simply, blocking allows you to compare apples to apples and oranges to oranges. Continuing with the previous example, let's assume you want to arrange your experimental units (i.e., the people interviewed) according to years of experience and level of education. In other words, when examining the number of people interviewed, you only want to compare people with the same years of experience and the same level of education, so you are comparing apples to apples. You could reasonably select people interviewed with three to five years of experience and a bachelor's degree as your block for comparison. This will allow you to control for years of experience and level of education when you test for statistical significance to determine causality.
Table 5.6 depicts this scenario based on 400 people interviewed in Group A and 500 people interviewed in Group B. After blocking (controlling) for experience and education, these numbers drop to 200 and 300, respectively, leading to a proportion of people with disabilities hired of 25% for interview panels with a trained manager and 10% for interview panels without a trained manager, respectively. A test of statistical significance results in a p‐value of 0.002, which indicates statistical significance at the p ≤ 0.01 level and an effect size of 0.6, which indicates a strong correlation. This would suggest that the reasonable accommodations training did indeed have a causal relationship with the hiring and should be expanded to continue making progress in hiring people with disabilities.
As mentioned in Step 1: DEI Inventory for Organizations, there are several software applications that can automate calculations of effect size (correlation) and tests of statistical significance such as SAS, SPSS, Stata, SUDAAN, and WesVar. Moreover, if you leverage a standardized DEI culture and climate survey from a vendor, it is very likely that they have also automated these calculations and tests into their analysis and reporting. At BCT, we have been developing an algorithmic approach to quasi‐experimental studies that leverages data analytics and machine learning called Equitable Analytics™. Equitable Analytics™ was identified as a “What Works” model for organizations in Step 3: DEI Insights and will be highlighted again in the conclusion.
TABLE 5.6 Quasi‐Experimental Study of Training and Hiring Persons with Disabilities
| GROUP | Number of People Interviewed | Number of People Interviewed with 3−5 Years of Experience and a Bachelor’s Degree | Number of People with Disabilities Interviewed | Number of People with Disabilities Hired | Proportion of People with Disabilities Hired |
| Group A (Panels with a Trained Manager) | 400 | 200 | 30 | 8 | 25.0% |
| Group B (Panels without a Trained Manager) | 500 | 300 | 45 | 5 | 10.0% |
| p‐value | 0.002 | ||||
| Effect Size | 0.6 |
The second option you could explore to establish causality is an observational study, which closely observes the experiences of interview panels and, using some combination or surveys, interviews, focus groups, outputs, and/or outcomes, assesses the strength of the relationship between cause and effect. For a deep dive into determining causation, I recommend The Book of Why: The New Science of Cause and Effect by Judea Pearl and Dana Mackenzie.
The important lesson here is to not jump to conclusions that your DEI strategies or outputs are necessarily the cause of, versus correlated with, your DEI results and outcomes when interpreting findings and evaluating results.
Generating Findings
Generating findings represents the final piece of the puzzle to fully determining impact. This necessitates a close examination of the following results to paint a comprehensive picture of impact:
- For People:
- Based on your personal DEI assessment and re‐assessment data, you should examine:
- The extent to which your preferences—the things you tend to think, feel, and do—have changed or remained the same and the extent to which you have greater awareness and/or appreciation of your preferences and those of others.
- The extent to which you have increased your level of competence—the ability to do something properly and successfully—and improved your knowledge, skills, and attitudes/attributes (KSAs) in the areas you have designated.
- Depending on the personal DEI assessment tool(s) you selected, this may include examining the extent to which you are able to shift, stretch, flex, or expand into areas outside of your preferences and mitigate blind spots in the areas you have designated.
- Based on your personal DEI assessment and re‐assessment data, you should examine:
- For Organizations:
- Based on your organizational DEI assessment and re‐assessment data (with disaggregated data), you should examine:
- The extent to which the comparative results show significant and/or observable differences in the areas you have designated, as evidenced by quantitative data, which captures what people think/feel about a topic, and qualitative data, which captures why or how people think/feel that way.
- Based on your organizational DEI assessment and re‐assessment data (with disaggregated data), you should examine:
- For People and Organizations:
- Based on your DEI results data and reports (with disaggregated data)—scorecard and/or dashboard—including leading indicators, often related to equity and inclusion, that look forward at future outcomes and events, and lagging indicators, often related to diversity, that look back at whether the intended result was realized, you should examine:
- The extent to which progress has been made because strategies have been executed and evaluated against measures (i.e., outputs).
- The extent to which an impact has been achieved because objectives and goals have been accomplished and appraised against metrics and key performance indicators (KPIs) (i.e., outcomes).
- Based on your DEI results data and reports (with disaggregated data)—scorecard and/or dashboard—including leading indicators, often related to equity and inclusion, that look forward at future outcomes and events, and lagging indicators, often related to diversity, that look back at whether the intended result was realized, you should examine:
The totality of the results and findings—new, emergent, and comparative—from your DEI reports and DEI re‐assessment (Step 1: DEI Inventory) will likely reshape, refine, or redefine the DEI objectives and goals you embrace (Step 2: DEI Imperatives), the DEI promising and proven practices or “What Works” model you adopt (Step 3: DEI Insights), and the DEI strategies and measures you pursue (Step 4: DEI Initiatives) thereafter, particularly given that certain objectives will likely be achieved, certain strategies will no longer be tenable, and certain promising and proven practices will no longer be relevant, while others will likely remain. In this regard, Step 5: DEI Impact does not signify the culmination, but rather, the continuation of your DEI journey and the cornerstone for a cycle of continuous learning, development, and improvement. The final part of Step 5: DEI Impact is DEI data storytelling or integrating the results and findings to craft and communicate compelling DEI stories.
The Power of DEI Storytelling
In her TED Talk “The Danger of a Single Story,” Nigerian writer and feminist Chimamanda Ngozi Adichie speaks to the power of storytelling.15,16 She explains that when we tell a single story about others—stereotype them, place them into groups, and no longer see them as individuals: “It robs people of dignity. It makes our recognition of our equal humanity difficult. It emphasizes how we are different rather than how we are similar.” She poignantly explains the interrelationship between stories and power:
It is impossible to talk about the single story without talking about power. There is a word, an Igbo word, that I think about whenever I think about the power structures of the world, and it is “nkali.” It's a noun that loosely translates to “to be greater than another.” Like our economic and political worlds, stories too are defined by the principle of nkali: How they are told, who tells them, when they're told, how many stories are told, are really dependent on power.
Power is the ability not just to tell the story of another person, but to make it the definitive story of that person. The Palestinian poet Mourid Barghouti writes that if you want to dispossess a people, the simplest way to do it is to tell their story and to start with, “secondly.” Start the story with the arrows of the Native Americans, and not with the arrival of the British, and you have an entirely different story. Start the story with the failure of the African state, and not with the colonial creation of the African state, and you have an entirely different story.
Adichie's words are reminiscent of two popular quotes: The African Proverb, “Until the lion learns how to write, every story will glorify the hunter” and “History will be kind to me, for I intend to write it,” as stated by former prime minister of the United Kingdom, Winston Churchill. Stories have power so there is power in storytelling. There is power in your sharing your story and the stories of others, which speaks to the power of DEI data storytelling or data storytelling through the lens of DEI.
DEI Data Storytelling
Data storytelling is the process of crafting a compelling narrative and sharing insights based on data using visuals. DEI data storytelling enables you to personalize the DEI journey, contextualize data, chronicle progress, synthesize findings, integrate results, and comprehensively demonstrate impact. When done effectively, DEI data storytelling can also inspire and motivate you and others to build momentum and take action. More specifically, DEI data storytelling offers three value propositions:
- Humanize data and empower—Personal stories can get lost in any data‐driven approach. People are the “what” and the “why” for DEI. Personal stories must remain front and center. DEI data storytelling can help ensure that a diverse set of voices are uplifted representing a diverse range of lived experiences. In doing so, we humanize data by “putting a face” on it. Ngozi Adichie states, “Many stories matter. Stories have been used to dispossess and to malign. But stories can also be used to empower, and to humanise.”
- Communicate lasting and emotional messages—Storytelling is among the most effective ways to communicate a lasting message. Research has found that stories are more memorable, more persuasive, and more engaging.17 For example, according to a study by Chip Heath at Stanford University, 63% of people can recall based on stories, while only 5% of people can recall based on statistics.18 In his article “The Neuroscience of Storytelling,” Erik Larson explains how stories engage more of the brain than data and facts. “When packaged into a story, your fact set has a bridge to the emotional part of the brain. What neuroscientists observed is that factual information only engages two parts of the brain, Broca's and Wernicke's area. This is in stark contrast to the spectrum of other parts of the brain engaged by a story, including movement, smell and emotion. People hear statistics, but people feel stories,”18 writes Larson. DEI storytelling enables people to feel the experiences of those who are different from them.
- Inspire and motivate action—DEI storytelling can paint a clear and compelling picture of what has happened and why it has happened. When people can relate to these stories and see reflections of their lived experience, it can inspire them to see greater possibilities for themselves and others. In doing so, the lasting impression left by a well‐crafted DEI story can also represent a call to action. By seeing what is possible, and how to make it possible, DEI stories can motivate people to pursue new paths or recommit to existing ones. Interestingly, this hearkens back to the very beginning of our DEI journey in Step 0: DEI Incentives where we discussed intrinsic and extrinsic motivation. DEI storytelling can lead to intrinsic motivations such as self‐interest or internal desires, or extrinsic motivations by demonstrating benefits or rewards. In his article, “Storytelling for Action,” Peter Minimum, a market researcher, concludes, “The movement captured in a complete story is the best way to engage an audience and communicate an idea that results in action.”19
I will now explain the elements of DEI data storytelling.
The Three Elements of DEI Data Storytelling The three elements of DEI data storytelling are:
- Data—A complete and integrated analysis of the relevant quantitative and qualitative data, including data from your assessment, measures, metrics, and KPIs, to paint a full picture and set the stage for the narrative.
- Narrative—An oral or written storyline reflecting insights from the data analysis, context surrounding the data, messages being communicated, ideas sought to convey, and call to action.
- Visuals—A visual representation of the data according to the narrative in the form of tables, charts, pictures, diagrams, graphics, infographics, videos, and the like.
These elements should combine to produce clear and compelling stories that are lasting and lead to desired change. Along these lines, in his Forbes article “Data Storytelling: The Essential Data Science Skill Everyone Needs,” Brent Dykes explains how these different elements work together to produce associated outcomes (see Figure 5.24):20
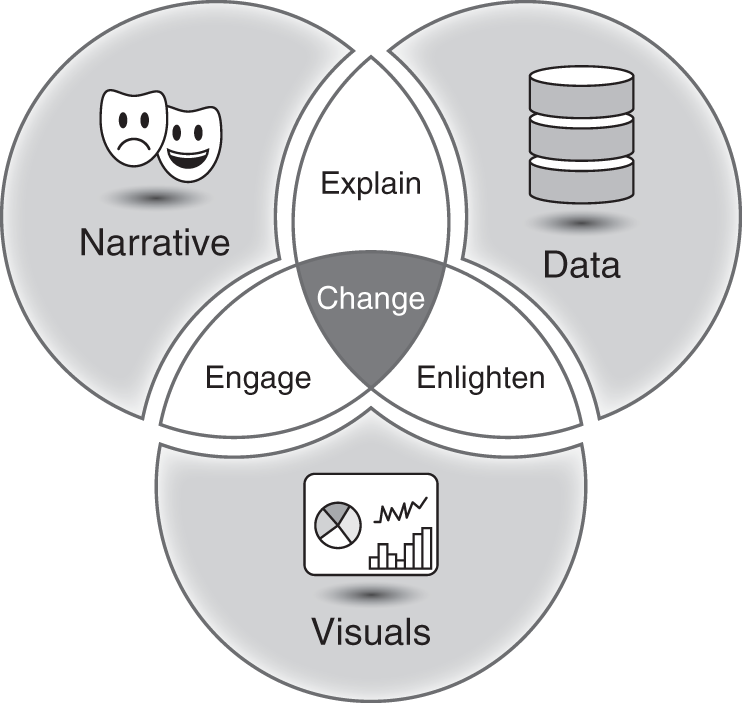
FIGURE 5.24 The Three Elements of Data Storytelling
When narrative is coupled with data, it helps to explain to your audience what's happening in the data and why a particular insight is important. Ample context and commentary are often needed to fully appreciate an insight. When visuals are applied to data, they can enlighten the audience to insights that they wouldn't see without charts or graphs. Many interesting patterns and outliers in the data would remain hidden in the rows and columns of data tables without the help of data visualizations. Finally, when narrative and visuals are merged together, they can engage or even entertain an audience. It's no surprise we collectively spend billions of dollars each year at the movies to immerse ourselves in different lives, worlds, and adventures. When you combine the right visuals and narrative with the right data, you have a data story that can influence and drive change.
A key takeaway is that while DEI data collection, data analysis, and data reporting are all distinct and important capabilities, DEI data storytelling is equally distinct and important. In fact, ineffective data storytelling can completely negate and undermine all its predecessor steps no matter have effectively they have been executed. It is therefore of paramount importance that DEI stories be crafted and communicated with care to honor the DEI journey and maximize impact.
The Eight Components of Crafting and Communicating a Compelling DEI Story Crafting and communicating a compelling DEI story is made up of the same components of crafting and communicating a compelling story, only data, narrative, and visuals play a central role. These components are summarized according to the following eight “P's” of population, premise, people, problem, plot, principles, packaging, and platform. As you will see, they artfully weave together the three elements of data storytelling of data, narrative, and visuals.
Population (Audience) Question: Who is the intended audience for the DEI story?
The first and foremost “P” is to identify the target population, audience, or recipients of your DEI story. For example, from a personal perspective, you may target friends, family, or colleagues to share your experiences. From an organizational perspective, you may target the entire organization, or people in certain divisions, departments, locations, or roles, to share accomplishments. Moreover, your intended audience may be internal and allow greater disclosure of confidential data, or external and place certain restrictions on disclosure of confidential data. Making the determination of audience can significantly impact what story you tell and how you tell it.
Premise (Scene and Setting) Question: What is the scene or site for the DEI story?
For the second “P” of premise you should define the locus or locale for your DEI story whether it is your personal journey, that of someone else, a specific team or group, or the entire organization. The premise sets up the remaining components.
Question: What is the setting or the internal and external environmental conditions that relate to the DEI story?
As a part of defining the premise, you should also determine what background information is important to consider or disclose to provide sufficient context for your audience. For example, from a personal perspective, you may have just moved to a different city with greater diversity and desired to diversify your friendships, or your DEI journey may be part of an even broader journey of personal transformation. Moreover, you may have recently joined an organization with a strong commitment to DEI, or you were just promoted to a leadership position with DEI responsibilities, or your performance appraisal may now include DEI performance measures. Alternatively, your organization may have recently made a public commitment to DEI, or your organization may have experienced a precipitous decrease in the representation of people of color in the managerial and supervisory ranks, or your organization may have recently hired a new CEO or Chief DEI Officer who has ushered in a new strategic agenda for DEI. These are important contextual matters that help people to better understand and appreciate the DEI story.
People (Characters) Question: Who are the primary characters in the DEI story?
The third “P” is identifying the people who will be highlighted within the DEI story. To the greatest extent possible, include diverse characters in the story. Also consider which characters are the best representatives for the DEI story and which characters can best relate to the intended audience for the DEI story. If the story relates to addressing the challenges faced by people of color, then you will necessarily need to include Black, Hispanic, and/or Native American characters. At the same time, if your intended audience includes white men then it may also be beneficial to include a white male character, say, who served as an ally with people of color, with whom they can relate. Quantitative and qualitative data from your DEI assessment or DEI results can help pinpoint groups that are experiencing particular challenges or demonstrating noteworthy success. Permission should always be obtained to retell someone's experiences. Use pseudonyms when it is necessary or desired to protect their confidentiality, maintain their privacy, or ensure their anonymity.
Problem (Conflict) Question: What is the problem, conflict, or issue in the DEI story?
DEI stories are often about solving the root causes of problems, resolving conflicts between people and groups, dismantling barriers, mitigating or eliminating inequities, and achieving equitable outcomes for all. The fourth “P,” problem, prompts you to make clear the underlying issues that were sought to be addressed in the DEI story. These matters are often revealed from the quantitative and qualitative data found in your DEI assessment. For example, your personal DEI assessment results may have revealed a bias in favor of young people over the elderly, or your organizational DEI assessment results may have found a higher proportion of harassment toward women in the accounting department. Direct quotes, testimonials, and visuals are often especially helpful in clearly and effectively depicting challenges and opportunities.
Plot (Storyline) Question: What are the main elements of the DEI story (i.e., the storyline)?
Principles (Themes) Question: What are the key themes and ideas you want the audience to take away from the DEI story (i.e., principles)?
The storyline represents the essence of the DEI story. It outlines the premise, introduces the people, and explains the challenge or opportunity, eventually leading to purposeful resolution and/or insights that portray specific principles. The storyline artfully weaves together narrative and data to explain to the audience what happened including the premise, the challenge or opportunity, and resolution; the visuals and data to enlighten the audience to key insights (e.g., successes, failures, lessons learned, etc.); and narrative and visuals to engage the audience by presenting data displays.
The fifth “P,” plot, and sixth “P,” principles, are about crafting a compelling storyline that brings valuable principles to life. Principles are woven into the tapestry of the storyline. They represent the larger takeaways you hope the audience draws from the storyline that can inspire and motivate action and influence and drive change.
For example, a personal DEI storyline could chronicle your yearlong efforts to successfully increase your intercultural competence. The storyline could explain to your audience of family, friends, and colleagues how relocating to a new city with greater diversity presented new opportunities to explore cultural differences and motivated you to become more effective in navigating cultural differences as well as the number and nature of the books, articles, plays, travel, excursions, journal entries, and coaching sessions you completed (narrative and data). The storyline could engage your audience with reflections and visuals from your travel and excursions and your personal testimonial of the impact increased intercultural competence has had on you personally and professionally (narrative and visuals). The storyline could enlighten your audience by sharing the Intercultural Development Continuum™ (IDC™) and visually depicting the increase in your Intercultural Development Inventory® (IDI®) score from a developmental orientation score of 102 to 120 on the IDC®, which represents an improvement from “minimization” (i.e., you de‐emphasize differences) to “acceptance” (i.e., you deeply comprehend differences) (visuals and data). Principles such as persistence, the benefits of stepping outside of one's comfort zone into their growth zone, and the value of deeply comprehending differences could be woven into the storyline, thus inspiring and motivating you to continue your journey and others to do the same.
For example, an organizational DEI storyline could explain to your audience of managers and supervisors throughout your organization how the organizational DEI assessment data revealed that people of color were underrepresented within the managerial and supervisory ranks with statistically significant differences in discrimination and a lack of mentorship, sponsorship, and visibility to new opportunities (narrative and data). It could further explain the purpose and number of participants in a formal mentoring program and an allyship training program to address these issues (narrative and data). The storyline could engage your audience with the personal stories and testimonials, including direct quotes, of both people of color and their mentors and allies that describe their experiences as participants in these various initiatives, as well as pictures from training sessions and an awards ceremony where certain participants were recognized as “DEI Champions” for their exemplary contributions (narrative and visuals). The storyline could enlighten your audience with charts and graphs showing increased representation of managers and supervisors of color and decreased incidents of discrimination over time (visuals and data). Embedded within the storyline could be principles such as fairness, the importance of creating a culture of inclusion and belonging, and equitable outcomes for all that could influence and drive greater change.
Packaging (Format) Question: How will you package the DEI story?
Platform (Channels) Question: What are the most effective communications channels to distribute the DEI story?
The seventh “P” of packaging determines the format for your DEI story and the eighth “P” determines the appropriate platforms to communicate it. There is a plethora of options along both lines. Format options include videos, newsletters, press releases, blogs, reports including annual reports, articles, marketing materials, talking points, speeches, advertisements, and more. Potential communications channels include direct e‐mails, mass e‐mails, social media, news media (wires, radio, television, print, digital), text messages, chat, intranets, websites, conferences, events, one‐on‐one or group meetings, in‐person or virtual meetings, lunch‐and‐learns, retreats, and more. Of course, the key is to match the format to the channel and the channel to the audience. For example, a video posted on social media may be effective in reaching tech‐savvy colleagues while a newsletter delivered via mass e‐mails or an intranet may be effective in reaching others. Talking points and speeches delivered via meetings and town halls may be effective in reaching an internal audience of employees while a press release distributed through a website or newswire may be effective in reaching an external audience of stakeholders. Consider which format and channel are most likely to be effective in reaching your target audience.
Continuing the Five‐Step Cycle of Data‐Driven DEI
In conclusion, be mindful that you can tell your DEI story at every step along your DEI journey: after you’ve completed your assessment (Step 1: DEI Inventory), once you've established your objectives and goals (Step 2: DEI Imperatives), at the point when you have identified promising and proven practices (Step 3: DEI Insights) and arrived at strategies and measures (Step 4: DEI Initiatives) and, of course, when you have results to be shared (Step 5: DEI Impact). Whether you are sharing your DEI story in a 280‐character post on social media among friends and family, or in an 80‐page annual report that is widely distributed and released to the public, DEI is a never‐ending journey, so DEI storytelling is a never‐ending endeavor.
Notes
- 1. https://www.ntaskmanager.com/blog/goal-tracking-apps/
- 2. https://nationalequityatlas.org/lab/get-started-data-visualization
- 3. https://depictdatastudio.com/how-to-visualize-qualitative-data/
- 4. https://static.reuters.com/resources/media/editorial/20210405/DiversityReportApril2021.pdf
- 5. https://ssir.org/articles/entry/are_your_data_visualizations_racist
- 6. http://web-accessibility.carnegiemuseums.org/design/color/
- 7. https://alpine-consulting.com/blog/508-compliance-and-tableau/
- 8. https://www.urban.org/research/publication/do-no-harm-guide-applying-equity-awareness-data-visualization
- 9. https://www.thinkherrmann.com/hubfs/CP_Site/HBDI_and_Whole_Brain_Thinking_FAQ.pdf
- 10. Phillippa Lally, Cornelia H. M. van Jaarsveld, Henry W. W. Potts, and Jane Wardle, “How Are Habits Formed: Modelling Habit Formation in the Real World,” European Journal of Social Psychology, July 16, 2009.
- 11. https://hbr.org/2012/11/how-to-master-a-new-skill
- 12. https://iveybusinessjournal.com/publication/fast-forward-a-new-framework-for-rapid-organizational-change/
- 13. https://iveybusinessjournal.com/publication/fast-forward-a-new-framework-for-rapid-organizational-change/
- 14. https://www.abs.gov.au/websitedbs/D3310114.nsf/home/statistical+language+-+correlation+and+causation
- 15. https://www.ted.com/talks/chimamanda_ngozi_adichie_the_danger_of_a_single_story?language=en
- 16. https://maorilandfilm.co.nz/chimamanda-ngozi-adichie-the-danger-of-a-single-story/
- 17. https://www.forbes.com/sites/brentdykes/2016/03/31/data-storytelling-the-essential-data-science-skill-everyone-needs/?sh=61ac6e8152ad
- 18. http://eimpact.report/blog/18/01/09/the-neuroscience-of-data-storytelling.html
- 19. https://martech.org/storytelling-action-brands-need-tell-complete-story/
- 20. https://www.forbes.com/sites/brentdykes/2016/03/31/data-storytelling-the-essential-data-science-skill-everyone-needs/?sh=61ac6e8152ad