Conclusion: The Future of Data‐Driven DEI
Innovation is the introduction of something new … after you were born.
Nothing about us, without us.
Any book highlighting innovations runs the risk of quickly becoming outdated. In fact, the moment this book hits bookshelves the clock is already ticking that there will be a new concept, tool, technique, technology, model, methodology, program, platform, or approach that redefines the game for data‐driven DEI. While I'm reasonably confident that the five‐step cycle of Data‐Driven DEI is sufficiently durable to stand a test of time, I humbly accept that certain innovations I have profiled will inevitably become obsolete (and therein lies the opportunity to write future editions of this book!).
Nonetheless, I conclude this edition by offering my thoughts on the future of Data‐Driven DEI and, more specifically, a few thematic areas that will likely transform the landscape of Data‐Driven DEI. While I highlight specific innovations, I also emphasize guiding principles to help you navigate whatever future lies ahead.
DEI and Equitable Analytics™
At various points throughout this book, I have referenced Equitable Analytics™ and the Equitable Impact Platform™ (EquIP™), which is powered by geospatial Equitable Analytics™. Pioneered by Peter York, BCT's principal and chief data scientist, Equitable Analytics™ points to the future of Data‐Driven DEI both methodologically and ideologically.
As a methodology, Equitable Analytics™ is an equitable solution for figuring out what works for whom or, stated differently, what “causes” a result or outcome for whom. Equitable Analytics™ is a part of what Judea Pearl, in his book The Book of Why: The New Science of Cause and Effect, refers to as the “the Causal Revolution,” because the underlying concept of “what works” is cause and effect. Referring to our discussions in Step 3: DEI Insights about “What Works” models and in Step 5: DEI Impact about correlation vs. causation, “what works” does not equate to what is associated or correlated with a desired result or outcome, but rather, what causes a desired result or outcome. “Nowadays, thanks to carefully crafted causal models, contemporary scientists can address problems that would have once been considered unsolvable or even beyond the bale of scientific inquiry… . The mere mention of ‘cause’ or ‘effect’ would create a storm of objections in any reputable statistical journal,” writes Pearl. Even two decades ago, asking a statistician questions like, “Does DEI training mitigate unconscious bias?” or “Do ERGs increase feelings of inclusion and belonging?” would have been like asking if she believed in voodoo, according to Pearl. He continues, “But today [we can] pose such questions routinely and answer them with mathematical precision. To me, this change is nothing short of a revolution. I dare to call it the Causal Revolution, a scientific shakeup that embraces rather than denies our innate cognitive gift of understanding cause and effect.”1
Equitable Analytics™ uses BCT's Precision Modeling to build causal models that understand cause and effect for specific populations and accomplish this at a level of granularity that is more nuanced and more insightful than simply disaggregating data by demographics. While disaggregating data by demographics is a recommended and useful practice, we also know that our ability to understand what works for whom is insufficient when examined solely through a demographic lens. Equitable Analytics™ can provide deeper insights and will increasingly supplant disaggregating data by demographics alone (see Figure 6.1). According to Peter during a one‐on‐one conversation, “With the tools we now have available, we can make tailored and precise recommendations that predict a desired DEI outcome in the same way Netflix and Amazon can make a tailored and precise recommendation that predicts enjoyment from watching a specific movie or reading a specific book. This is revolutionizing DEI, social and community programs.” Understanding the Equitable Analytics™ process helps you to fully understand its power.

FIGURE 6.1 The Equitable Analytics™ Process
Step 1: Determine the Focus of Analysis
The first step in the Equitable Analytics™ process is to determine the focus of analysis or the unit of the analysis. This breaks down to either cases, which includes people and groups of people, or places, which includes various geographic locations. More specifically, there are three choices for the unit of analysis:
- Individuals (Cases)—Defined as individual contributors, managers, supervisors, executives, etc.
- Groups (Cases)—Defined by departments, divisions, office locations, etc.
- Geographies (Places)—A variation of Cases: Groups, defined as geographic locations including neighborhoods, communities, Census Tracts, ZIP codes, counties, and regions.
The focus of analysis determines the entity you desire to say something about. When Equitable Analytics™ is applied to cases, it helps determine and recommend the optimal mix of initiatives and strategies for individuals to improve personal DEI and for groups to improve organizational DEI. When Equitable Analytics™ is applied to places via EquIP™, it helps determine whether a community is receiving the locally accessible government support, philanthropic support, public contributions, social services programming, and volunteerism it needs to improve diversity, inclusiveness, and well‐being, equitably, along with recommendations of the optimal mix.
Step 2: Build a Causal Logic Model
The second step in the Equitable Analytics™ process is to build a causal logic model for the desired outcome with stakeholder engagement. A logic model is a visual diagram depicting the causal assumptions. It uses directional arrows to represent the relationship between contextual factors and resources that best support the workplace experiences that lead to the greatest level of equitable outcomes for all employees. Think of your logic model as a visual diagram of your organization's hypotheses as to what it takes for every employee to succeed. This framework will guide the next steps of Precision Modeling.
For example, let's assume that a desired outcome for your organization is that every employee have an equitable opportunity to advance and be promoted to the management level. However, your organization has experienced challenges with equitably advancing and promoting Black women to the management level. To begin the Equitable Analytics™ process, a team comprised of DEI experts, HR professionals, and diverse colleagues who have had positive and negative experiences reaching the management level, would be engaged in building a causal logic model for advancement and promotion to the management level within your organization. The logic model could include variables such as the number and type of learning and development courses, number and location of departmental rotations, existence of mentorship and sponsorship relationships, and number and type of leadership development programs (see Figure 6.2).

FIGURE 6.2 Equitable Analytics™ Causal Logic Model
When it comes to diversity, equity, and inclusion, it is critically important not to assume that an employee's race, gender, sexual orientation, or other identity characteristics should causally affect their workforce experience. That would be antithetical to valuing DEI. So, your causal logic model should not include workplace context variables reflecting demographic characteristics such as race/ethnicity, gender, age, sexual orientation, disability status, and so forth, with arrows connecting them to one's workplace experience. For example, being a Black woman should not “cause” a different workplace experience, and therefore, demographic and identity variables (e.g., race/ethnicity, gender, age, disability status, etc.) should not be represented in your causal logic model with arrows that affect the workplace experience. In doing so, and recognizing that, unfortunately, it is often the case that demographic and identity variables are sometimes the reason people are selected (and not selected) for certain workplace experiences, such as mentorship and sponsorship, Equitable Analytics™ mitigates this selection bias by excluding these variables from the causal logic modeling (and subsequent Precision Modeling) process.
Instead, your causal logic model should incorporate identity into the outcome of promotion and advancement. Specifically, demographic and identity variables should be represented in your causal logic model as a part of the end result or outcome. For example, demographic and identity variables should be in your causal logic model as the effect of a positive workplace experience at the end of an arrow where your outcome statement states something like “Advancement and promotion of more Black women to management level.”
Step 3: Develop an Analytical Framework
The third step in the Equitable Analytics™ process is to build an analytical framework that will serve as the instructions for conducting the data modeling. The key step in developing the analytical framework is to determine which variables in your administrative data (i.e., existing data in an HRIS, LMS, ERP, CRM, or other DEI‐related data system) align with each of your workplace logic model components (i.e., context factors, experiences, and outcomes). For example, your workplace logic model will likely include contextual factors like employee educational background, position, and level. Your analytical framework will need to identify the specific variables in your administrative data that align with these logic model elements.
Step 4: Conduct Precision Modeling
The fourth step in the Equitable Analytics™ process is to conduct Precision Modeling, which includes the following two tasks:
- Train machine learning algorithms to find matched comparison groups of employees based on sharing similar workplace contexts, like title, educational background, and level of authority/accountability. We all know that the pathways to promotion and advancement are different for different jobs and job contexts. Finding matched comparison groups based on these differences is the foundation of an equitable analytical framework. As noted previously, it is vital that these contextual factors not include demographic or identity variables as these should never be determinants of an employee receiving the ideal workplace experience.
Continuing with the previous example, Equitable Analytics™ could find that there are nine matched comparison groups (refer to Figure 6.3) based on the workplace contextual factors that will affect their likelihood to experience what it takes to advance. Let's assume that matched comparison Group #2 is “project managers in the operations department with 3+ years of experience and a bachelor's degree.” As you can see in Figure 6.3, the current success rate with advancing and promoting members of Group #2 to the management level is 55%, whereas the overall success rate across all groups is 61%.
- Train machine learning algorithms to find and evaluate natural experiments within each matched comparison group. Organizational leaders, managers, and supervisors of similarly positioned employees don't make the same decisions regarding their promotion and advancement. These differences are like natural experiments, where some of the same types of employees get treated differently. The Equitable Analytics™ process applies machine learning algorithms to evaluate these natural experiments to determine what types of workplace experiences cause the greatest gains in promotion and advancement for each matched comparison group of employees.
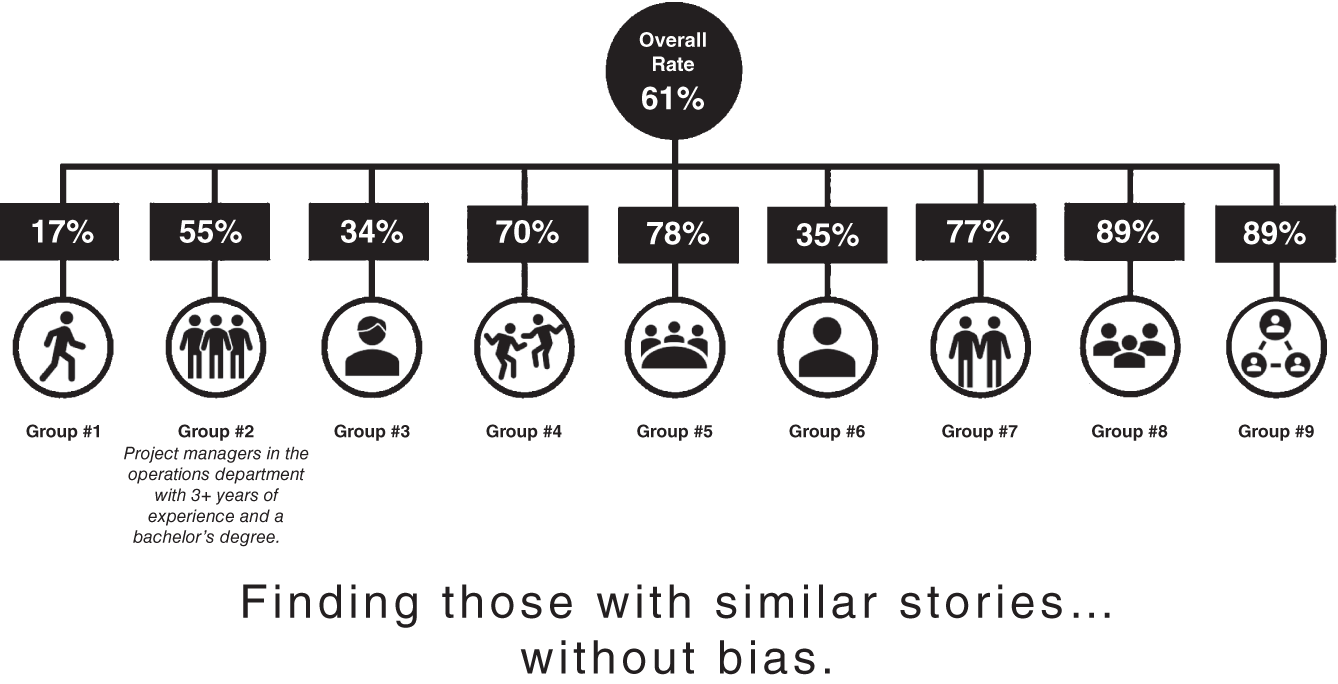
FIGURE 6.3 Equitable Analytics™ Matched Comparison Groups

FIGURE 6.4 Equitable Analytics™ Discovering What Works
Continuing the previous example, Equitable Analytics™ would determine the optimal mix of strategies—including learning and development courses, departmental rotations, mentorship/sponsorship relationships, leadership development programs, and the like—that maximize the likelihood of everyone in Group #2 advancing and being promoted to the management level. The analysis could reveal that an emotional intelligence course, a departmental rotation into marketing and sales, a formally assigned mentor/sponsor, and an inclusive leadership development program represent the most effective mix of strategies (i.e., what causes or “what works”) for members of Group #2 to advance and be promoted to the management level. In fact, when people in this group receive what works, their success rate is 70%, and when people in this group do not receive what works, their success rate is only 5%, as shown in Figure 6.4.
Step 5: Perform an Equity Assessment
Once these determinations have been made of what works for whom, the fifth step in the Equitable Analytics™ process is to perform an equity assessment by putting demographic characteristics such as race/ethnicity, gender, age, disability status, and so forth, back into the algorithmic model to determine whether what works for a matched comparison group has been equitably administered, as shown in Figure 6.5. Continuing with the previous example, Equitable Analytics™ could look at all project managers in the operations department with 3+ years of experience and a bachelor's degree to determine if Black women have been equally as likely as white men to receive what works. As you can see in Figure 6.6, 65% of white men got what works while only 45% of Black women got what works within the same Group #2. Additionally, Equitable Analytics™ could identify which mentors/sponsors have been the most effective (and ineffective) in helping Black women to be promoted and advance to the management level. This offers very nuanced and powerful insights regarding exactly by whom and where inclusivity and allyship are enabling people to advance and exactly by whom and where bias or discrimination may be impeding advancement, which could lead to very targeted actions such as unconscious bias and conscious inclusion training.

FIGURE 6.5 Equitable Analytics™ Assessing Equitable Treatment
Mitigating Algorithmic Bias In addition to mitigating selection bias, Equitable Analytics™ also mitigates algorithmic bias. All too often, data scientists uphold predictive accuracy as the measuring stick for an effective algorithm, but it is not an equitable criterion. For example, an algorithm designed to predict who is the most ideal candidate to become the next CEO of a corporation, nonprofit organization, or private foundation will increase its accuracy by including race/ethnicity as a variable in the model. However, because the majority of CEOs are white men,2 doing so would translate a race/ethnicity bias into an algorithmic bias that advantages certain groups and disadvantages other groups. Hypothetically speaking, based on historical data, the algorithm could predict with 99% accuracy that whites are the most probable selection to become CEOs. However, this would be due to the fact that prior successful CEOs were much more likely to be white as a result of historical racial biases. Once again, race/ethnicity should not be a factor in making this determination. If this hypothetical algorithm were then used to select candidates deemed to be most likely to become CEOs for a leadership development program, it would advantage whites and disadvantage people of color, much like the prior example of how Amazon's computer models translated a gender bias into an algorithmic bias that advantaged men and disadvantaged women seeking jobs. An algorithmic model that removes race/ethnicity would be less accurate; however, it would better reflect the unbiased truth, or representation of what is fair and equitable, that race/ethnicity should not predict who becomes a CEO. By removing demographic variables as predictors of experiencing what it takes to succeed, the Equitable Analytics™ methodology mitigates the algorithmic biases that can result when demographic variables are included in the algorithmic modeling process, thus resulting in algorithms that prioritize the unbiased truth over predictive accuracy. Cathy O'Neil, author of Weapons of Math Destruction: How Big Data Increases Inequality and Threatens Democracy, advocates for such an approach when she writes, “But wait, many would say. Are we going to sacrifice the accuracy of the model for fairness? Do we have to dumb down our algorithms? In some cases, yes.”3
Step 6: Produce Actionable Insights
Finally, the results from Equitable Analytics™ produce summaries of both the current success rate that is attributable to the strategies and interventions each person currently receives and the best possible success rate if each person received the strategies and interventions that work for their group. Put another way, the results present “counterfactual” findings of what happened when a group was and was not appropriately supported to experience what it takes to advance. Once you and your organization determine which strategies and interventions are feasible from among those recommended for each group, such as an emotional intelligence course and a formally assigned mentor/sponsor only for Group #2, Equitable Analytics™ offers a prediction of the success rate you can now anticipate for that group, as shown in Figure 6.6. The solid bar depicts the attributable success rate; the line marked with “X” depicts the best possible success rate if everyone received what works for their group; the gap between the two lines is a performance gap, or a gap between our current performance and our best possible performance given the strategies and interventions currently being offered and tracked. As you can see, if everyone in Group #2 received what works for their group, their success rate would increase from 55% to 91%. Equitable Analytics™ can automatically generate these and other actionable insights in reports and dashboards.
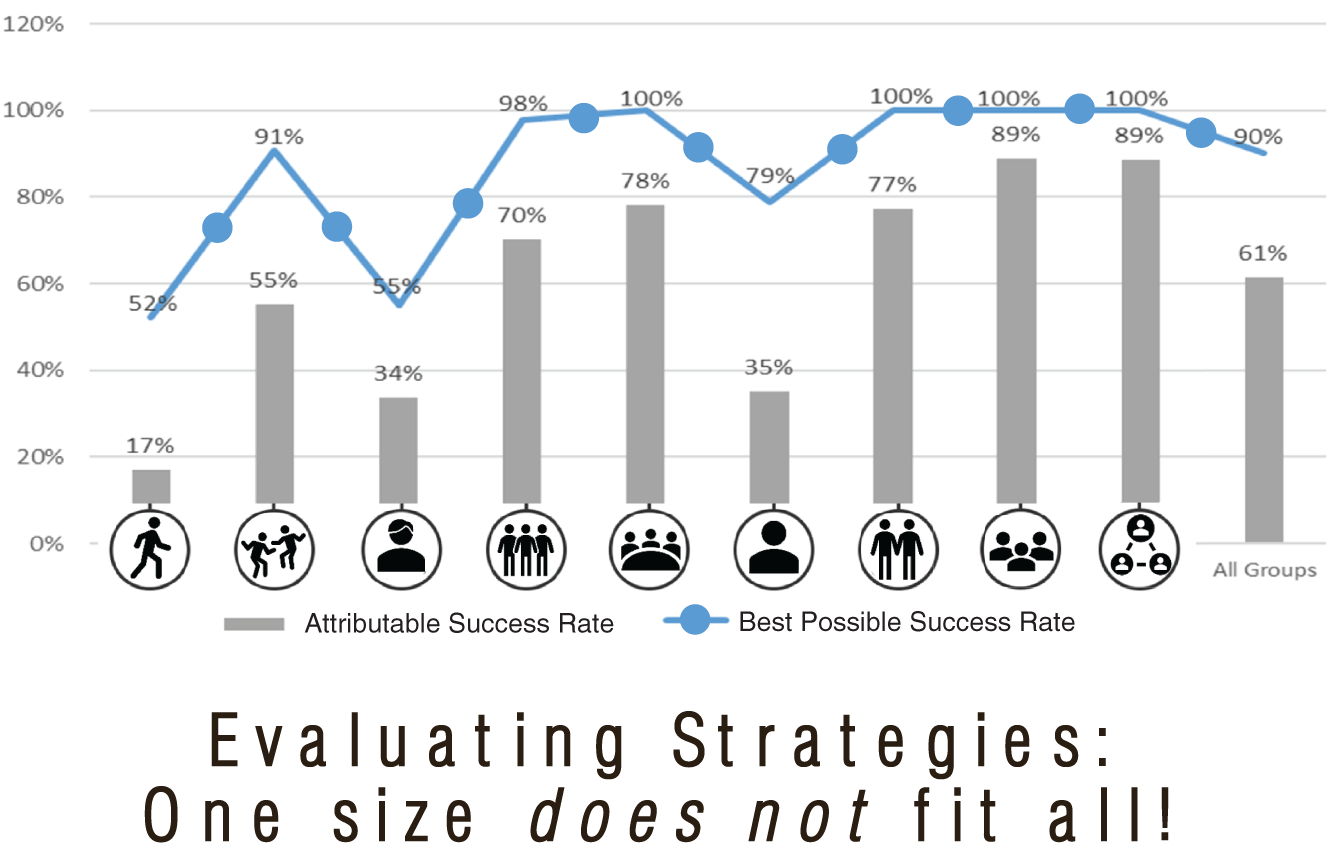
FIGURE 6.6 Equitable Analytics™ Results
Methodologically, Equitable Analytics™ can be applied to any number of desired outcomes including identifying the mix of strategies to maximize inclusion and belonging, increase intercultural competence, and achieve equity for every employee to advance and be promoted to the executive level, and much more. Ideologically, as you can clearly see from the preceding description, Equitable Analytics™ also embraces and espouses several tenets that should guide the responsible use of data analytics in DEI including machine learning, NLP, and other branches of AI. They include:4
- Causality: Understand What Causes, Not What is Correlated with a Desired Result or Outcome—Determine the root cause and effect for specific people and not the “average” person.
- Community: Ensure Diverse and Representative Stakeholder Engagement—Engage diverse and representative stakeholders directly in the process of developing logic models, theories of change, analytical frameworks, and algorithmic models. This helps to ensure that efforts reflect the lived experiences and are centered on the voices of those stakeholders who are likely to be impacted and what they consider to be beneficial to their needs.
- Equity: Remember, One Size Does Not Fit All—Use data analytics to disaggregate overall populations into matched comparison groups based on unique backgrounds, histories, and contexts. Exclude variables that should not be a factor in determining whether someone receives a strategy or intervention. Build models that produce tailored recommendations to each group's needs, maximizing each person's probability of success.
- Transparency: Choose Transparency over “Black Box” Opacity—Do not build algorithmic models whose inner workings or underlying assumptions cannot be explained, examined, or interrogated. For example, avoid the use of “black box” algorithms such as neural networks and deep learning algorithms (discussed further in the next section) that learn from data without being able to show how their conclusions were derived.
- Veracity: Seek the Unbiased Truth over Predictive Accuracy—When developing algorithms, prioritize the unbiased truth—a representation of what is fair and equitable—over predictive accuracy, that can advantage certain groups and disadvantage other groups.
Based on these principles and its seven‐step process, Equitable Analytics™ offers both an ideological and methodological vision for a more precise future of Data‐Driven DEI.
DEI and Deep Learning
The term neural networks refers to a branch of machine learning that loosely mimics the biological neurons and learning processes of the human brain. Neural networks are comprised of a series of algorithms that learn by endeavoring to recognize patterns in data. Artificial neurons represent levels of abstraction or layers in the neural network that perform basic to increasingly more complex pattern recognition. For example, a neural network to identify the numbers 0 through 9 might begin with a layer that identifies pixels as black or white, and then pass this information on to a subsequent layer that identifies different lines and curves, and then pass this information on to a final layer that identifies each number by its unique combination of lines and curves.
Deep learning refers to a process by which a neural network seeks to identify patterns or solve a problem through a never‐ending cycle of trial and error called “training” that strengthens its understanding of certain underlying relationships in data and weakens others leading to more complex understandings. The deeper the layers of the neural network, the deeper the learning. Deep learning has deep implications for the future of Data‐Driven DEI. Before I share these implications, I will provide brief background on a specific and growing genre of deep learning programs, large language models (LLMs), that have the deepest implications.
Large Language Models
Large language models (LLMs) are trained on massive data sets using natural language processing (NLP) and natural language understanding (NLU) to strive toward artificial general intelligence, or the ability of machines to learn or understand general tasks performed by human beings (which is yet to be achieved). NLP is a branch of AI that deals with the structure of human language. NLU analyzes the syntactic and semantic elements of text to derive meaning. Combining the use NLP and NLU can help identify patterns and meaning in unstructured data (i.e., raw text and narratives), such as the internet and its vast library of content, including articles, blogs, and social media posts, that would be difficult for a human to find. Unstructured data often contains powerful patterns within nuanced context, but these patterns go unnoticed because it is difficult for humans to process and make meaning from large amounts of text data. This is where LLMs, NLP, and NLU can offer mind‐blowing assistance.
Arguably, the most recognized LLM program is the Generative Pre‐Trained Transformer (GPT)5, and its associated chatbot, ChatGPT, by OpenAI, an AI research laboratory consisting of a for‐profit and parent nonprofit, whose mission is to ensure that artificial general intelligence benefits all of humanity. GPT is currently the largest LLM program, trained on 45 TB of text, but there is a growing list of others including GPT‐J, GPT‐NeoX, DeepMind, Google's BERT (Bidirectional Encoder Representations from Transformers), Facebook's BART (Bidirectional Auto‐Regressive Transformers), and DistilBERT, to name a few.
These programs have trained on content as vast as the internet (filtered), collections of digitized books, the entirety of Wikipedia, and more, to solve a single problem: predicting the next word in a text (you've experienced something comparable if your phone, computer, or search engine has offered suggestions to help complete a sentence while you are typing). The results are impressive to say the least.
LLM programs are able to produce original, coherent, often thoughtful, and well‐written paragraphs of prose in response to simple prompts. For example, here is what GPT produced in response to my prompt, “Write an essay that compares and contrasts diversity, equity and inclusion with racial equity”:
There are many ways to think about the relationship between diversity, equity and inclusion (DEI) and racial equity. Both DEI and racial equity are about ensuring that everyone has an opportunity to participate in and benefit from society. However, there are some important distinctions between the two.
DEI is about creating a society in which everyone can participate and feel included, regardless of their background. This includes things like making sure that people of all races, ethnicities, genders, sexual orientations, abilities and socioeconomic backgrounds have an equal opportunity to succeed.
Racial equity, on the other hand, is specifically about ensuring that people of all races have an equal opportunity to succeed. This includes things like addressing historical and current inequities that have put people of color at a disadvantage, as well as making sure that people of color have an equal voice in decisions that affect them.
Both DEI and racial equity are important for creating a just and fair society. However, racial equity is specifically focused on addressing the disparities that exist for people of color, while DEI is about creating an inclusive society for everyone.
I thought this was pretty good! Not only can GPT and other LLM programs create an essay in a fraction of a second, but they can produce an unlimited number of original essays in response to the same prompt (they can also produce poems, stories, computer code, and more), and the prompt can include more nuanced instructions such as a particular style or voice (i.e., “Write an essay … like a hip‐hop song”).
Large Language Models and DEI
LLMs will revolutionize DEI in several ways such as automatically, quickly, and accurately:
- Extracting key topics from large corpuses of documents via Automated Topic Modeling (ATM) based on Latent Dirichlet Allocation (LDA), a generative and statistical model of a collection of documents. This will aid significantly in extracting the key insights from libraries of DEI content such as articles, books, and reports.
- Coding and summarizing the themes from raw qualitative data such as IDI and focus group transcripts. This will make it considerably easier to incorporate qualitative data analysis into DEI assessment and evaluation.
- Converting text to different reading levels, styles, and tones. This will make DEI communications more broadly accessible to readers of various literacy abilities and preferences.
- Translating text in surveys, questionnaires, presentations, and reports into multiple languages, while capturing cultural nuances. This will make all DEI efforts more inclusive of different cultures.
- Generating reports, briefs, and executive summaries from DEI assessments and evaluations and tailoring them to different audiences. This will help amplify DEI storytelling.
With all of their power, potential, and promise, LLM programs, like all computer programs, must be governed and used in a proper ethical context that benefits humanity. This raises the question: What constitutes a benefit to humanity? In the New York Times Magazine article “A.I. is Mastering Language. Should We Trust What It Says?,” Steven Johnson asks related and important questions such as, “How do we train them to be good citizens? How do we make them ‘benefit humanity as a whole’ when humanity itself can't agree on basic facts, much less core ethics and civic values?”6 In the article, Tulsee Doshi of Google says that one of its principles is “making sure we're bringing in diversity of perspectives—so it's not just computer scientists sitting down and saying, ‘This is our set of values.’ How do we bring in sociology expertise? How do we bring in human rights and civil rights expertise? How do we bring in different cultural expertise, not just a Western perspective? And what we're trying to think through is how do we bring in expertise from outside the company. What would it look like to bring in community involvement? What would it look like to bring in other types of advisers?” While these are the right questions, the answers are yet to be found and must be vigorously sought after to safeguard the future of Data‐Driven DEI.
Under Peter York's leadership, we have an ever‐expanding range of experiences at BCT with deep learning including fine‐tuning LLM programs and developing and training NLP and NLU models to accomplish the kinds of tasks described earlier. Perhaps more importantly, we fully understand the importance and obligation to include safeguards against the improper use of any machine learning techniques, including NLP and NLU. When analyzing text using LLM programs, it is important to be aware of potential biases that may be present in the data. We therefore espouse several guiding principles to monitor for bias when using these models:
- Ensure diverse and representative stakeholder engagement including lived experience experts who have personal, authentic, and first‐hand experience within the context being modeled. This includes exposure to certain acts, experience with certain interventions (or lack thereof), and dealing with certain behaviors. As a result of these lived experiences, they are likely to produce richer insights and be more attuned to particular issues. For example, Listen4Good (listen4good.org) promotes high‐quality listening and equity‐driven feedback practices.
- Responsibly curate training data such that biased language and prejudiced views are not replicated.
- Examine the training/fine‐tuning data for any patterns or trends that could indicate bias. This includes looking at the distribution of data points, as well as the values of any features that could be used to identify a particular group of people (e.g., gender, race, etc.).
- Pay close attention to the results of the model to look for any patterns or trends that could indicate bias.
- Compare the results of the model to other models that have been trained on similar data. This can help to identify any potential biases that may be present in the data.
- Use human evaluation (such as subject matter and lived experience expertise) to examine the results of the model. This can be done by having people manually label a subset of the data, and then comparing the results of the model to the human labels. This can help to identify any potential biases that may be present in the data.
- Conduct a traditional algorithmic audit, to confirm that the model is doing what it is intended to do scientifically using test cases, and what Dr. Joy Buolamwini, founder of the Algorithmic Justice League, defines as an evocative audit, to examine the impact of the model on people emotionally based on their feedback. This is “an approach to humanizing the negative impacts that can result from algorithmic systems,”7 according to Dr. Buolamwini.
While I explicitly cautioned against the use of neural networks and deep learning algorithms in the previous section due to their lack of transparency—it is difficult to extract exactly how they do what they do—it's clear they are likely here to stay. Their proliferation must adhere to these principles. The diligence and rigor that is applied to training deep learning algorithms must be surpassed by the diligence and rigor of ensuring that myriad voices are reflected in how models are built, what is used for training data, and how the training takes place. This will signify more than just deep learning, but rather deep, diverse, equitable, and inclusive learning as the future of Data‐Driven DEI.
DEI and Transparency/Ubiquity
Throughout this book, I've made repeated references to transparency as a guiding principle that engenders trust and sets the tone for an organizational DEI journey. Interestingly, a growing cadre of tools are no longer making transparency the exception but rather the norm by providing three types of insights:
- Personal Dynamics—Tools such as Overtly and Atlas integrate directly with internal systems such as e‐mail, calendars, chat, and other collaboration tools to examine patterns of collaboration and information sharing through a DEI lens. They can therefore leverage NLP, NLU, organizational network analysis (ONA), and interpretive visualizations to explore the nature of the interactions between people and informal networks within an organization. These tools can uncover personal dynamics such as who, how often, in what ways, and about what topics people interact with others (and who, how often, in what ways, and on what topics people do not interact with others), thus identifying personal preferences and biases at a much deeper level.
- Group Discussions and Decision Making—Tools such as ThoughtExchange, Fishbowl, PopIn, and Converge enable large groups of people to have anonymous and simultaneous discussions about topics, thoughts, and ideas in a transparent and trusted place. These can also be used to crowdsource conversations on DEI initiatives such as giving, recruitment, outreach, and partnerships. They can empower voices and enable buy‐in from the bottom up, thus leveraging input from hundreds and even thousands of people simultaneously. They also support some or all of the following features: peer‐to‐peer ratings that mitigate bias by rating ideas on their merit and not who is sharing or endorsing them; transparent decision making, prioritization, and alignment; and organizing and ranking responses according to the most important thoughts and ideas using machine learning and other techniques.
- Organizational Dynamics—Tools such as Comparably and Glassdoor are making organizational cultures, climates, and compensation visible to the public. In a similar manner to online customer ratings of products and services, these tools provide insight to organizational dynamics such as strengths, areas for improvement, institutional barriers, and inequities. In doing so, they facilitate greater transparency and can lead to greater accountability.
As these tools become more ubiquitous and it is less obvious that personal data is being collected, analyzed, publicized, and used to make decisions, it will become increasingly important that explicit prior permission (opt‐in) is obtained from users for any data collection, so they can make informed decisions, and the data is collected in a safe and ethical way. For example, in Europe “consent must be freely given, specific, informed and unambiguous through a clear affirmative action, which means that pre‐checked boxes or other types of implied consent is not sufficient. The recipient must also be told exactly how their data will be used. Senders must keep evidence of the consent and provide proof if challenged.”8 As another example, Streamlytics, a next‐generation data ecosystem, provides “safe and ethical access to accurate consumer activity from all aspects of their lives.” Data is currency. It has value. People must be fully informed about how their data is being used—how their currency is being spent—as we move toward a more transparent future of Data‐Driven DEI.
DEI Integrated Platforms
At BCT, we envision and are working toward a future where a single platform can integrate all DEI functions such as assessment, planning, learning, development, reporting, evaluation, and more. The entire Data‐Driven DEI five‐step cycle will be captured:
- Step 1: DEI Inventory—Administer and/or upload the results of any individual and/or organizational DEI assessment, independent of the vendor.
- Step 2: DEI Imperatives—Capture and track the objectives and goals of any individual and/or organizational DEI program while leveraging a library of DEI metrics and KPIs.
- Step 3: DEI Insights—Access and library of individual and/or organizational DEI best practices and leverage Equitable Analytics™ to predict and prescribe what works for an individual, team, department, division, and so on, to optimize their desired outcomes.
- Step 4: DEI Initiatives—Capture and track the strategies and measures of any individual and/or organizational DEI program while leveraging a library of DEI metrics and KPIs.
- Step 5: DEI Impact—Manage data and generate reports, scorecards, and dashboards that gauge progress, determine impact, engender accountability, evaluate results, and generate findings for individuals and/or organizations and comprehensively demonstrate DEI outputs and outcomes.
In doing so, the DEI integrated platform will also centralize DEI data including assessment data, experience data, HR data, output data, and outcomes data, which often reside in disparate and siloed data systems such as an HRIS, ERP, CRM, and LMS. By integrating DEI functions and integrating DEI data, the platform will paint a hyper‐personalized picture of DEI for people and a comprehensive picture of DEI for organizations: What is the optimal learning and development pathway for an individual to increase diversity? What are the optimal KSAs for an individual to foster inclusivity? What are the optimal activities such as mentorship, sponsorship, and allyship for an individual to foster equitable outcomes?
This vision is rooted in the science of the individual and the belief that, according to Todd Rose in The End of Average: How We Succeed in a World That Values Sameness,9 “If we want a society where each of us has the same chance to live up to our full potential, then we must create professional, educational, and social institutions that are responsive to individuality.” Rose espouses three guiding principles of individuality:
- The Jaggedness Principle—Any meaningful human characteristic, including DEI preferences and competences, consists of multiple dimensions that are complex and jagged. To understand something that is jagged, we must apply multi‐dimensional thinking.
- The Context Principle—Individual behavior cannot be explained or understood apart from the context, situation, and circumstances of the individual. To understand a person, you must understand how they behave under context‐specific circumstances.
- The Pathways Principle—There is no single, “normal” pathway for any type of human learning and development. There are several, equally valid pathways, and individuality determines the unique and optimal pathway for any individual as well as the pace and sequence of that pathway.
As I've said before, organizations don't change. People change. These individual principles are therefore useful in guiding the future of Data‐Driven DEI for both people and organizations. They also expand upon BCT's vision for a DEI integrated platform that will support personal and organizational transformation via a library of DEI learning journeys, Microcommitments, VR immersions, and more, that are all adaptive, personalized, and tailored to the unique preferences and competences of people and the unique people, practices, and policies of an organization.
There is a growing number of DEI integrated platforms that begin to approximate this vision including Kanarys, Mathison, Co:Census, GlobeSmart, OpenSesame, Blueprint Strategy Platform, Included.ai, MESH Diversity, and Emprising™, but none of them fully encompass all pieces of this futuristic puzzle. BCT has begun to bring this vision to reality through our Equitable Analytics™, which helps determine the optimal mix of strategies and interventions for individuals and/or organizations, our Through My Eyes™ VR immersions, and our partnerships with Rali's Change Experience Platform (CxP), Intrinsic Inclusion™, and The Inclusion Habit®. Together, they provide an integrated suite of methods and features that can optimize personal and organizational impact by applying multi‐dimensional thinking, context‐specific understanding, and a unique pace and sequence for DEI pathways and journeys that represent the future of individualized Data‐Driven DEI.
DEI and DNA
Throughout this book, I have tried to show how data can be used in an efficient, effective, and ethical way along with the tools and metrics to improve your personal and organizational DEI journey. In addition to five specific steps and a plethora of tools and metrics, I have outlined several principles to guide the present and safeguard the future of Data‐Driven DEI. With this roadmap as both an anchor for grounding and a compass for guidance, I place my hope in what lies before us, and I place my faith in what lies within us.
As I stated in the introduction, our world is increasingly comprised of “communities of the like‐minded.” Far too often, we surround ourselves and associate with people who are like us—people who share the same values, beliefs, race/ethnicity, religion, socioeconomic status, political affiliation, and other identifiers, as ourselves. As a result, we are increasingly less likely to befriend people who are not like us, which only leads to greater division and misunderstanding. DEI represents a unique and unparalleled opportunity to break down the walls that can separate us in our personal lives, within our organizations, and throughout our society. While I firmly believe that Data‐Driven DEI is a means to these ends, I once again acknowledge that data is not a panacea to DEI; it is simply a tool. What ultimately makes the difference is you and the intentional steps you take to move beyond your comfort zone into your growth zone; be a bridge between people that would otherwise remain separated; and get comfortable with being uncomfortable. The true solution to a better tomorrow is what lies within you today.
I have often said to people that the ultimate objective is to make DEI a part of your DNA. In other words, your overarching aim is that the five‐step, never‐ending, continuous cycle of Data‐Driven DEI becomes a natural part of who you are and what you do. Inasmuch as DNA is the hereditary materials in humans, I now say to people that the ultimate objective is to also make our DNA a part of DEI. In other words, our overarching aim is that our humanity, empathy, and service to one another remain first and foremost and are fully embedded in any DEI tools and techniques, methodologies and technologies, platforms and programs, and deep learning algorithms and databases. That is, a future of DEI that is certainly driven by data, but is fundamentally centered on love, benefits all of humanity, and unites us as a people.
Notes
- 1. Judea Pearl, The Book of Why: The New Science of Cause and Effect (New York: Basic Books, 2018).
- 2. https://whorulesamerica.ucsc.edu/power/diversity_update_2020.html
- 3. Cathy O'Neil, Weapons of Math Destruction: How Big Data Increases Inequality and Threatens Democracy (New York: Broadway Books, 2016).
- 4. Peter York, Unlocking Real‐Time Evidence for Practitioners: How Evaluation and Data Analytics Are Generating On‐Demand, Actionable Evidence for Front‐Line Practitioners at First Place for Youth and Gemma Services (Project Evident and the Bill and Melinda Gates Foundation, 2021).
- 5. As of this publication, the latest version is GPT‐3.
- 6. https://www.nytimes.com/2022/04/15/magazine/ai-language.html
- 7. https://www.media.mit.edu/events/joy-buolamwini-defense/
- 8. https://www.lsoft.com/resources/optinlaws.asp
- 9. Todd Ross, The End of Average: How We Succeed in a World That Values Sameness (New York: HarperOne, 2016).