
Saving Platform Results in Journals
Save platform reports for future viewing by creating a journal of the report window. The journal is a copy of the report window. You can edit or append additional reports to an existing journal. The journal is not connected to the data table. A journal is an easy way to save the results from several report windows in a single report window that you can share with others.
Example: Creating a Journal
Create and Modify a Report and Save It to a Journal
1. Select Help > Sample Data Library and open Companies.jmp.
2. Select Analyze > Distribution.
3. Select both Type and Size Co and click Y, Columns.
4. Click OK.
5. From the red triangle menu for Type, select Histogram Options > Show Counts.
6. From the red triangle menu for Size Co, select Mosaic Plot.
7. Select Edit > Journal to journal these results. The results are duplicated in a journal window.
Figure 6.2 Journal of Distribution Results
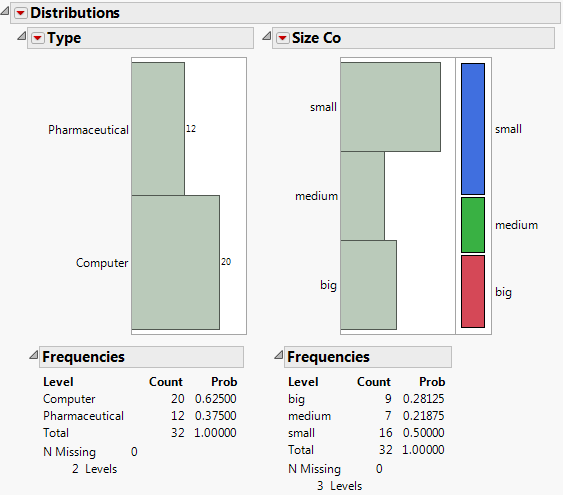
The results in the journal are not connected to the data table. In the Type bar chart, if you click on the Computer bar, no rows are selected in the data table.
Since the journal is a copy of your results, most of the red triangle menus do not exist. A journal does have a red triangle menu for each new report that you add to the journal. This menu has two options:
Rerun in new window
If you have the original data table that was used to create the original report, this option runs the analysis again. The result is a new report window.
Edit Script
This option opens a script window that contains a JSL script to recreate the analysis. JSL is a more advanced topic that is covered in the Scripting Guide.
Adding Additional Analyses
If you perform another analysis, you can add the results of the analysis to the existing journal.
1. With a journal open, select Analyze > Distribution.
2. Select profit/emp and click Y, Columns.
3. Click OK.
4. Select Edit > Journal. The results are appended to the bottom of the journal.
Creating Projects
Save multiple JMP file types (such as data tables, reports, journals, and scripts) in a single file by creating a project. The project file contains all the information needed to re-open all of the included files.
Example: Creating a Project
Create a Report
1. Select Help > Sample Data Library and open Companies.jmp.
2. Select Analyze > Distribution.
3. Select Profits ($M) and profit/emp, and click Y, Columns.
4. Click OK.
Create a Project and Add the Data Table and the Report to It
1. To start a new project, select File > New > Project. A new project appears in the Home Window.
Figure 6.3 Initial Project Window on Windows

2. Right-click the project (Untitled) and select Rename, and then enter a new name (Finance).
3. To add the Distribution results to the project, right-click on the project name and select Add Window.
4. In the Add Windows to Project window, select the Distribution results.
5. Click OK. The Distribution results are added to the project.
6. To add the Companies.jmp data table to the project, repeat step 3 and select the Companies data table from the window.
7. Click OK. The data table is added to the project.
Figure 6.4 The Final Project

You can double-click on the links in the project to open the data table and recreate the Distribution results.
Using Scripts
Everything in JMP is scriptable, meaning that any action that you perform can be saved as a JMP Scripting Language (JSL) script. You can use a script to reproduce your actions or results at any time.
Example: Saving and Running a Script
Create a Report
1. Select Help > Sample Data Library and open Companies.jmp.
2. Select Analyze > Distribution.
3. Select Type and profit/emp and click Y, Columns.
4. Click OK.
5. From the red triangle menu for Type, select these options:
‒ Histogram Options > Show Counts
‒ Confidence Interval > 0.95
6. From the red triangle menu for profit/emp, select these options:
‒ Outlier Box Plot, to remove the outlier box plot
‒ CDF Plot
7. From the red triangle menu for Distributions, select Stack.
Save the Script to the Data Table and Run It
1. To save this analysis, select Script > Save Script to Data Table from the red triangle menu for Distributions. The Distribution script appears in the Table panel.
Figure 6.5 Distribution Script
2. Close the Distribution report window.
3. To recreate the analysis, select Run Script from the red triangle menu for the Distribution script.
Figure 6.6 Running the Distribution Script

About Scripts and JSL
The script that you saved in this section contains JMP Scripting Language (JSL) commands. JSL is a more advanced topic that is covered in the Scripting Guide.
Saving as Interactive HTML
Interactive HTML enables JMP users to share reports that contain dynamic graphs so that even non JMP users can explore the data. The JMP report is saved as a web page in HTML 5 format, which you can e-mail to users or publish on a website. Users then explore the data as they would in JMP.
Interactive HTML provides a subset of features from JMP:
• Explore interactive graph features, such as selecting histogram bars and viewing data values.
• View data by brushing.
• Show or hide report sections.
• Place your cursor over the report for tooltips.
• Increase the marker size.
Figure 6.7 Brushing Data in Interactive HTML
Many changes that you make to the graphs, such as ordered variables, horizontal histograms, background colors, and colored data points, are saved in the web page. Graphs and tables that are closed when you save the content remain closed on the web page until the user opens them.
Interactive HTML Contains Data
When you save reports as interactive HTML in JMP, your data are embedded in the HTML. The content is unencrypted, because web browsers cannot read encrypted data. To avoid sharing sensitive data, save your results as a non-interactive web page. (Select File > Save As > HTML File on Windows, or File > Export > HTML on Macintosh.)
Example: Create Interactive HTML
Create a Report
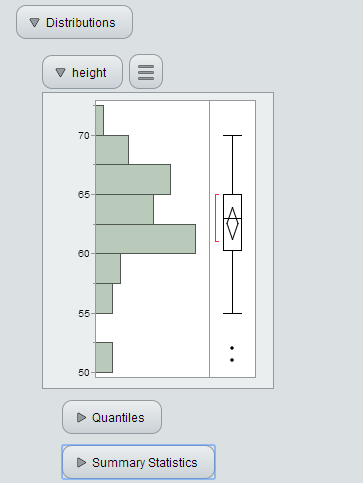
1. Select Help > Sample Data Library and open Big Class.jmp.
2. Select Analyze > Distribution.
3. Select height and click Y, Columns.
4. Click OK.
Save as Interactive HTML
1. On Windows, select File > Save As and select Interactive HTML with Data from the Save as type list. On Macintosh, select File > Export > Interactive HTML with Data.
2. Name and save the file (or export on Macintosh).
The output appears in your default browser.
Figure 6.8 Interactive HTML Output
For information about exploring interactive HTML output, visit http://www.jmp.com/support/help/InteractiveHTML/ShareJMPReports.shtml.
Saving as a PowerPoint Presentation
Create a presentation by saving JMP results as a Microsoft PowerPoint presentation (.pptx). Rearrange JMP content and edit text in PowerPoint after saving as a .pptx file. Sections of a JMP report are exported into PowerPoint differently.
• Report headings are exported as editable text boxes.
• Graphs are exported as images. Certain graphical elements, such as legends, are exported as separate images. Images resize to fit the slide in PowerPoint.
Use the selection tool to select the sections that you want to save in your presentation. Delete unwanted content once after you open the file in PowerPoint.
1. In JMP, create the report.
2. On Windows, select File > Save As and select PowerPoint Presentation from the Save as type list. On Macintosh, select File > Export > Microsoft PowerPoint.
3. Select a Graphics File Format from the list. On Windows, EMF is the default format. (PDF is the default format on Macintosh.)
Note: The native EMF graphics produced on Windows are not supported on Macintosh. The native PDF graphics produced on Macintosh are not supported on Windows. For cross-platform compatibility, change the default graphics file format by selecting File > Preferences > General. Then, change the Image Format for PowerPoint to either PNG or JPEG graphic format.
4. Name and save the file.
Note: You must include the .pptx extension in the output filename.
After you save, the file opens in Microsoft PowerPoint if PowerPoint is installed on your machine.
PowerPoint presentations use the default JMP template. You can use a custom template by overwriting the default template file. See Using JMP for more information.
Creating Adobe Flash Versions of the Profiler, Bubble Plot, or Distribution Platforms
To share the interactive results of a profiler, bubble plot, or distribution outside of JMP, you can export a SWF file and use the Adobe Flash Player to view it. You can import the SWF file into presentations and applications. You can also save the results as an HTML page with the SWF output embedded.
Example: Saving an Adobe Flash Version of a Bubble Plot
Create a Bubble Plot in JMP
1. Select Help > Sample Data Library and open PopAgeGroup.jmp.
2. Select Graph > Bubble Plot.
3. Select Portion60+ and click Y.
4. Select Portion 0-19 and click X.
5. Select Country and click ID.
6. Select Year and click Time.
7. Select Pop and click Sizes.
8. Select Region and click Coloring.
9. Click OK.
Figure 6.9 Initial Bubble Plot

Save the Bubble Plot as a .SWF File
1. Select Save for Adobe Flash Platform (SWF) from the red triangle menu.
2. In the Save As SWF window, select the location to which you want to save the file.
3. Click Save. The Adobe Flash version of the Bubble Plot is saved as HTML and appears in a web browser.
Figure 6.10 Adobe Flash Version of Bubble Plot

Additional Information
The JMP website has additional information about the following:
• more details about Adobe Flash versions of the Profiler, Bubble Plot, and Distribution platforms
• instructions on importing the Adobe Flash versions into Microsoft PowerPoint
This information is on the JMP website here:
..................Content has been hidden....................
You can't read the all page of ebook, please click here login for view all page.