
In this chapter
Deployment diagrams are one of the two kinds of diagrams used in modeling the physical aspects of an object-oriented system. A deployment diagram shows the configuration of run time processing nodes and the artifacts that live on them.
You use deployment diagrams to model the static deployment view of a system. For the most part, this involves modeling the topology of the hardware on which your system executes. Deployment diagrams are essentially class diagrams that focus on a system's nodes.
Deployment diagrams are not only important for visualizing, specifying, and documenting embedded, client/server, and distributed systems, but also for managing executable systems through forward and reverse engineering.
When you create a software-intensive system, your main focus as a software developer is on architecting and deploying its software. However, as a systems engineer, your main focus is on the system's hardware and software and in managing the trade-offs between the two. Whereas software developers work with somewhat intangible artifacts, such as models and code, system developers work with quite tangible hardware as well.
The UML is primarily focused on facilities for visualizing, specifying, constructing, and documenting software artifacts, but it's also designed to address hardware artifacts. This is not to say that the UML is a general-purpose hardware description language like VHDL. Rather, the UML is designed to model many of the hardware aspects of a system sufficient for a software engineer to specify the platform on which the system's software executes and for a systems engineer to manage the system's hardware/software boundary. In the UML, you use class diagrams and artifact diagrams to reason about the structure of your software. You use sequence diagrams, collaboration diagrams, state diagrams, and activity diagrams to specify the behavior of your software. At the edge of the your system's software and hardware, you use deployment diagrams to reason about the topology of processors and devices on which your software executes.
With the UML, you use deployment diagrams to visualize the static aspect of these physical nodes and their relationships and to specify their details for construction, as in Figure 31-1.
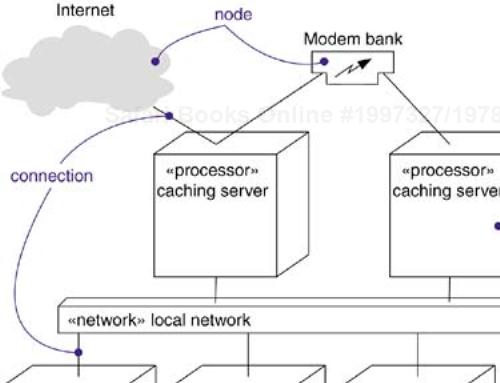
A deployment diagram is a diagram that shows the configuration of run time processing nodes and the artifacts that live on them. Graphically, a deployment diagram is a collection of vertices and arcs.
A deployment diagram is just a special kind of diagram and shares the same common properties as all other diagrams—a name and graphical contents that are a projection into a model. What distinguishes a deployment diagram from all other kinds of diagrams is its particular content.
Deployment diagrams commonly contain
Like all other diagrams, deployment diagrams may contain notes and constraints. Deployment diagrams may also contain artifacts, each of which must live on some node. Deployment diagrams may also contain packages or subsystems, both of which are used to group elements of your model into larger chunks. Sometimes, you'll want to place instances in your deployment diagrams, as well, especially when you want to visualize one instance of a family of hardware topologies.
You use deployment diagrams to model the static deployment view of a system. This view primarily addresses the distribution, delivery, and installation of the parts that make up the physical system.
There are some kinds of systems for which deployment diagrams are unnecessary. If you are developing a piece of software that lives on one machine and interfaces only with standard devices on that machine that are already managed by the host operating system (for example, a personal computer's keyboard, display, and modem), you can ignore deployment diagrams. On the other hand, if you are developing a piece of software that interacts with devices that the host operating system does not typically manage or that is physically distributed across multiple processors, then using deployment diagrams will help you reason about your system's software-to-hardware mapping.
When you model the static deployment view of a system, you'll typically use deployment diagrams in one of three ways.
To model embedded systems
An embedded system is a software-intensive collection of hardware that interfaces with the physical world. Embedded systems involve software that controls devices such as motors, actuators, and displays and that, in turn, is controlled by external stimuli such as sensor input, movement, and temperature changes. You can use deployment diagrams to model the devices and processors that comprise an embedded system.
To model client/server systems
A client/server system is a common architecture focused on making a clear separation of concerns between the system's user interface (which lives on the client) and the system's persistent data (which lives on the server). Client/server systems are one end of the continuum of distributed systems and require you to make decisions about the network connectivity of clients to servers and about the physical distribution of your system's software artifacts across the nodes. You can model the topology of such systems by using deployment diagrams.
To model fully distributed systems
At the other end of the continuum of distributed systems are those that are widely, if not globally, distributed, typically encompassing multiple levels of servers. Such systems are often hosts to multiple versions of software artifacts, some of which may even migrate from node to node. Crafting such systems requires you to make decisions that enable the continuous change in the system's topology. You can use deployment diagrams to visualize the system's current topology and distribution of artifacts to reason about the impact of changes on that topology.
Developing an embedded system is far more than a software problem. You have to manage the physical world in which there are moving parts that break and in which signals are noisy and behavior is nonlinear. When you model such a system, you have to take into account its interface with the real world, and that means reasoning about unusual devices as well as nodes.
Deployment diagrams are useful in facilitating the communication between your project's hardware engineers and software developers. By using nodes that are stereotyped to look like familiar devices, you can create diagrams that are understandable by both groups. Deployment diagrams are also helpful in reasoning about hardware/software trade-offs. You'll use deployment diagrams to visualize, specify, construct, and document your system engineering decisions.
To model an embedded system,
Identify the devices and nodes that are unique to your system.
Provide visual cues, especially for unusual devices, by using the UML's extensibility mechanisms to define system-specific stereotypes with appropriate icons. At the very least, you'll want to distinguish processors (which contain software artifacts) and devices (which, at that level of abstraction, don't contain software that you write).
Model the relationships among these processors and devices in a deployment diagram. Similarly, specify the relationship between the artifacts in your system's implementation view and the nodes in your system's deployment view.
As necessary, expand on any intelligent devices by modeling their structure with a more detailed deployment diagram.
For example, Figure 31-2 shows th hardware for a simple autonomous robot. You'll find one node (Pentium motherboard) stereotyped as a processor. Surrounding this node are eight devices, each stereotyped as a device and rendered with an icon that offers a clear visual cue to its real-world equivalent.
The moment you start developing a system whose software no longer resides on a single processor, you are faced with a host of decisions: How do you best distribute your software artifacts across these nodes? How do they communicate? How do you deal with failure and noise? At one end of the spectrum of distributed systems, you'll encounter client/server systems in which there's a clear separation of concerns between the system's user interface (typically managed by the client) and its data (typically managed by the server).
There are many variations on this theme. For example, you might choose to have a thin client, meaning that it has a limited amount of computational capacity and does little more than manage the user interface and visualization of information. Thin clients may not even host a lot of artifacts but, rather, may be designed to load artifacts from the server, as needed, as with Enterprise Java Beans. On the other hand, you might chose to have a thick client, meaning that it has a goodly amount of computational capacity and does more than just visualization. A thick client typically carries out some of the system's logic and business rules. The choice between thin and thick clients is an architectural decision that's influenced by a number of technical, economic, and political factors.
Either way, partitioning a system into its client and server parts involves making some hard decisions about where to physically place its software artifacts and how to impose a balanced distribution of responsibilities among those artifacts. For example, most management information systems are essentially three-tier architectures, which means that the system's GUI, business logic, and database are physically distributed. Deciding where to place the system's GUI and database are usually fairly obvious, so the hard part lies in deciding where the business logic lives.
You can use the UML's deployment diagrams to visualize, specify, and document your decisions about the topology of your client/server system and how its software artifacts are distributed across the client and server. Typically, you'll want to create one deployment diagram for the system as a whole, along with other, more detailed diagrams that drill down to individual segments of the system.
To model a client/server system,
Identify the nodes that represent your system's client and server processors.
Highlight those devices that are germane to the behavior of your system. For example, you'll want to model special devices, such as credit card readers, badge readers, and display devices other than monitors, because their placement in the system's hardware topology are likely to be architecturally significant.
Provide visual cues for these processors and devices via stereotyping.
Model the topology of these nodes in a deployment diagram. Similarly, specify the relationship between the artifacts in your system's implementation view and the nodes in your system's deployment view.
For example, Figure 31-3 shows ttopology of a human resources system, which follows a classical client/server architecture. This figure illustrates the client/server split explicitly by using the packages named client and server. The client package contains two nodes (console and kiosk), both of which are stereotyped and are visually distinguishable. The server package contains two kinds of nodes (caching server and server), and both of these have been adorned with some of the artifacts that reside on each. Note also that caching server and server are marked with explicit multiplicities, specifying how many instances of each are expected in a particular deployed configuration. For example, this diagram indicates that there may be two or more caching servers in any deployed instance of the system.
Distributed systems come in many forms, from simple two-processor systems to those that span many geographically dispersed nodes. The latter are typically never static. Nodes are added and removed as network traffic changes and processors fail; new and faster communication paths may be established in parallel with older, slower channels that are eventually decommissioned. Not only may the topology of these systems change, but the distribution of their software artifacts may change as well. For example, database tables may be replicated across servers, only to be moved as traffic dictates. For some global systems, artifacts may follow the sun, migrating from server to server as the business day begins in one part of the world and ends in another.
Visualizing, specifying, and documenting the topology of fully distributed systems such as these are valuable activities for the systems administrator who must keep tabs on an enterprise's computing assets. You can use the UML's deployment diagrams to reason about the topology of such systems. When you document fully distributed systems using deployment diagrams, you'll want to expand on the details of the system's networking devices, each of which you can represent as a stereotyped node.
To model a fully distributed system,
Identify the system's devices and processors as for simpler client/server systems.
If you need to reason about the performance of the system's network or the impact of changes to the network, model these communication devices to a level of detail sufficient to make these assessments.
Pay close attention to logical groupings of nodes, which you can specify by using packages.
Model these devices and processors using deployment diagrams. Where possible, use tools that discover the topology of your system by walking your system's network.
If you need to focus on the dynamics of your system, introduce use case diagrams to specify the kinds of behavior you are interested in, and expand on these use cases with interaction diagrams.
Note
When modeling a highly distributed system, it's common to reify the network itself as an node. For example, the Internet might be represented as a node (as in Figure 31-1, shown a a stereotyped node). You can also reify a local area network (LAN) or wide-area network (WAN) in the same way (as in Figure 31-1). In eac- case, you can use the node's attributes and operations to capture properties about the network.
Figure 31-4 shows ttopology of a particular configuration of a fully distributed system. This particular deployment diagram is also an object diagram, for it contains only instances. You can see three consoles (anonymous instances of the stereotyped node console), which are linked to the Internet (clearly a singleton node). In turn, there are three instances of regional servers, which serve as front ends of country servers, only one of which is shown. As the note indicates, country servers are connected to one another, but their relationships are not shown in this diagram.
In this diagram, the Internet has been reified as a stereotyped node.
There's only a modest amount of forward engineering (the creation of code from models) that you can do with deployment diagrams. For example, after specifying the physical distribution of artifacts across the nodes in a deployment diagram, it is possible to use tools that then push these artifacts out to the real world. For system administrators, using the UML in this way helps you visualize what can be a very complicated task.
Reverse engineering (the creation of models from code) from the real world back to deployment diagrams is of tremendous value, especially for fully distributed systems that are under constant change. You'll want to supply a set of stereotyped nodes that speak the language of your system's network administrators to tailor the UML to their domain. The advantage of using the UML is that it offers a standard language that addresses not only their needs, but the needs of your project's software developers as well.
To reverse engineer a deployment diagram,
Choose the target that you want to reverse engineer. In some cases, you'll want to sweep across your entire network; in others, you can limit your search.
Choose also the fidelity of your reverse engineering. In some cases, it's sufficient to reverse engineer just to the level of all the system's processors; in others, you'll want to reverse engineer the system's networking peripherals as well.
Use a tool that walks across your system, discovering its hardware topology. Record that topology in a deployment model.
Along the way, you can use similar tools to discover the artifacts that live on each node, which you can also record in a deployment model. You'll want to use an intelligent search, for even a basic personal computer can contain gigabytes of artifacts, many of which may not be relevant to your system.
Using your modeling tools, create a deployment diagram by querying the model. For example, you might start with visualizing the basic client/server topology, then expand on the diagram by populating certain nodes with artifacts of interest that live on them. Expose or hide the details of the contents of this deployment diagram as necessary to communicate your intent.
When you create deployment diagrams in the UML, remember that every deployment diagram is just a graphical presentation of the static deployment view of a system. This means that no single deployment diagram need capture everything about a system's deployment view. Collectively, all the deployment diagrams of a system represent the system's complete static deployment view; individually, each represents just one aspect.
A well-structured deployment diagram
Focuses on communicating one aspect of a system's static deployment view.
Contains only those elements that are essential to understanding that aspect.
Provides detail consistent with its level of abstraction; expose only those adornments that are essential to understanding.
Is not so minimalist that it misinforms the reader about important semantics.
When you draw a deployment diagram,
Give it a name that communicates its purpose.
Lay out its elements to minimize lines that cross.
Organize its elements spatially so that things that are semantically close are laid out physically close.
Use notes and color as visual cues to draw attention to important features of your diagram.
Use stereotyped elements carefully. Choose a small set of common icons for your project or organization, and use them consistently.