
Chapter 5. Interpreting Extended SQL Trace Data
To succeed, a performance analyst must understand the language in which a system communicates information about its performance. Unfortunately, for over a decade, the domain of Oracle time statistics has been one of the most misunderstood areas of the Oracle kernel. To understand the response time instrumentation that the Oracle kernel provides, you must understand how the Oracle kernel interacts with its host operating system. It is this operating system that allocates resources to the Oracle kernel process itself, and it is the operating system that actually supplies the timing statistics that Oracle uses to describe its own performance.
Trace File Walk-Through
I believe that the best way to begin the study of Oracle operational data is with a tour of Oracle’s extended SQL trace output. SQL trace output is unsurpassed as an educational and diagnostic aid, because it presents a linear sequential recorded history of what the Oracle kernel does in response to an application’s demands upon the database.
The SQL trace feature has been a part of the Oracle kernel since Version 6, which should be older than any version of Oracle that you are currently running. In 1992, with the release of the kernel Version 7.0.12, Oracle Corporation significantly enhanced the value of SQL trace data by adding information about the durations of non-CPU-consuming instructions that the Oracle kernel executes.
Let’s begin our study with the “Hello, world” of Oracle response time data. Example 5-1 shows one of the simplest SQL*Plus sessions you can run. The session activates the extended SQL trace mechanism for itself. It then queries the string “Hello, world; today is sysdate" from the database and exits.
alter session set max_dump_file_size=unlimited;
alter session set timed_statistics=true;
alter session set events '10046 trace name context forever, level 12';
select 'Hello, world; today is '||sysdate from dual;
exit;
The trace file shown in Example 5-2 reveals the sequence of actions the Oracle kernel performed on behalf of this session. If you’ve learned to view SQL trace data only through the lens of Oracle’s tkprof, then you’re in for a treat. By upgrading your understanding of extended SQL trace data in the raw, you’ll earn the ability to diagnose more classes of performance problem than can be detected with tkprof alone. After becoming fluent with raw trace data, many analysts are surprised by how many deficiencies they find in tkprof.
/u01/oradata/admin/V901/udump/ora_9178.trc
Oracle9i Enterprise Edition Release 9.0.1.0.0 - Production
With the Partitioning option
JServer Release 9.0.1.0.0 - Production
ORACLE_HOME = /u01/oradata/app/9.0.1
System name:    Linux
Node name:  research
Release:    2.4.4-4GB
Version:    #1 Fri May 18 14:11:12 GMT 2001
Machine:    i686
Instance name: V901
Redo thread mounted by this instance: 1
Oracle process number: 9
Unix process pid: 9178, image: oracle@research (TNS V1-V3)

*** SESSION ID:(7.6692) 2002-12-03 10:07:40.051
APPNAME mod='SQL*Plus' mh=3669949024 act='' ah=4029777240
= = = = = = = = = = = = = = = = = = = = =
PARSING IN CURSOR #1 len=69 dep=0 uid=5 oct=42 lid=5 tim=1038931660052098 hv=1509700594
ad='50d6d560'
alter session set events '10046 trace name context forever, level 12'
END OF STMT
EXEC #1:c=0,e=1,p=0,cr=0,cu=0,mis=0,r=0,dep=0,og=4,tim=1038931660051673
WAIT #1: nam='SQL*Net message to client' ela= 5 p1=1650815232 p2=1 p3=0
WAIT #1: nam='SQL*Net message from client' ela= 1262 p1=1650815232 p2=1 p3=0
= = = = = = = = = = = = = = = = = = = = =
PARSING IN CURSOR #1 len=51 dep=0 uid=5 oct=3 lid=5 tim=1038931660054075 hv=1716247018
ad='50c551f8'
select 'Hello, world; today is '||sysdate from dual
END OF STMT
PARSE #1:c=0,e=214,p=0,cr=0,cu=0,mis=0,r=0,dep=0,og=4,tim=1038931660054053
BINDS #1:
EXEC #1:c=0,e=124,p=0,cr=0,cu=0,mis=0,r=0,dep=0,og=4,tim=1038931660054311
WAIT #1: nam='SQL*Net message to client' ela= 5 p1=1650815232 p2=1 p3=0
FETCH #1:c=0,e=177,p=0,cr=1,cu=2,mis=0,r=1,dep=0,og=4,tim=1038931660054596
WAIT #1: nam='SQL*Net message from client' ela= 499 p1=1650815232 p2=1 p3=0
FETCH #1:c=0,e=2,p=0,cr=0,cu=0,mis=0,r=0,dep=0,og=0,tim=1038931660055374
WAIT #1: nam='SQL*Net message to client' ela= 4 p1=1650815232 p2=1 p3=0
WAIT #1: nam='SQL*Net message from client' ela= 1261 p1=1650815232 p2=1 p3=0
STAT #1 id=1 cnt=1 pid=0 pos=0 obj=221 op='TABLE ACCESS FULL DUAL '
XCTEND rlbk=0, rd_only=1
It’s not difficult to step through a trace file this small by hand. At the end of this chapter, I’ll describe each action in overview, to give you a feel for what kind of data you’ll find in the trace file. In the meantime, let’s just hit the highlights.
At the beginning of a trace file is a preamble, which reveals
information about the trace file: its name, the release of the Oracle
kernel that generated it, and so on. Next is a line that identifies
the session being traced (session 7, serial number 6692 in our case),
and the time the line was emitted. Notice that the kernel identifies
every SQL statement used by the session in a PARSING IN CURSOR section. This PARSING IN CURSOR section shows attributes of the SQL
text being used, including the SQL text itself.
The action lines in a trace file are lines beginning with the
tokens PARSE, EXEC, and FETCH (and a few others) and the WAIT lines. Each PARSE, EXEC, and FETCH line represents the execution of a
single database call. The c and
e statistics report on how much
total CPU time and total elapsed time, respectively, were consumed by
the call. Other statistics on a database call line reveal the number
of Oracle blocks obtained via operating system read calls (p) or by two modes of database buffer cache
retrieval (cr for consistent-mode
reads and cu for current-mode
reads), the number of misses on the library cache endured by the call
(mis), and the number of rows
returned by the call (r). The
tim value at the end of each
database call line lets you know approximately what time it was when
the database call completed.
The WAIT lines are an
exciting “new” addition to Oracle trace files, since they have been
available only since about 1992. These WAIT lines are part of what distinguish
extended SQL trace data from plain old regular
SQL trace data. Each WAIT line
reports on the duration of a specific sequence of instructions
executed within the Oracle kernel process. The ela statistic reports the response time of
such a sequence of instructions. The nam attribute identifies the call, and the
p1, p2, and p3 values provide useful information about
the call in a format that is unique to each different nam value.
The STAT lines don’t convey
direct response time information until Release 9.2. However, even
prior to 9.2, they’re of immense use in performance analysis, because
they contain information about the execution plan that the Oracle
query optimizer chose for executing the cursor’s SQL. Finally, the
XCTEND line is emitted whenever the
application being traced issues a commit or a rollback
instruction.
That’s it. Everything you need to account accurately for a
session’s response time is in the trace file. One of the best things
about the data is that you can see exactly what a
session did during the course of its execution. You don’t have to try
to extrapolate details from an average, like assessing V$ data forces you to do. All the details
are laid out in front of you in chronological order,[1] and they’re stored in an easy-to-parse ASCII
format.
Extended SQL Trace Data Reference
One of the reasons for Oracle Corporation’s enormous success in the high-performance database market is the easy accessibility of detailed response time data. Beginning with extended SQL trace files and extending throughout several fixed views, the Oracle kernel provides you all the detail you need in order to know why an application has consumed exactly the response time that it did. The only thing that might be missing is whether you understand how to exploit all that detail. Filling this gap is the mission of my work in this book.
Trace File Element Definitions
Several good sources exist to describe the format of each trace file line [Oracle MetaLink note 39817.1; Kyte (2001) 464-475; Morle (2000) 133-142]. However, none goes far enough to enable full accounting of session response time. Full response time accounting is the goal that you will achieve with the book you are reading now. The following sections describe the meaning of each of the performance-related statistics reported in Oracle’s extended SQL trace data.
Cursor numbers
Each line emitted to a trace file corresponds to one
“action” executed by the Oracle kernel program. Each line uses the
string #ID to identify a cursor
upon which the kernel performed the action. For example, the
following line shows a fetch executed upon cursor #1:
FETCH #1:c=0,e=177,p=0,cr=1,cu=2,mis=0,r=1,dep=0,og=4,tim=1038931660054596
The cursor numbers are relevant only within the scope of the
trace file. Furthermore, the Oracle kernel makes a cursor number
available for reuse within a trace file when a cursor is closed.
Hence, trace file lines containing references to a given cursor
number do not all necessarily refer to the same cursor.
Fortunately, a given trace file contains a time-ordered record of
every cursor creation; each PARSING IN
CURSOR token indicates a cursor birth (or rebirth). For
example, the following are two PARSING
IN CURSOR lines from
the trace file in Example
5-2:
= = = = = = = = = = = = = = = = = = = = = PARSING IN CURSOR #1 len=69 dep=0 uid=5 oct=42 lid=5 tim=1038931660052098 hv=1509700594 ad='50d6d560' alter session set events '10046 trace name context forever, level 12' END OF STMT ... = = = = = = = = = = = = = = = = = = = = = PARSING IN CURSOR #1 len=51 dep=0 uid=5 oct=3 lid=5 tim=1038931660054075 hv=1716247018 ad='50c551f8' select 'Hello, world; today is '||sysdate from dual END OF STMT
The first PARSING IN
CURSOR section indicates that cursor #1 was associated with the ALTER SESSION statement. Later in the
same trace file, the Oracle kernel reused ID #1 for the cursor associated with the
SELECT statement.
Session identification and timestamps
A line beginning with the token *** indicates the system time obtained
immediately before the *** line
itself was emitted to the trace file. For example:
*** 2002-12-02 22:25:53.716 *** SESSION ID:(8.6550) 2002-12-02 22:25:53.714
This information helps the performance analyst by
establishing a mapping from Oracle’s tim value clock to the system wall
clock. The Oracle kernel helpfully emits a *** line into the trace data any time
there has been a significant amount of time (tens of seconds)
elapsed since the emission of the previously emitted trace line.
This feature is helpful because it allows you to resynchronize
your understanding of the correct wall clock time over large spans
of WAIT lines, which contain
approximate elapsed durations (ela), but no internal clock (tim) values. If you want to emit this
line yourself to your trace data, you can do so by calling
DBMS_SYSTEM.KSDDDT.
A line containing the token SESSION
ID:(
m.n ) identifies the trace file lines that
follow the SESSION ID line as
being associated with the Oracle session with V$SESSION.SID=
m and V$SESSION.SERIAL#=
n. The session identification lines
help you ensure that you are analyzing the correct trace file. In
Oracle multithreaded server (MTS) configurations, the lines are
especially valuable, because each Oracle kernel process can
service requests on behalf of many Oracle sessions. Lines
containing a session ID signal which session’s work is represented
in the raw trace lines that follow.
Did you notice that the timestamp and session identification lines shown here are printed out of time sequence? (The first line marks time 22:25:53.716, and the second one marks a time 0.002 seconds earlier.) This phenomenon is similar to the one described later in Section 5.2.1.4.
Application identification
If the application has set its module name or action
with the DBMS_APPLICATION_INFO
package, then the Oracle kernel will emit an APPNAME line when level-1 SQL tracing is
activated. For example:
APPNAME mod='SQL*Plus' mh=3669949024 act='' ah=4029777240
The individual values in this line are as follows:
modThe name of the module set with the
SET_MODULEprocedure.mhA “hash value” that identifies the module.
actThe name of the action set with either
SET_MODULEorSET_ACTION.ahA “hash value” that identifies the action.
Cursor identification
A PARSING IN
CURSOR section contains information about a cursor. For
example:
= = = = = = = = = = = = = = = = = = = = = PARSING IN CURSOR #135 len=358 dep=0 uid=173 oct=3 lid=173 tim=3675359494 hv=72759792 ad='bb13f788' select vendor_number, vendor_id, vendor_name, vendor_type_lookup_code, type_1099, employee_id, num_1099, vat_registration_num, awt_group_id, allow_awt_flag, hold_all_ payments_flag, num_active_pay_sites, total_prepays, available_prepays from po_ vendors_ap_v where (VENDOR_NUMBER LIKE :1) AND ( active_flag = 'Y' and enabled_flag = 'Y' ) order by vendor_number END OF STMT
The PARSING IN CURSOR
line itself contains information about cursor #ID. Text between the PARSING IN CURSOR line and the
corresponding END OF STMT line
is the cursor’s SQL text. The Oracle kernel usually emits this
section at the conclusion of a parse call, just before the kernel
emits a cursor’s PARSE line.
However, if tracing was not active when the parse call completed,
the kernel will usually emit near the beginning of the trace data
(just before the completion of the first traced database call, but
potentially after one or more WAIT lines), as if the Oracle kernel
were executing the following pseudocode:
# Upon completion of Oracle kernel activity required by a db call...
if SQL tracing level >= 1 {
if db call is PARSE or pic[cursor_id] is unset {
emit "PARSING IN CURSOR" section
pic[cursor_id] = 1
}
emit statistics for the db call
}Thus, Oracle reveals information in the trace file about a cursor even if tracing was not active at the conclusion of the cursor’s parse call.
Each PARSING IN CURSOR
line contains the following information about a cursor:
lenThe length of the SQL text.
depThe recursive depth of the cursor. A
dep=n + 1 cursor is a child of somedep=n cursor (n = 0, 1, 2, ...). Several actions motivate recursive SQL, including database calls that require information from the Oracle database dictionary, statements that fire triggers, and PL/SQL blocks that contain SQL statements. See Section 5.3.3 later in this chapter for further discussion of the “recursive” SQL relationship.uidThe schema user ID of the user who parsed the statement.
octThe Oracle command type ID [Oracle OCI (1999)].
lidThe privilege user ID. For example, if
FREDcalls a package owned byJOE, then a SQL statement executed within the package will have auidthat refers toFRED, and anlidthat refers toJOE.timIf a
timvalue is 0, thenTIMED_STATISTICSfor the session was false when the database call time would have been calculated. You can thus confirm whetherTIMED_STATISTICSwas true by observingtimvalues. In our field work, my colleagues and I have found that specific non-zerotimvalues associated withPARSING INCURSORsections are largely irrelevant.In Oracle9i,
timis a value expressed in microseconds (1 μs = 0.000 001 seconds). On some systems (such as our Linux research servers),timfield values are unadulteratedgettimeofdayvalues. On other systems (like our Microsoft Windows research machines), the origin oftimfield values can be much more mysterious. In releases prior to Oracle9i,timis aV$TIMER.HSECSvalue expressed in centiseconds (1 cs = 0.01 seconds).hvThe statement ID of the SQL statement. The
hvmay look unique, but it is not. Occasionally (albeit rarely), distinct SQL texts share the samehvvalue.adThe library cache address of the cursor, as is shown in
V$SQL.
Database calls
A database call is a subroutine
in the Oracle kernel. If level-1 SQL tracing is active when a
database call completes, then the Oracle kernel emits a database
call line upon completion of that database call. PARSE, EXEC, and FETCH calls are the most common types of
database call. For example:
PARSE #54:c=20000,e=11526,p=0,cr=2,cu=0,mis=1,r=0,dep=1,og=0,tim=1017039304725071 EXEC #1:c=10000,e=12137,p=0,cr=22,cu=0,mis=0,r=1,dep=0,og=4,tim=1017039275981174 FETCH #3:c=10000,e=306,p=0,cr=3,cu=0,mis=0,r=1,dep=2,og=4,tim=1017039275973158
Other database call types (for example, ERROR, UNMAP, and SORT
UNMAP) are explained in Oracle
MetaLink note 39817.1. Each database call
line contains the following statistics:
cThe total CPU time consumed by the Oracle process during the call. Oracle9i expresses
cin microseconds (1 μs = 0.000 001 seconds). Prior kernel versions expresscin centiseconds (1 cs = 0.01 seconds).eThe amount of wall time that elapsed during the call. Oracle9i expresses
ein microseconds (1 μs = 0.000 001 seconds). Prior kernel versions expressein centiseconds (1 cs = 0.01 seconds).pThe number of Oracle database blocks obtained by the call via operating system disk read calls. The name
pis supposed to be mnemonic for the word “physical,” but note that not every so-called Oracle “physical” read visits a physical disk device. Many such reads are serviced from various caches between the Oracle kernel and the physical disk.crThe number of Oracle database blocks obtained by the call in consistent mode from the Oracle database buffer cache. A read executed in consistent mode can motivate additional consistent mode reads from undo blocks, which are stored in rollback segments.
cuThe number of Oracle database blocks obtained by the call in current mode from the Oracle database buffer cache. A read executed in current mode is simply a read of the current content of a block.
misThe number of library cache misses encountered during the call. Each library cache miss motivates a hard parse operation.
rThe number of rows returned by the call.
depThe recursive depth of the cursor. A
dep=n + 1 cursor is a child of somedep=n cursor (n = 0, 1, 2, ...). See Section 5.2.1.4 earlier in this chapter for more details.ogThe optimizer goal in effect during the call. Oracle uses the values shown in Table 5-1.
timSee Section 5.2.1.4 listed previously for details.
og value | Oracle query optimizer goal |
1 | |
2 | |
3 | |
4 | |
Note that the Oracle kernel does not emit a database call
line into the trace file until the action has
completed. Thus, an extraordinarily long
database operation might cause the Oracle kernel to work for
several hours without emitting anything to
the trace file. Poorly optimized SQL can produce EXEC calls (for updates or deletes) or
FETCH calls (for selects) that
consume CPU capacity for several days at a
time.
Wait events
An Oracle wait event is a
sequence of Oracle kernel instructions that is wrapped with
special timing instrumentation. If level-8 or level-12 SQL tracing
is active when a wait event completes, then the Oracle kernel
emits a WAIT line upon
completion of that event. For example:
WAIT #1: nam='SQL*Net message to client' ela= 40 p1=1650815232 p2=1 p3=0 WAIT #1: nam='SQL*Net message from client' ela= 1709 p1=1650815232 p2=1 p3=0 WAIT #34: nam='db file sequential read' ela= 14118 p1=52 p2=2755 p3=1 WAIT #44: nam='latch free' ela= 1327989 p1=-1721538020 p2=87 p3=13
Each WAIT line contains
the following statistics about work executed during the
event:
namThe name assigned by an Oracle kernel developer to reveal which part of the Oracle kernel code is responsible for this portion of your response time.
elaThe elapsed duration of the named event’s execution. Oracle9i expresses
elain microseconds (1 μs = 0.000 001 seconds). Prior kernel versions expresselain centiseconds (1 cs = 0.01 seconds).p1, p2, p3The meanings of these parameters vary by
nam. A complete catalog of parameter descriptions for each event type is available by running the following SQL:select name, parameter1, parameter2, parameter3 from v$event_name order by name
Note that WAIT lines
appear in the trace data before the database
call that motivated them. This occurs because the Oracle kernel
emits lines into the trace file as events complete. Thus, if a
fetch call requires three OS read calls, the three waits for the
read calls will appear in the trace file before Oracle emits the
information about the completed fetch call.
The WAIT lines in SQL
trace data are one interface to the new Oracle feature introduced
in 1992 that has been so important in revolutionizing the ease
with which we can diagnose and repair performance problems
today.
Bind variables
If level-4 or level-12 SQL tracing is active when
the Oracle kernel binds values to placeholders in an application’s
SQL text, the kernel emits a BINDS section. For example:
= = = = = = = = = = = = = = = = = = = = =
PARSING IN CURSOR #1 len=105 dep=0 uid=56 oct=47 lid=56 tim=1017039275982462
hv=2108922784 ad='98becef8'
declare dummy boolean;begin fnd_profile.get_specific(:name, :userid, :respid, :
applid, :val, dummy);end;
END OF STMT
...
Several lines have been omitted for clarity
...
BINDS #1:
bind 0: dty=1 mxl=2000(1998) mal=00 scl=00 pre=00 oacflg=01 oacfl2=0 size=2000
offset=0
bfp=025a74a0 bln=2000 avl=19 flg=05
value="MFG_ORGANIZATION_ID"
bind 1: dty=2 mxl=22(22) mal=00 scl=00 pre=00 oacflg=01 oacfl2=0 size=72 offset=0
bfp=025a744c bln=22 avl=04 flg=05
value=118194
bind 2: dty=2 mxl=22(22) mal=00 scl=00 pre=00 oacflg=01 oacfl2=0 size=0 offset=24
bfp=025a7464 bln=22 avl=05 flg=01
value=1003677
bind 3: dty=2 mxl=22(22) mal=00 scl=00 pre=00 oacflg=01 oacfl2=0 size=0 offset=48
bfp=025a747c bln=22 avl=03 flg=01
value=140
bind 4: dty=1 mxl=2000(1998) mal=00 scl=00 pre=00 oacflg=01 oacfl2=0 size=2000 offset=0
bfp=025ba490 bln=2000 avl=00 flg=05A BINDS section contains
one or more bind subsections,
one for each variable being bound. The number following the word
bind indicates the ordinal
position, beginning at 0, of the bind variable within the SQL
text. Each bind section
contains several statistics about the bind. The most important
ones for use in performance analysis are:
dtyThe external data type of the value supplied by the application [Oracle OCI (1999)]. Oracle publishes two sets of data types: internal and external. The internal data type definitions reveal how the Oracle kernel stores its data on the host operating system. The external data type definitions reveal how the Oracle kernel interfaces with application SQL.
The external data type of a bind value is important. Occasionally we find SQL statements for which the Oracle query optimizer flatly refuses to use an obviously helpful index. Sometimes such a case is caused by a mismatch between the column type and the value type, which can force an implicit type coercion function to be executed upon the column, which prevents the optimizer from choosing that index.
avlThe length, in bytes, of the bind value.
valueThe value that is bound into the statement execution. The Oracle kernel sometimes truncates values that it emits into the trace file. You can determine exactly when this has happened by simple inspection; truncation has occurred any time the
avlvalue is larger than the length of thevaluefield.
When no value field is
emitted to the trace file, it is an indication that the NULL value has been bound into the
placeholder variable. For example, in the fnd_profile.get_specific sample shown
earlier, the absence of a value
field for bind 4 indicates that
the application has provided the NULL value for the :val placeholder. The bind value length
specification of zero (avl=00)
is corroborative evidence.
Row source operations
If level-1 SQL tracing is active when a cursor is
closed, then the Oracle kernel emits one STAT line for each row source operation
in the cursor’s execution plan. For example:
STAT #1 id=1 cnt=55 pid=0 pos=1 obj=0 op='SORT UNIQUE (cr=39741 r=133 w=0 time=1643800 us)' STAT #1 id=2 cnt=23395 pid=1 pos=1 obj=0 op='VIEW (cr=39741 r=133 w=0 time=1614067 us)' STAT #1 id=3 cnt=23395 pid=2 pos=1 obj=0 op='SORT UNIQUE (cr=39741 r=133 w=0 time=1600554 us)' STAT #1 id=4 cnt=23395 pid=3 pos=1 obj=0 op='UNION-ALL (cr=39741 r=133 w=0 time=1385984 us)'
If a trace file does not contain the STAT lines you were hoping to find, it
is because tracing was deactivated before the cursor closed. The
STAT lines will of course be
absent any time you trace a well-designed persistent service that
neither terminates nor closes its cursors more than once every
several weeks.
Each STAT line contains
the following statistics about the cursor’s execution plan:
idThe unique ID of the row source operation within the
STATline set.cntNumber of rows returned by this row source operation.
pidID of this operation’s parent operation.
posThe best we can determine, an arbitrary number. It might seem that this value might define the “position” of a row source operation within a set of operations belonging to a single parent, but it appears that sibling row source operations are ordered in increasing ID order.
objObject ID of the row source operation, if the operation executes upon a “base object.” A row source operation such as
NESTED LOOPS, which itself does not access a base object, will reportobj=0. (TheNESTED LOOPSoperation’s children do access base objects, but theNESTED LOOPSrow source operation itself does not.)opThe name of the row source operation. Beginning with Oracle Release 9.2.0.2.0, the kernel emits additional information into the
STATlines [Rivenes (2003)]. The new information reveals several useful statistics for each row source operation, including:crNumber of consistent-mode reads.
rNumber of Oracle blocks read with OS read calls.
wNumber of Oracle blocks written with OS read calls.
timeThe elapsed duration, expressed in microseconds (
us).
The statistics for a parent row source operation include a roll-up of the statistics for its children.
Tip
Oracle’s tkprof utility produces erroneous results in more cases than you might have imagined, especially in
STATline processing. Oracle’s tkprof has an exceptional reputation for reliability, but I’m convinced that one reason the tool maintains this reputation is that people simply never bother to double-check its output. To confirm or refute whether tkprof is giving correct output is impossible to do without studying raw trace data. Most people are reluctant to do this. I hope this book helps encourage you to make the effort.
Transaction end markers
If level-1 SQL tracing is active when a commit or
rollback occurs, then the Oracle kernel emits an XCTEND line upon completion of the call.
For example:
XCTEND rlbk=0, rd_only=0
Each XCTEND line contains
the following statistics about work executed during the commit or
rollback:
rlbkTrue (
1) if and only if the transaction was rolled back.rd_onlyTrue (
1) if and only if the transaction changed no data in the database.
Notice that the XCTEND
marker has no cursor ID reference. This is because there is a
one-to-many relationship between a transaction and the cursors
that participate in the transaction.
Reference summary
Table 5-2 summarizes the raw trace data statistics that will be most interesting to you during your performance analysis work.
Field | Occurs in . . . | Description | ||
Cursor ID | Database call | Wait event | ||
| ✓ | Total CPU time consumed by the database call. Reported in microseconds on Oracle9i, centiseconds on prior releases. | ||
| ✓ | Number of Oracle blocks obtained from the database buffer cache in consistent mode. | ||
| ✓ | Number of Oracle blocks obtained from the database buffer cache in current mode. | ||
| ✓ | ✓ | The recursive depth of the cursor. | |
| ✓ | Elapsed duration consumed by the database call. Reported in microseconds on Oracle9i, centiseconds on prior releases. | ||
| ✓ | Elapsed duration consumed by the wait event. Reported in microseconds on Oracle9i, centiseconds on prior releases. | ||
| ✓ | Statement ID. | ||
| ✓ | Number of misses upon the library cache. | ||
| ✓ | Name of the wait event. | ||
| ✓ | Number of Oracle blocks obtained via operating system read calls. | ||
| ✓ | Information about the wait event; varies by
value of | ||
| ✓ | ✓ | ||
Oracle Time Units
Oracle9i kernels report SQL trace timing statistics in microseconds (1 μs = 0.000 001 seconds). Oracle release 6, 7, and 8 kernels report SQL trace timing statistics in centiseconds (1 cs = 0.01 seconds). Table 5-3 summarizes the unit of measure that the Oracle kernel uses for each type of time statistics in extended SQL trace data.
Oracle version | c | e | ela | tim |
9 | μs | μs | μs | μs |
8 | cs | cs | cs | cs |
7 | cs | cs | cs | cs |
6 | cs | cs | N/A | cs |
Table 5-4 explains the meaning of the time units that you will use as an Oracle performance analyst.
Response Time Accounting
The Oracle kernel emits two categories of time into a trace file:
Time consumed within a database call
Time consumed between database calls
A session’s total response time is the sum of all time spent within database calls, plus the sum of all time consumed between database calls. To keep from over- or under-accounting for response time in your trace file, you must know the proper category for each line of your trace file.
Time Within a Database Call
The trace file excerpt in Example 5-3 shows actions
that consume time within three different database calls. The first
database call to complete was a parse call that consumed 306 μs. The
kernel helpfully supplied the PARSING IN
CURSOR section before emitting the PARSE line so that you and I can tell what
got parsed. Next, the kernel emitted an EXEC line, which means that an execute
call completed upon the cursor, consuming an additional 146 μs of
elapsed time. The next actions to complete are two operating system
read calls denoted on the two
WAIT lines. The “parent”
operation responsible for issuing these read calls is the fetch call
whose statistics are reported on the FETCH line.
= = = = = = = = = = = = = = = = = = = = = PARSING IN CURSOR #4 len=132 dep=1 uid=0 oct=3 lid=0 tim=1033064137929238 hv=3111103299 ad='517ba4d8' select /*+ index(idl_ub1$ i_idl_ub11) +*/ piece#,length,piece from idl_ub1$ where obj#=:1 and part=:2 and version=:3 order by piece# END OF STMT PARSE #4:c=0,e=306,p=0,cr=0,cu=0,mis=0,r=0,dep=1,og=4,tim=1033064137929139 EXEC #4:c=0,e=146,p=0,cr=0,cu=0,mis=0,r=0,dep=1,og=4,tim=1033064137931262 [1]WAIT #4 nam='db file sequential read' ela= 13060 p1=1 p2=53903 p3=1[2]WAIT #4 nam='db file sequential read' ela= 6978 p1=1 p2=4726 p3=1[3] FETCH #4: c=0,e=21340,p=2,cr=3,cu=0,mis=0,r=0,dep=1,og=4,tim=1033064137953092 STAT #4 id=1 cnt=0 pid=0 pos=0 obj=72 op='TABLE ACCESS BY INDEX ROWID IDL_UB1$ ' STAT #4 id=2 cnt=0 pid=1 pos=1 obj=120 op='INDEX RANGE SCAN '
The lines for the read
calls occur in the trace data before the line
for the fetch that motivated them because the Oracle kernel emits
the statistics for an action upon that action’s completion. The
Oracle kernel instructions that produced these trace lines looked
something like this:
fetch IDL_UBL$ query
execute some of the instructions necessary for the IDL_UBL$ fetch
perform a single-block I/O call upon file 1, block 53903
emit [1]"WAIT #4: nam='db file sequential read' ela=13060 ..."
execute some more fetch instructions
perform a single-block I/O call upon file 1, block 4726
emit [2]"WAIT #4: nam='db file sequential read' ela=6978 ..."
execute the remainder of the fetch instructions
emit [3]"FETCH #4:c=0,e=21340,..."
close the cursor
etc.The fetch call consumed a total elapsed duration of 21,340 μs. The components of the response time for the fetch call are shown in Table 5-5.
Response time | Component |
13,060 μs | db file sequential read |
6,978 μs | db file sequential read |
0 μs | Total CPU |
1,302 μs | Unaccounted for |
21,340 μs | Total elapsed time for the fetch |
The e statistic for a
database call is the elapsed duration of the entire database call.
Thus, the value of e includes the
duration of all CPU time consumed by the call (reported as the value
of c), plus all of the elapsed
time consumed by wait events executed in the context of the database
call (reported as ela values).
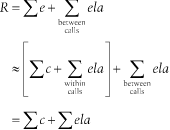
Figure 5-1 shows the
relationship; formally, we write:
This is the fundamental relationship of Oracle time statistics within a single database call. The relationship is only approximate because of factors including measurement intrusion effect, quantization error, time spent not executing, and un-instrumented Oracle kernel code segments, which I discuss in Chapter 7.

Time Between Database Calls
The Oracle kernel also emits elapsed durations for wait events that occur between database calls. Examples of wait events that occur between database calls include:
SQL*Net message from
client |
SQL*Net message to
client |
single-task
message |
pipe get |
rdbms ipc
message |
pmon timer |
smon timer |
The trace file excerpt in Example 5-4 shows wait events
that occur between database calls. The application depicted here
makes the scalability-inhibiting mistake of parsing too often. As
you can see, the excerpt shows two consecutive parse calls (bold) of
the exact same SQL text. The WAIT
lines (bold and italic) occur between the parse
calls both in the sense of where they are located in the trace file
and also because the elapsed times of these actions are not tallied
into the elapsed time of the second parse call. You can confirm this
by noticing that the elapsed duration recorded for the second
PARSE line (e=0) is too small to contain the elapsed
duration for the SQL*Net message from client event (ela= 3).
= = = = = = = = = = = = = = = = = = = = =
PARSING
            IN
CURSOR #9 len=360 dep=0 uid=26 oct=2 lid=26 tim=1716466757 hv=2475520707
ad='d4c55480'
INSERT INTO STAGING_AREA (TMSP_LAST_UPDT, OBJECT_RESULT, USER_LAST_UPDT, DOC_OBJ_ID,
TRADE_NAME_ID, LANGUAGE_CODE) values(TO_DATE('11/05/2001 16:39:06', 'MM/DD/YYYY HH24:MI:
SS'), 'if ( exists ( stdphrase ( "PCP_MAV_1" ) ) , langconv ( "Incompatibility With Other
Materials" ) + ": " , log_omission ( "Materials to Avoid: " ) )', 'sa', 222, 54213, 'NO_
LANG')
END OF STMT
PARSE #9:c=0,e=0,p=0,cr=0,cu=0,mis=1,r=0,dep=0,og=4,tim=1716466757
WAIT #9: nam='SQL*Net message to client' ela= 0 p1=1413697536 p2=1 p3=0WAIT #9: nam='SQL*Net message from client' ela= 3 p1=1413697536 p2=1 p3=0PARSE #9:c=0,e=0,p=0,cr=0,cu=0,mis=0,r=0,dep=0,og=4,tim=1716466760
With this knowledge, you can refine your understanding of the
relationship among c, e, and ela statistics for an entire trace file.
Given what you’ve seen so far, total response time for a session
equals the total amount of time spent within database calls, plus
the total amount of time spent between database calls. We can state
this formally as:
However, there is one final complication: the double-counting imposed by the presence of recursive SQL.
Recursive SQL Double-Counting
Recursive SQL is the SQL associated with any database call that has
a dep value that is greater than
zero. A dep= n + 1 database call (for n = 0, 1, 2, ...) can be regarded as a
child of some dep= n database call. Application sessions
routinely produce complicated enough trace data to produce a whole
forest of relationships among SQL statements that act as each
other’s parents, children, siblings, and so on. Each SQL trace file
contains enough information to enable you to determine the exact
parent-child relationships among database calls. To account for a
session’s response time without double-counting some statistics, you
must understand how to determine the recursive relationships among
database calls.
Parent-child relationships
The term recursive denotes the Oracle kernel’s execution of database calls within the context of other database calls. Activities that inspire recursive SQL include execution of DDL statements, execution of PL/SQL blocks with DML statements within them, database call actions with triggers on them, and all sorts of routine application DML statements that motivate data dictionary access. Any database call that can execute another database call can motivate recursive SQL.
Example 5-5 is
a trace file excerpt that contains evidence of recursive SQL in
action. In this excerpt, you can see information about a new
cursor labeled #2, which is
associated with the following SQL text:
select text from view$ where rowid=:1
This SQL text appears nowhere within the source of the
application that was traced. This SQL was motivated by the parse
of a query from the DBA_OBJECTS
view.
= = = = = = = = = = = = = = = = = = = = = [1] PARSING IN CURSOR #2 len=37 dep=1 uid=0 oct=3 lid=0 tim=1033174180230513 hv=1966425544 ad='514bb478' select text from view$ where rowid=:1 END OF STMT [2] PARSE #2:c=0,e=107,p=0,cr=0,cu=0,mis=0,r=0,dep=1,og=4,tim=1033174180230481 [3] BINDS #2: bind 0: dty=11 mxl=16(16) mal=00 scl=00 pre=00 oacflg=18 oacfl2=1 size=16 offset=0 bfp=0a22c34c bln=16 avl=16 flg=05 value=00000AB8.0000.0001 [4] EXEC #2:c=0,e=176,p=0,cr=0,cu=0,mis=0,r=0,dep=1,og=4,tim=1033174180230878 [5] ETCH #2:c=0,e=89,p=0,cr=2,cu=0,mis=0,r=1,dep=1,og=4,tim=1033174180231021 [6] TAT #2 id=1 cnt=1 pid=0 pos=0 obj=62 op='TABLE ACCESS BY USER ROWID VIEW$ ' = = = = = = = = = = = = = = = = = = = = = [7] PARSING IN CURSOR #1 len=85 dep=0 uid=5 oct=3 lid=5 tim=1033174180244680 hv=1205236555 ad='50cafbec' select object_id, object_type, owner, object_name from dba_objects where object_id=:v END OF STMT [8] PARSE #1:c=10000,e=15073,p=0,cr=2,cu=0,mis=1,r=0,dep=0,og=0,tim=1033174180244662
The rule for determining the recursive relationships among database calls is simple:
A database call with
dep=n + 1 is the recursive child of the first subsequentdep=n database call listed in the SQL trace data stream.
Example 5-6
shows by example why this is true. The Oracle kernel can emit
trace data for a database call only after the action has
completed. (The kernel cannot compute, for example, the call’s
elapsed time until after the call has completed.) Thus we can
reconstruct the sequence of instructions that generated the SQL
trace data shown in Example
5-5. Specifically, in this example, all the database calls
for the VIEW$ query are
recursive children of the parse call for the DBA_OBJECTS query. The indentation
levels for procedures in the call stack shown in Example 5-6 highlight the
recursive parent-child relationship among database calls.
parse DBA_OBJECTS query
# query VIEW$ to obtain the definition of DBA_OBJECTS
parse VIEW$ query
# execute the instructions necessary for the VIEW$ parse
emit [1]"PARSING IN CURSOR #2 ..."
emit [2]"PARSE #2: ..."
bind to the VIEW$ cursor
# execute the instructions necessary for the VIEW$ bind
emit [3]"BINDS #2: ..."
execute the VIEW$ cursor
# execute the instructions necessary for the VIEW$ exec
emit [4]"EXEC #2: ..."
fetch from the VIEW$ cursor
# execute the instructions necessary for the VIEW$ fetch
emit [5]"FETCH #2: ..."
close the VIEW$ cursor
# execute the instructions necessary for the VIEW$ close
emit [6]"STAT #2: ..."
# execute the remaining instructions for the DBA_OBJECTS parse
emit [7]"PARSING IN CURSOR #1 ..."
emit [8]"PARSE #1: ..."Figure 5-2 shows a graphical representation of the parent-child relationships among the database calls.

Recursive statistics
In Oracle releases through at least
Oracle9i Release 2, a database call’s
c, e, p,
cr, and cu statistics contain an aggregation of
the resources consumed by the database call itself and its entire
recursive progeny.
Tip
A database call’s recursive progeny consists of all recursive descendants of the database call, including children, grandchildren, great-grandchildren, and so on.
Figure 5-3
illustrates such a relationship for a fictional set of database
calls. Each node (rectangle) in the graph represents a database
call (e.g., a PARSE, EXEC, or FETCH). A directed line from some node
A to another node B denotes that database call A is a recursive parent (that is, the
caller) of database call B. The cr= n listed inside
the node is the statistic that the Oracle kernel will emit for the
database call. The value of cr
self is the number of consistent-mode reads
executed by the database call itself, exclusive of its children’s
call counts.

The kernel emits only the progeny-inclusive statistics, but
from these statistics you can derive the progeny-exclusive
statistics shown inside the nodes. For example, if the numbers
inside the nodes in Figure
5-3 had been omitted, it would be easy to fill them in.
Each node’s value is simply the statistic value for that node
minus the sum of the statistic values reported for that node’s
direct descendants. The value of a node at dep= k is thus the cr value reported for that database call
minus the sum of the cr values
of its dep= k + 1 descendants. Or, to generalize,
we can say that the quantity s of a resource consumed by a database call at
dep= k is:
where s
i is the value of a statistic in
the set {c, e, p,
cr, cu} reported by the Oracle kernel at
recursive depth i.
You can use this technique easily enough on real trace data.
Again consider the database calls described in Example 5-5. Figure 5-4 illustrates the
progeny-inclusive elapsed time value for each database call
(denoted e) and the
progeny-exclusive elapsed time contribution for each database call
(denoted e
self).
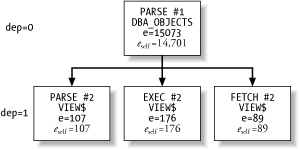
Table 5-6
shows all the progeny-exclusive statistics associated with each
database call in Example
5-5. The progeny-exclusive contribution to elapsed time for
the PARSE #1 database call, for example,
is:

Resources consumed by... | c | e | p | cr | cu |
| 10,000 | 15,073 | 0 | 2 | 0 |
| 0 | 107 | 0 | 0 | 0 |
| 0 | 176 | 0 | 0 | 0 |
| 0 | 89 | 0 | 2 | 0 |
PARSE #1 excluding its recursive progeny | 10,000 | 14,701 | 0 | 0 | 0 |
Now we have enough information to complete the response time accounting formula. When we eliminate the double-counting influences of recursive SQL, we have, finally:

That is, the
total response time for a trace file approximately equals the sum
of the file’s e values for
database calls at recursive depth zero, plus the sum of the file’s
ela values for wait events that
occur between database calls. A file’s total response time
approximately equals the sum of the file’s c values for database calls at depth
zero, plus the sum of all the file’s ela values.
Evolution of the Response Time Model
In the 1980s, when most of today’s “tuning methods” were
invented, Oracle’s SQL trace facility did not yet have the capability
to emit wait event timing information—the WAIT lines—into the trace file. The c, e, and
tim data were the only trace data
elements that we had. Of course, if most of an application’s response
time had been spent consuming CPU, then the c and e
data told us most of what we needed to know about the performance of
our database calls. However, if some of a database call’s response
time was not due to CPU consumption, then our
analysis became more difficult.
For example, consider the following fetch call statistics obtained from an application running on Oracle 8.1.7.2:
FETCH #1:c=80741,e=151841,p=9628,cr=34304348,cu=10,mis=0,r=0,dep=0,og=4,tim=87762034
This fetch call consumed 1,518.41 seconds of elapsed time, only
807.41 of which was spent on the CPU. Where did the other 711.00
seconds of response time go? Was it latch contention? Enqueue waits?
Long disk queues? Excessive paging? We simply cannot know by looking
at this FETCH line. Its statistics
contain insufficient information to determine where the
unaccounted-for 711 seconds of elapsed time went. Certainly, a large
p value is a clue that some of the
unaccounted-for e time might have
been consumed by OS read calls, but there are roughly 200 different
wait events that Oracle could have executed during those 711 seconds.
From viewing only the fetch statistics shown here, we cannot
know how the 711 seconds were consumed.
In 1992 with the release of kernel Version 7.0.12, Oracle
Corporation published an elegant solution to this problem. The new
mechanism that Oracle provided was simply to instrument several events
executed by the Oracle kernel that consume elapsed time but not CPU
capacity. The value of the so-called wait data is absolutely
extraordinary. It helps to fill in the time gap between e and c.
Anjo Kolk and Shari Yamaguchi were the first to document the use of
“wait data” in the document that became the landmark YAPP
Method [Kolk and Yamaguchi (1999)].
Let’s revisit our previous example, in which we had 711 seconds
of unaccounted-for time. Instructing the Oracle kernel to produce the
WAIT statistics adds 9,748 more
lines of data to our trace file before the fetch call. Executing the
Perl program in Example
5-7 upon 9,749 lines of trace data produces the following
resource profile:
$ prof-cid waits.1.trc
Duration Pct Oracle kernel event
--------- ------ ----------------------------------------
807.41s 53.2% total CPU
426.26s 28.1% direct path write
197.29s 13.0% db file sequential read
76.23s 5.0% unaccounted-for
8.28s 0.5% latch free
2.87s 0.2% db file scattered read
0.05s 0.0% file open
0.02s 0.0% buffer busy waits
0.00s 0.0% SQL*Net message to client
--------- ------ ----------------------------------------
1518.41s 100.0% Total response timeNow we know. Over 53% of the response time for the fetch was consumed on a CPU in user mode. Over 28% was consumed writing (surprise!) to disk. Another 13% was consumed by reading from disk, and roughly another 6% of the response time was consumed in various other wait events.
#!/usr/bin/perl
# $Header: /home/cvs/cvm-book1/sqltrace/prof-cid.pl,v 1.4 2003/03/20 23:32:32 cvm Exp $
# Cary Millsap ([email protected])
# Copyright (c) 1999-2003 by Hotsos Enterprises, Ltd. All rights reserved.
# Create a resource profile for a single database call.
# Usage: $0 file.trc
# Requires input of Oracle extended SQL trace data (level 8 or level 12)
# that has been pre-filtered to contain only a single database call (that
# is, a single PARSE, EXEC, FETCH, UNMAP, or SORT UNMAP with no recursive
# children) and the WAIT lines associated with that db call. Example input
# file content:
#
# WAIT #2: nam='db file sequential read' ela= 0 p1=2 p2=3240 p3=1 WAIT
# WAIT #2: nam='db file sequential read' ela= 0 p1=2 p2=3239 p3=1 FETCH
# FETCH #2:c=213,e=998,p=2039,cr=100550,cu=5,mis=0,r=0,dep=0,og=4,tim=85264276
use strict;
use warnings;
my $cid; # cursor id
my %ela; # $ela{event} contains sum of ela statistics for event
my $sum_ela = 0; # sum of all ela times across events
my $r = 0; # response time for database call
my $action = "(?:PARSE|EXEC|FETCH|UNMAP|SORT UNMAP)";
while (<>) {
if (/^WAIT #(d+): nam='([^']*)' ela=s*(d+)/i) {
$ela{$2} += $3;
$sum_ela += $3;
}
elsif (/^$action #(d+):c=(d+),e=(d+)/i) {
$ela{"total CPU"} += $2;
$r = $3;
}
if (!defined $cid) {
$cid = $1;
} else {
die "can't mix data across cursor ids $cid and $1" if $1 != $cid;
}
}
$ela{"unaccounted-for"} = $r - ($ela{"total CPU"} + $sum_ela);
printf "%9s %6s %-40s
", "Duration", "Pct", "Oracle kernel event";
printf "%8s- %5s- %-40s
", "-"x8, "-"x5, "-"x40;
printf "%8.2fs %5.1f%% %-40s
", $ela{$_}/100, $ela{$_}/$r*100, $_ for sort { $ela{$b}
<=> $ela{$a} } keys %ela;
printf "%8s- %5s- %-40s
", "-"x8, "-"x5, "-"x40;
printf "%8.2fs %5.1f%% %-40s
", $r/100, 100, "Total response time";Note the row labeled “unaccounted-for” in our resource profile.
Consider how it was computed. The total elapsed time—in fact the
response time—for the fetch call is simply the
value of e for the fetch. The raw
trace data account for this response time in two ways:
The total CPU time component of the fetch call’s response time is recorded as the
cstatistic on theFETCHline itself.The system-call time components of the response time are recorded as
elastatistics on all of theWAITlines associated with the fetch.
The “unaccounted-for” duration is thus the leftover amount Δ (delta) expressed in the following formula:
How Oracle response time accounting has evolved since Oracle
Version 6 is an interesting story. In Version 6, Oracle’s SQL trace
facility printed database call response times (e) and CPU consumptions (c) to the trace file, but that was the
only response time data that the Oracle kernel
published. The first Oracle response time model was simple. It was
“response time equals CPU consumption plus some unidentified other
stuff,” or:
e = c + Δ
This model is effective when Δ is small, but it is not reliable for diagnosing many types of response time problems that occur when Δ is large. In the Version 6 days, most analysts were taught to assume that large values of Δ were attributable to time consumed by operating system read calls. This assumption is often incorrect (as was the case in the resource profile shown previously), but it has helped analysts solve many application performance problems. One reason for the model’s success in spite of its over-simplicity is that so many Oracle application problems are caused by fetch calls that access the database buffer cache excessively. These cases create small Δ values for which the e = c + Δ model works just fine.
Oracle kernel developers were among the first to encounter the
most serious inadequacies of the model. The range of potential root
causes for large Δ values was so large that some important high-end
response time problems simply could not be solved without more
operational data. Oracle’s extended SQL trace
data, introduced to the general market in 1992 with release 7.0.12, is
an elegant solution to the problem. Extended SQL trace data include
those WAIT lines that tell us how
much time the Oracle kernel spends “waiting” for the execution of key
events. The new, significantly improved response time model made
possible by the new extended SQL trace feature of Oracle release
7.0.12 is the one that we use today:
As it happens, extended SQL trace data provide significantly more diagnostic power than most analysts have ever believed. Of the few analysts who even realize that the gap Δ exists, some deem the existence of the gap a deficiency of extended SQL trace data that renders the data unreliable. On the contrary, as you shall see, there is good information buried in the value of Δ. There are several contributory causes of non-zero Δ values, as I explain in Chapter 7. Understanding these causes helps you exploit the full diagnostic power of Oracle’s extended SQL trace data.
Walking the Clock
As you try to extract response time information from raw trace data, you’ll need to be able to interpret the time sequence of events using a process we call “walking the clock.” Walking the clock requires a few pieces of knowledge about how the Oracle kernel manages time data:
The value of a line’s
timfield is the approximate time at which the action represented by that line completed.A database call’s
efield value contains the total elapsed time consumed by that action. This value includes both the CPU time consumed by the action (the value of thecfield) and the time consumed by events executed during the course of the action (the sum of the appropriateelafield values).Recursive SQL causes double-counting. That is, the value of a database call’s
efield whendep=n + 1 is already included in the subsequentevalue for whichdep=n.Don’t expect perfection from clock walks. Off-by-one errors are common in Oracle8i trace files. Errors of seemingly much greater magnitude are common in Oracle9i trace files; however, with the microsecond timing resolution of Oracle9i, the errors are smaller than they look.
Oracle Release 8 and Prior
Here is an example of some trace data that will demonstrate how to walk the clock through trace files emitted by Oracle8i and prior kernels:
EXEC #13:c=0,e=0,p=0,cr=0,cu=0,mis=0,r=0,dep=2,og=3,tim=198360834 FETCH #13:c=0,e=0,p=0,cr=3,cu=0,mis=0,r=1,dep=2,og=3,tim=198360834 EXEC #12:c=2,e=4,p=0,cr=27,cu=0,mis=0,r=0,dep=1,og=4,tim=198360837 FETCH #12:c=2,e=10,p=10,cr=19,cu=4,mis=0,r=1,dep=1,og=4,tim=198360847
Table 5-7 shows the associated clock-walk.
Line (k) | e | Predicted tim k = tim k-1+ e k | Actual tim k | Error |
1 | 0 | 198360834 | ||
2 | 0 | 198360834 + 0 = 198360834 | 198360834 | 0 |
3 | 4 | 198360834 + 4 = 198360838 | 198360837 | 1 |
4 | 10 | 198360837 + 10 = 198360847 | 198360847 | 0 |
Occasionally, there’ll be an off-by-one error such as the one that distinguishes the predicted tim value in line 3 from the actual tim value found there. Don’t let a ±1-cs error disturb you. Oracle8i kernels round their time values to the nearest centisecond, so what appeared to be the addition of ...834 + 4 might actually have been the addition of ...833.7048 + 3.5827, which after rounding would have produced the observed value of ...837.
The following Oracle8i trace file excerpt contains database calls and wait events:
PARSE #494:c=4,e=5,p=11,cr=88,cu=0,mis=1,r=0,dep=2,og=0,tim=3864619462 WAIT #494: nam='latch free' ela= 2 p1=-2147434220 p2=95 p3=0 WAIT #494: nam='latch free' ela= 2 p1=-2147434220 p2=95 p3=1 EXEC #494:c=0,e=4,p=0,cr=0,cu=0,mis=0,r=0,dep=2,og=4,tim=3864619466 FETCH #494:c=0,e=0,p=0,cr=2,cu=0,mis=0,r=1,dep=2,og=4,tim=3864619466
Table 5-8
shows the clock-walk of these lines. In the walk for this excerpt,
notice that I’ve assigned k
labels only to database call lines (not the WAIT lines). It’s okay to track the
anticipated progress of the tim
clock during wait events, but remember that the e value in a database call already
includes the time recorded in ela values for wait events motivated by
the database call. Therefore, the basis for predicting a tim k value for a
database call is always the tim
k -1 from the prior
database call line.
Line (k) | e | Predicted tim k = tim k-1 + e k | Actual tim k | Error |
1 | 5 | 3864619462 | ||
2 | 3864619462 + 2 = 3864619464 | |||
2 | 3864619464 + 2 = 3864619466 | |||
2 | 4 | 3864619462 + 4 = 3864619466 | 3864619466 | 0 |
3 | 0 | 3864619466 + 0 = 3864619466 | 3864619466 | 0 |
Now for a tricky excerpt to make sure that you’re paying
attention. Can you explain why the actual tim value of 198360796 in the EXEC #8 line is so different from the
value you might have expected, 198360795 + 19 = 198360814?
EXEC #9:c=0,e=0,p=0,cr=0,cu=0,mis=0,r=0,dep=2,og=3,tim=198360795 FETCH #9:c=0,e=0,p=0,cr=3,cu=0,mis=0,r=1,dep=2,og=3,tim=198360795 EXEC #9:c=0,e=0,p=0,cr=0,cu=0,mis=0,r=0,dep=2,og=3,tim=198360795 FETCH #9:c=0,e=0,p=0,cr=3,cu=0,mis=0,r=1,dep=2,og=3,tim=198360795EXEC #8:c=4,e=19,p=16,cr=162,cu=0,mis=0,r=0,dep=1,og=4,tim=198360796FETCH #8:c=0,e=5,p=4,cr=4,cu=0,mis=0,r=1,dep=1,og=4,tim=198360801 FETCH #8:c=0,e=0,p=0,cr=0,cu=0,mis=0,r=0,dep=1,og=0,tim=198360801 FETCH #7:c=0,e=0,p=0,cr=2,cu=0,mis=0,r=1,dep=1,og=4,tim=198360801 EXEC #8:c=0,e=0,p=0,cr=0,cu=0,mis=0,r=0,dep=1,og=4,tim=198360801
The answer is that the EXEC
#8 database call is the dep=1 recursive parent of each of the
dep=2 actions shown here on
cursor #9. Therefore, the
e=19 field contains all of the
cursor #9 e values shown here
plus some other time-consuming activities that are
not shown here. The EXEC #8 action probably began very near
tim 198360796 - 19 = 198369777.
Between tim values ...777 and
...796, lots of dep=2 actions
took place, each consuming time while the tim clock advanced. But remember, these
dep=2 actions all took place
during the single EXEC
#8 action.
Oracle Release 9
The microsecond output resolution of time statistics in Oracle9i is a helpful enhancement. The first thing you’ll notice about SQL trace data when you upgrade to Oracle9i is that the microsecond resolution feature provides real data for cases in which Oracle8i would have emitted lots of zero values.
Tip
However, do not hesitate to use extended SQL trace data with Version 8 or even Version 7 systems. The optimization method described in this book does work reliably for diagnostic data expressed in centiseconds. In the vast majority of real-life performance improvement projects, the microsecond output resolution of Oracle9i is merely a luxury.
The new resolution has allowed us to see a little more clearly into the Oracle kernel’s behavior. This section describes a few cases in which we’ve been able to learn more as a result of the Oracle kernel’s improved output resolution.
Walking the clock in Oracle9i trace files requires a little more patience. The first difference you’ll notice is that the numbers are all so much larger that it’s quite a bit more difficult to do the walk in your head. For example:
EXEC #1:c=0,e=1863,p=0,cr=0,cu=0,mis=0,r=0,dep=1,og=4,tim=1017039275956134 FETCH #1:c=0,e=2566,p=0,cr=23,cu=0,mis=0,r=1,dep=1,og=4,tim=1017039275958821 FETCH #1:c=0,e=50,p=0,cr=0,cu=0,mis=0,r=1,dep=1,og=4,tim=1017039275959013 FETCH #1:c=0,e=34,p=0,cr=0,cu=0,mis=0,r=1,dep=1,og=4,tim=1017039275959155 FETCH #1:c=0,e=34,p=0,cr=0,cu=0,mis=0,r=1,dep=1,og=4,tim=1017039275959293 FETCH #1:c=0,e=35,p=0,cr=0,cu=0,mis=0,r=1,dep=1,og=4,tim=1017039275959433
The next thing that you might notice is that the numbers don’t add up. Observe the large numbers that show up in the “Error” column of Table 5-9.
Line (k) | e | Predicted tim k = tim k-1 + e k | Actual tim k | Error |
1 | 1863 | ...956134 | ||
2 | 2566 | ...956134 + 2566 = ...958700 | ...958821 | |
3 | 50 | ...958821 + 50 = ...958871 | ...959013 | |
4 | 34 | ...959013 + 34 = ...959047 | ...959155 | |
5 | 34 | ...959155 + 34 = ...959189 | ...959293 | |
6 | 35 | ...959293 + 35 = ...959328 | ...959433 | |
The sensation produced by these large error values is quite
horrific until you realize that the errors are expressed in
microseconds. Small time gap errors like this have always been
present in Oracle diagnostic data. They were usually invisible when
measured with centisecond resolution. When we view microsecond
timing data, the impact of another type of response time measurement
error becomes apparent: the calls to gettimeofday and getrusage consume elapsed time that the
calls themselves do not measure (see the Chapter 7 discussion of the
measurement intrusion effect).
In Oracle9i trace files,
you might notice the “disturbing” fact that not all trace lines are
listed in ascending time order. Specifically, the tim value for a PARSING IN CURSOR section always occurs in
the future relative to the tim
value of the database call immediately following the PARSING IN CURSOR section. For
example:
PARSING IN CURSOR #1 len=32 dep=0 uid=5 oct=42 lid=5 tim=1033050389206593hv=1197935484 ad='50f93654' alter session set sql_trace=true END OF STMT EXEC #1:c=0,e=33,p=0,cr=0,cu=0,mis=0,r=0,dep=0,og=4,tim=1033050389204497
You can confirm why this occurs by tracing the wait events of
an Oracle kernel process with strace or a similar tool. The Oracle
kernel finishes processing the EXEC call before it begins computing the
information for the PARSING IN
CURSOR section. But then the kernel
prints the PARSING IN
CURSOR section before it prints the EXEC line. Hence, the times appear out of
order.
You’ll find that the Oracle8i kernel does things in this order as well. You just didn’t notice, because the centisecond statistics emitted by Oracle8i in most cases concealed the true time sequence information from you. With the microsecond statistics emitted by Oracle9i, the order becomes apparent.
Clock Walk Formulas
After having seen a few clock-walk examples, you have
probably caught onto the formula. As long as you remember not to
double-count in the presence of different levels of recursive
database calls, then the values of the tim and e fields bear the following
relationship:
| tim k+1 ≈ tim k + e k+1 |
That is, the following line’s tim field value is approximately this
line’s tim field value plus the
following line’s e field value.
Equivalently, you can write:
| tim k ≈ tim k+1 - e k+1 |
That is, the current line’s tim field value approximately equals the
following line’s tim field value
minus the following line’s e
field value.
Of course, a WAIT line has
no tim field, so if you want to
estimate what a WAIT line’s
tim value would be, you have to
estimate it by walking the clock forward from the most recently
available tim value, using the
relationship:
| tim k+1 ≈ tim k + ela k+1 |
These formulas will come in handy when you learn how to correct for data collection error in Chapter 7.
Forward Attribution
When you identify a time-consuming wait event in an Oracle
extended SQL trace file, your next task will be to determine which
application action you might modify to reduce the time consumption.
Doing this with extended SQL trace data is straightforward. You should
attribute each WAIT # n duration to the first database call for
cursor # n that follows the
WAIT line in the trace file. I call
this method forward attribution. Forward
attribution helps you accurately identify which application SQL is
responsible for motivating the wait time. Perhaps remarkably, forward
attribution works both for events that are executed
within database calls and for events that are
executed between database calls.
Forward Attribution for Within-Call Events
For events executed within database calls, the reason for forward attribution is easy to understand. Because lines are written to the trace file as their corresponding actions complete, the wait events executed by a given database call appear in the trace stream before the call’s trace file line. The following excerpt (snipped from Example 5-3) shows how the Oracle kernel emits within-call event lines:
= = = = = = = = = = = = = = = = = = = = = PARSING IN CURSOR #4 len=132 dep=1 uid=0 oct=3 lid=0 tim=1033064137929238 hv=3111103299 ad='517ba4d8' select /*+ index(idl_ub1$ i_idl_ub11) +*/ piece#,length,piece from idl_ub1$ where obj#=:1 and part=:2 and version=:3 order by piece# END OF STMT PARSE #4:c=0,e=306,p=0,cr=0,cu=0,mis=0,r=0,dep=1,og=4,tim=1033064137929139 EXEC #4:c=0,e=146,p=0,cr=0,cu=0,mis=0,r=0,dep=1,og=4,tim=1033064137931262 [1]WAIT #4: nam='db file sequential read' ela= 13060 p1=1 p2=53903 p3=1 [2]WAIT #4: nam='db file sequential read' ela= 6978 p1=1 p2=4726 p3=1 [3]FETCH #4:c=0,e=21340,p=2,cr=3,cu=0,mis=0,r=0,dep=1,og=4,tim=1033064137953092
In this example, the db file
sequential read events on lines [1] and [2]
were executed within the context of the FETCH depicted on line [3].
Forward Attribution for Between-Call Events
For events executed between
database calls, the reason that forward attribution works is more
subtle. The following Oracle8i
example (snipped from Example
5-4) helps to illustrate the issue. Because of a database
driver deficiency, this application actually submitted each parse
call to the database two times.[2] Notice the identical PARSING
IN CURSOR sections separated by a to/from
SQL*Net message pair:
= = = = = = = = = = = = = = = = = = = = =
PARSING IN CURSOR #9 len=360 dep=0 uid=26 oct=2 lid=26 tim=1716466757 hv=2475520707
ad='d4c55480'
INSERT INTO STAGING_AREA (TMSP_LAST_UPDT, OBJECT_RESULT, USER_LAST_UPDT, DOC_OBJ_ID,
TRADE_NAME_ID, LANGUAGE_CODE) values(TO_DATE('11/05/2001 16:39:06', 'MM/DD/YYYY HH24:
MI:SS'), 'if ( exists ( stdphrase ( "PCP_MAV_1" ) ) , langconv ( "Incompatibility
With Other Materials" ) + ": " , log_omission ( "Materials to Avoid: " ) )', 'sa',
222, 54213, 'NO_LANG')
END OF STMT
PARSE #9:c=0,e=0,p=0,cr=0,cu=0,mis=1,r=0,dep=0,og=4,tim=1716466757
[1]WAIT #9: nam='SQL*Net message to client' ela= 0 p1=1413697536 p2=1 p3=0
[2]WAIT #9: nam='SQL*Net message from client' ela= 3 p1=1413697536 p2=1 p3=0
= = = = = = = = = = = = = = = = = = = = =
PARSING
                  IN
CURSOR #9 len=360 dep=0 uid=26 oct=2 lid=26 tim=1716466760 hv=2475520707
ad='d4c55480'
INSERT INTO STAGING_AREA (TMSP_LAST_UPDT, OBJECT_RESULT, USER_LAST_UPDT, DOC_OBJ_ID,
TRADE_NAME_ID, LANGUAGE_CODE) values(TO_DATE('11/05/2001 16:39:06', 'MM/DD/YYYY HH24:
MI:SS'), 'if ( exists ( stdphrase ( "PCP_MAV_1" ) ) , langconv ( "Incompatibility
With Other Materials" ) + ": " , log_omission ( "Materials to Avoid: " ) )', 'sa',
222, 54213, 'NO_LANG')
END OF STMT
[3]PARSE #9:c=0,e=0,p=0,cr=0,cu=0,mis=0,r=0,dep=0,og=4,tim=1716466760 Even though the parse calls were routinely inexpensive
(note the two e=0 durations
highlighted in the example), the response time for the overall user
action suffered brutally from the tremendous number of unnecessary
SQL*Net message from client
executions, which consumed an average of over 0.027 seconds per
call. The overall impact to response time was several minutes on a
user action that should have consumed less than 10 seconds in total
(see Section 12.3).
To eliminate the SQL*Net event
executions shown on lines [1] and
[2], you can eliminate the parse
call depicted on line [3] that
follows it. In general, the database call that has “caused” a
between-call event is the database call whose trace file line
follows the WAIT.
Detailed Trace File Walk-Through
At the beginning of this chapter, I promised you a detailed walk-through of the trace file displayed in Example 5-2. Now it is time for the full tour.
Each SQL trace file begins with a preamble that describes information about the file such as the file name, the Oracle release, and various elements describing the system environment and the session being traced. Here is the preamble from Example 5-2:
/u01/oradata/admin/V901/udump/ora_9178.trc Oracle9i Enterprise Edition Release 9.0.1.0.0 - Production With the Partitioning option JServer Release 9.0.1.0.0 - Production ORACLE_HOME = /u01/oradata/app/9.0.1 System name: Linux Node name: research Release: 2.4.4-4GB Version: #1 Fri May 18 14:11:12 GMT 2001 Machine: i686 Instance name: V901 Redo thread mounted by this instance: 1 Oracle process number: 9 Unix process pid: 9178, image: oracle@research (TNS V1-V3)
After the preamble, the Oracle kernel emitted information that identifies the time and the session at which the first trace line was emitted:
*** SESSION ID:(7.6692) 2002-12-03 10:07:40.051
The next line reveals information about the module and action
names that were set with DBMS_APPLICATION_INFO by the client program,
which in my case was SQL*Plus:
APPNAME mod='SQL*Plus' mh=3669949024 act='' ah=4029777240
The first actual action that the kernel recorded in the trace
file was the execution of the ALTER
SESSION command. The kernel did not emit information about
the parse of the ALTER SESSION
command, because tracing wasn’t enabled until after the parse had
completed. Conveniently, the Oracle kernel emitted a section
describing the cursor being acted upon by the execute call, before it
emitted the information about the EXEC call itself. The execute call did very
little work. The e=1 string
indicates that the call consumed only 1 microsecond (1 μs = 0.000 001
seconds) of elapsed time.
= = = = = = = = = = = = = = = = = = = = = PARSING IN CURSOR #1 len=69 dep=0 uid=5 oct=42 lid=5 tim=1038931660052098 hv=1509700594 ad='50d6d560' alter session set events '10046 trace name context forever, level 12' END OF STMT EXEC #1:c=0,e=1,p=0,cr=0,cu=0,mis=0,r=0,dep=0,og=4,tim=1038931660051673
When the execution of the ALTER
SESSION command completed, the Oracle kernel shipped the
result back to the client program by writing to a socket controlled by
the SQL*Net driver. The elapsed duration of this write call was 5 μs.
WAIT #1: nam='SQL*Net message to client' ela= 5 p1=1650815232 p2=1 p3=0
Upon completing the write
call, the Oracle kernel issued a read upon the same socket (note that the
p1 values for both the write and the read are the same), and the kernel awaited
the next request from its client program. Approximately 1,262 μs after
issuing the read call, the read call returned with another request for
the kernel.
WAIT #1: nam='SQL*Net message from client' ela= 1262 p1=1650815232 p2=1 p3=0
The request received by the read of the socket was in fact the
instruction to parse my “Hello, world” query. Note that before
printing the PARSE statistics, the
kernel helpfully emitted a section beginning with a sequence of
"=" characters and ending with the
string END OF STMT that describes
the cursor being parsed. The parse call itself consumed 214 μs of
elapsed time.
= = = = = = = = = = = = = = = = = = = = = PARSING IN CURSOR #1 len=51 dep=0 uid=5 oct=3 lid=5 tim=1038931660054075 hv=1716247018 ad='50c551f8' select 'Hello, world; today is '||sysdate from dual END OF STMT PARSE #1:c=0,e=214,p=0,cr=0,cu=0,mis=0,r=0,dep=0,og=4,tim=1038931660054053
The next database call is EXEC, which denotes the execution of the
cursor that the kernel had parsed. Immediately preceding the EXEC line is an empty BINDS section, which indicates that although
the SQL*Plus program requested a bind operation, there was nothing in
the statement for the kernel to bind. Total
elapsed time for the execution: 124 μs.
BINDS #1: EXEC #1:c=0,e=124,p=0,cr=0,cu=0,mis=0,r=0,dep=0,og=4,tim=1038931660054311
At the conclusion of the EXEC
call, the kernel shipped a result back to the client program (that is,
the SQL*Plus program). The write to the socket consumed 5 μs of
elapsed time.
WAIT #1: nam='SQL*Net message to client' ela= 5 p1=1650815232 p2=1 p3=0
Immediately following the write to the socket, the kernel’s next
action was a fetch operation. The FETCH statistics show an elapsed duration of
177 μs to return one row (r=1),
which required three reads of the database buffer cache, one in
consistent mode (cr=1) and two in
current mode (cu=2).
FETCH #1:c=0,e=177,p=0,cr=1,cu=2,mis=0,r=1,dep=0,og=4,tim=1038931660054596
The next database call recorded in the trace file is another fetch, which took place after a 499-μs read from the SQL*Net socket. The fetch returned no rows and consumed only 2 μs of elapsed time.
WAIT #1: nam='SQL*Net message from client' ela= 499 p1=1650815232 p2=1 p3=0 FETCH #1:c=0,e=2,p=0,cr=0,cu=0,mis=0,r=0,dep=0,og=0,tim=1038931660055374
Next, the kernel shipped a result back to the client in a socket write operation that consumed 4 μs of elapsed time.
WAIT #1: nam='SQL*Net message to client' ela= 4 p1=1650815232 p2=1 p3=0
After shipping back the fetch result to the client, the kernel
sat idle awaiting its next request. It didn’t wait long. Only 1,261 μs
after initiating the SQL*Net socket read, the read call was complete.
WAIT #1: nam='SQL*Net message from client' ela= 1261 p1=1650815232 p2=1 p3=0
The instruction that the read
call delivered to the kernel resulted in the closing of the “Hello,
world” cursor and finally the end of the read-only transaction. Upon
cursor close, the kernel helpfully emitted a STAT line that indicates the execution plan
that the query optimizer had chosen for executing my query. In this
case, my query had motivated a full-table scan of DUAL.
STAT #1 id=1 cnt=1 pid=0 pos=0 obj=221 op='TABLE ACCESS FULL DUAL ' XCTEND rlbk=0, rd_only=1
As you can see, the Oracle kernel did quite a bit of work to fulfill the requirements of even my trivial SQL*Plus session. For performance problems on real-life systems, you can imagine the significant leap in trace file complexity. But even this simple example shows some of the actions that occur within database calls and some of the actions that occur between database calls. These actions are the building blocks that comprise the much larger and more complex trace files that you’ll encounter in real life.
Exercises
In Example 5-8, which
WAITlines refer to wait events made within database calls, and which refer to wait events made between database calls? Describe how eachc,e, andelastatistic shown fits into the relationship e ≈ c + Σ ela.
...Many WAIT #1 lines are omitted for clarity... = = = = = = = = = = = = = = = = = = = = = PARSING IN CURSOR #1 len=253 dep=0 uid=18 oct=3 lid=18 tim=1024427939516845 hv=1223272015 ad='80cbc5b8' ...SQL text is omitted for clarity... END OF STMT PARSE #1:c=60000,e=55973,p=3,cr=44,cu=6,mis=1,r=0,dep=0,og=4,tim=1024427939516823 EXEC #1:c=0,e=140,p=0,cr=0,cu=0,mis=0,r=0,dep=0,og=4,tim=1024427939517471 WAIT #1: nam='SQL*Net message to client' ela= 15 p1=1650815232 p2=1 p3=0 WAIT #1: nam='db file sequential read' ela= 678 p1=7 p2=11146 p3=1 WAIT #1: nam='db file sequential read' ela= 815 p1=7 p2=11274 p3=1 FETCH #1:c=200000,e=259460,p=2,cr=12,cu=24,mis=0,r=1,dep=0,og=4,tim=1024427939777318 WAIT #1: nam='SQL*Net message from client' ela= 1450 p1=1650815232 p2=1 p3=0 WAIT #1: nam='SQL*Net message to client' ela= 5 p1=1650815232 p2=1 p3=0 FETCH #1:c=0,e=339,p=0,cr=0,cu=0,mis=0,r=12,dep=0,og=4,tim=1024427939779621 WAIT #1: nam='SQL*Net message from client' ela= 7828 p1=1650815232 p2=1 p3=0 ...STAT lines are omitted for clarity... = = = = = = = = = = = = = = = = = = = = = PARSING IN CURSOR #1 len=55 dep=0 uid=18 oct=42 lid=18 tim=1024427939789693 hv=3381932903 ad='80c9e33c' alter session set events '10046 trace name context off' END OF STMT PARSE #1:c=0,e=810,p=0,cr=0,cu=0,mis=1,r=0,dep=0,og=4,tim=1024427939789677
For Example 5-9, construct a graph like the one shown in Figure 5-3 that illustrates the recursive relationships among database calls. Compute the contribution to
eof each database call. What type of application would perform the actions shown here?
/u01/oradata/admin/V901/udump/ora_23317_recursive.trc
*** TRACE DUMP CONTINUED FROM FILE ***
Oracle9i Enterprise Edition Release 9.0.1.0.0 - Production
With the Partitioning option
JServer Release 9.0.1.0.0 - Production
ORACLE_HOME = /u01/oradata/app/9.0.1
System name: Linux
Node name: research
Release: 2.4.4-4GB
Version: #1 Fri May 18 14:11:12 GMT 2001
Machine: i686
Instance name: V901
Redo thread mounted by this instance: 1
Oracle process number: 9
Unix process pid: 23317, image: oracle@research (TNS V1-V3)
*** 2003-05-18 11:14:59.469
*** SESSION ID:(8.1578) 2003-05-18 11:14:59.469
APPNAME mod='SQL*Plus' mh=3669949024 act='' ah=4029777240
= = = = = = = = = = = = = = = = = = = = =
PARSING IN CURSOR #1 len=68 dep=0 uid=5 oct=42 lid=5 tim=1053274499469370 hv=1635464953
ad='51f65c00'
alter session set events '10046 trace name context forever, level 1'
END OF STMT
EXEC #1:c=0,e=1,p=0,cr=0,cu=0,mis=0,r=0,dep=0,og=3,tim=1053274499469133
= = = = = = = = = = = = = = = = = = = = =
PARSING IN CURSOR #2 len=175 dep=1 uid=0 oct=3 lid=0 tim=1053274499471797 hv=1491008679
ad='52107fa8'
select u.name,o.name, t.update$, t.insert$, t.delete$, t.enabled from obj$ o,user$
u,trigger$ t where t.baseobject=:1 and t.obj#=o.obj# and o.owner#=u.user# order by o.
obj#
END OF STMT
PARSE #2:c=0,e=91,p=0,cr=0,cu=0,mis=0,r=0,dep=1,og=3,tim=1053274499471765
EXEC #2:c=0,e=160,p=0,cr=0,cu=0,mis=0,r=0,dep=1,og=3,tim=1053274499483293
FETCH #2:c=0,e=32228,p=1,cr=8,cu=0,mis=0,r=1,dep=1,og=3,tim=1053274499515571
FETCH #2:c=0,e=20,p=0,cr=0,cu=0,mis=0,r=0,dep=1,og=3,tim=1053274499515717
= = = = = = = = = = = = = = = = = = = = =
PARSING IN CURSOR #1 len=44 dep=0 uid=5 oct=2 lid=5 tim=1053274499516502 hv=2583883
ad='51f224f8'
insert into t values (1001, rpad(1001,1000))
END OF STMT
PARSE #1:c=0,e=45515,p=1,cr=8,cu=0,mis=1,r=0,dep=0,og=3,tim=1053274499516473
= = = = = = = = = = = = = = = = = = = = =
PARSING IN CURSOR #2 len=22 dep=1 uid=5 oct=3 lid=5 tim=1053274499535321 hv=4140187373
ad='521444c8'
SELECT count(*) from t
END OF STMT
PARSE #2:c=0,e=1003,p=0,cr=0,cu=0,mis=1,r=0,dep=1,og=3,tim=1053274499535287
EXEC #2:c=0,e=115,p=0,cr=0,cu=0,mis=0,r=0,dep=1,og=3,tim=1053274499535550
*** 2003-05-18 11:15:13.212
FETCH #2:
c=3730000,e=13676722,p=127292,cr=127894,cu=260,mis=0,r=1,dep=1,og=3,tim=1053274513212315
EXEC #1:
c=3730000,e=13695999,p=127293,cr=127897,cu=264,mis=0,r=1,dep=0,og=3,tim=1053274513212610
= = = = = = = = = = = = = = = = = = = = =
PARSING IN CURSOR #4 len=52 dep=0 uid=5 oct=47 lid=5 tim=1053274513254792 hv=1697159799
ad='51f59e44'
BEGIN DBMS_OUTPUT.GET_LINES(:LINES, :NUMLINES); END;
END OF STMT
PARSE #4:c=0,e=149,p=0,cr=0,cu=0,mis=0,r=0,dep=0,og=3,tim=1053274513254759
EXEC #4:c=0,e=38900,p=0,cr=0,cu=0,mis=0,r=1,dep=0,og=3,tim=1053274513293822
STAT #2 id=1 cnt=1 pid=0 pos=0 obj=0 op='SORT AGGREGATE '
STAT #2 id=2 cnt=1 pid=1 pos=1 obj=31159 op='TABLE ACCESS FULL T '
XCTEND rlbk=0, rd_only=0Trace a DDL command, such as
DROP
            TABLE
. How many dictionary operations does the Oracle kernel perform implicitly for you when you drop a table? How does the number of operations change if the table being dropped has indexes? What if there are histograms in place on columns? What about constraints? What if the table is involved in a materialized view, or is subject to a security policy?
[1] There are a few inconsequential exceptions to strict chronological ordering, which you shall see shortly.
[2] Lots of drivers provide an option to behave this way. The
extra parse is used to produce a “describe” of the SQL being
parsed, so that the driver can produce more informative error
messages for the developer. Even the Perl DBI behaves this way
by default. In Perl, you can deactivate this behavior by
specifying the ora_check_sql=>0 attribute in
prepare calls.