
Chapter 6. Reports, Mailing Labels, and Charts
It should go without saying that the information you get out of your database is only as useful as the information you put into it. However, we’ve noticed that when people are planning a database, they often fail to budget adequate time for creating reports. While Access’s reporting features are powerful, complex issues lurk behind every decision—and it’s just plain difficult to make your reports look right, too. If your experience is anything like ours, you will spend more time designing reports (previewing and tweaking and previewing again) than you ever intended. And you will be annoyed.
This chapter starts by dissecting general report annoyances—problems that almost everyone will have encountered by the time they’ve created a few reports. Since most Access users turn first to the Report Wizard, we’ll start there—and once we’ve covered the basics, we’ll move on to parameters, memo fields, and other general annoyances. Then we’ll delve into more specialized issues, in the “Page Layout and Printing” and “Sorting, Grouping, and Subreports” sections. Finally, we’ll tackle the knotty problems people encounter in two particularly aggravating areas: mailing labels and charts.
GENERAL REPORT ANNOYANCES
Report Wizard Isn’t Working Its Magic
THE ANNOYANCE: The Report Wizard asks me a lot of questions I don’t know how to answer. Worse, no matter what I do, I can’t get it to create the report I want.
THE FIX: The Report Wizard is a fairly flexible tool, but it does ask a lot of questions—and it doesn’t always help you make the right choices. Moreover, certain types of reports are beyond the capabilities of the Report Wizard, so you may have to either customize the report it creates in Design View, or start from scratch.
Having said that, in most cases the wizard will give you a good head start. To make sure you are getting the most from the Report Wizard, follow these steps:
Choose the right entry point for the wizard. The simplest way to use the Report Wizard is to create an AutoReport—either Columnar (with records appearing one at a time, with labels to the left of each field) or, more commonly, Tabular (with records appearing in a table, row by row, with field labels at the top of each column). If your report will show data from all the fields in a single table or query, try this first: starting in the Database window, click Reports, and then click New. In the New Report dialog box (Figure 6-1), choose "AutoReport: Columnar” or “AutoReport: Tabular.” In the “Choose the table…” drop-down below, select the table or query that contains the data you want to display, and then click ok.
Figure 6-1. The New Report dialog box. You can start the Report Wizard by clicking on “Report Wizard,” or selecting one of the “AutoReport” items.If you need to include some fields but not others, or if you want to group data, don’t use AutoReport. Instead, click “Report Wizard.” Consider these tips as you answer the wizard’s questions:
On the first wizard screen, select the fields you want to appear in your report. You can choose fields from more than one table or query in the Table/Queries drop-down above, as long as you’ve already specified relationships between them. Be sure to select all the fields you want before clicking the Next button.
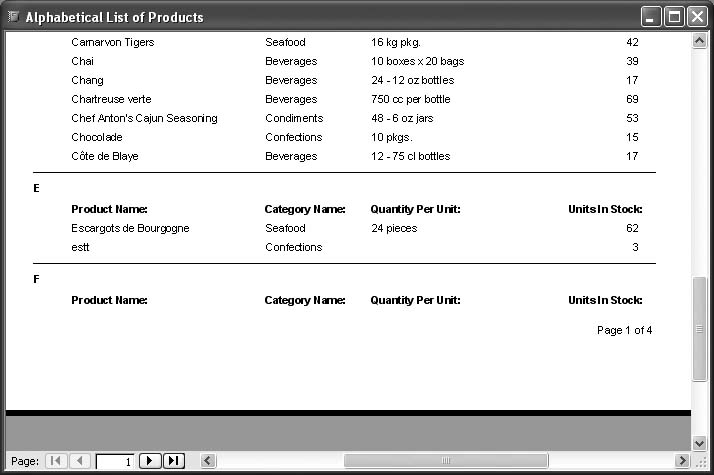
If you specify grouping levels to organize records in the report, you may want to click the Grouping Options button to group by a date range or by one or more letters at the beginning of a field.
If you specify grouping levels, and your data contains numeric fields, the Summary Options button will appear. To display a sum or calculation for each group, click this button and specify the calculations you want the report to perform.
Be sure to specify one or more fields by which to sort records (last name, then first name, for example). If you specify any group levels, the groups will be sorted automatically; what you must specify is the sort order for the records within each group.
If your report contains many fields, they may not fit comfortably on a single page. To reduce crowding, you can choose Landscape orientation, or go back and reduce the number of fields you include. To allow fields to spill onto another page, uncheck the “Adjust the field width so all fields fit on a page” box. When you finish answering the wizard’s questions, preview your new report and decide on any adjustments you’d like to make.
Apply formatting changes, if desired. The Report Wizard offers only a few limited style options for your report. AutoReport doesn’t even give you options; it just uses the style you most recently chose in the Report Wizard. To apply a different format, in report Design View, click Format → AutoFormat. From here, you can select several prefab sets of styles (bold, casual, and so on) that change fonts, borders, and colors.
For still more control, change the formatting manually. Select the desired text boxes or controls, and select a font, size, or alignment from Access’s toolbar. (Hint: to select multiple controls, hold down the Shift key while clicking them, or click in the rulers at the top and left side of the window. You can then change the formatting for a group of controls all at once.) Double-clicking in the ruler will bring up the properties sheet; you can also change the formatting of the selected text boxes and/or controls on the properties sheet’s Format tab (see Figure 6-2).
Adjust field sizes and locations. The Report Wizard tries to guess the proper size for each field or label, but it frequently guesses wrong. In report Design View, select controls and drag their handles to resize them; then drag the controls to the desired spots.
Adjust section heights. When you preview your report, if it has too much vertical space between records, your sections are probably too tall. Drag the bottom of each section to change its height. (See “Too Much Blank Space,” later in this chapter, for more information.)
Get help. For other report ideas, try Access Help. The Report Wizard offers to open Help when the report is complete, but the topic it displays leaves a lot to be desired. Instead, search Help for “report design” (or for a specific topic, such as “report grouping”). For Help on any report or control property, open the properties sheet, click the property, and press F1.


If the wizard gave you a solid head start, continue adjusting your report and consult additional topics in this chapter for solutions to other problems you might encounter. On the other hand, if you can’t use what the wizard created, don’t despair. In the next Annoyance, “Build a Report from Scratch,” we’ll show you how to dump the wizard and do just that—build a report from scratch.
Build a Report from Scratch
THE ANNOYANCE: OK, I gave up on the wizard. I selected Insert → Report, clicked “Design View” and selected a table, then clicked OK…and now I’m staring at a blank report. Where do I start? Access doesn’t provide a lot of help at this stage.
THE FIX: Report Design View is flexible and powerful. If you want more control than the Report Wizard allows, gather your courage and create a new report from scratch. Here are the steps that will keep you on track:
Get the data source right. Before you start your report, decide which tables, fields and records you want it to display. You’ll specify how you want to group and sort in the report itself, but if you need to join tables, filter records, or include calculated fields, create the right queries before you start. When you create the report, select the name of the underlying table or query in the New Report dialog box, or set the Record Source property after you’ve started.
Select control defaults. Before adding fields, decide on the basic format you want for text in your report. To set control defaults, click each of the controls you’re likely to use (text box, label, and so on) in the Toolbox, then click View → Properties. From the Format tab, set the Font Name, Font Size, and other properties to your liking. (For more information, see “Define Your Own Defaults for Forms, Reports, and Controls” in Chapter 1.)
Specify report sections. A blank report includes Page Header and Page Footer sections, where you ordinarily include things like a report’s title and page numbers, respectively. You may also want to view the Report Header or Report Footer sections, which appear only once in a given report. To do so, click View → Report Header/Footer. If you decide not to use one of these sections, set its Height property to 0 so it won’t use space on the page.
Specify sorting and grouping options. Click the Sorting and Grouping button on the toolbar, and add fields on which you want to group or sort data (see Figure 6-3). If you want to display headings or summary fields for a given group, set the Group Header and Group Footer properties to
Yesto display those sections.Add fields using the Toolbox and Field List. Click the Field List button to display the fields in the underlying query or table. Click and drag the desired fields from the list to your report.
Add unbound or calculated controls. Click the Text Box control in the Toolbox, then click the report to create the control. Finally, set the label’s Caption property and the text box’s Control Source property. For example, you could place a control in the Report Footer section, set the label’s Caption to
Total Records, and set the text box’s Control Source to=Count([ID]).Include subreports. When you want a report to combine data from different sets of records, create separate subreports and add them to the main report. Often, you’ll want to include a field on the subreport that links it to the records on the main report. For example, if your main report is based on customer records, you might link to a subreport that displays sales data for each customer. You can also use an unbound main report to combine unrelated subreports, such as subreports for sales totals for the current and previous year.
To add a subreport (once you’ve created it and saved it separately), simply drag it from the Database window to the desired location on your main report. To synchronize records with the current main report record, set the Link Master Fields and Link Child Fields properties of the subreport control to the name of the field that contains matching values in each record. (If the underlying tables are related, Access sets these properties for you.)
Adjust placement and section height. To position fields or labels, click them and then use the arrow keys to drag them where you want them; to resize fields or labels, select them and drag their “handles.” To change the height of a section, drag the bottom of the section up or down. Remember that the height of each repeating section—especially the Detail section—has a big impact on how much whitespace appears between records on the report (and how many pages the report takes up).
Set properties as necessary. Refine your report by setting properties for the overall report, groups, sections, and individual controls. For example, to control how page breaks occur in your report, you can click the Sorting and Grouping button and then set the Keep Together property for sections and groups.
Preview and save frequently. Switch to Print Preview to see if the changes you’re making are having the desired results; if so, return to Design View and click File → Save. If you want to discard changes made since the last time you saved, click File → Revert.

Report Preview Is Too Small
THE ANNOYANCE: Every time I preview a report, I have to reset the window size and zoom in to see what’s going on. Even if I save the report at a larger size, Access opens it small (and completely unreadable) the next time. Why can’t it open the way I want it to?
THE FIX: By default, Access sets every report’s Auto Resize property to “Yes,” which, perversely, usually opens the report in a tiny window.
To fix the problem, open the report in Design View, click View → Properties, and set Auto Resize to “No.” Then set the window size and position to suit yourself, and save the report. From now on, the report will preview at that size (unless the Access window itself is too small, in which case the Print Preview window will be only as large as can fit).
Another solution is to put code in your report’s Open event that will maximize it automatically. If you do this, it’s important to restore the window’s original size (i.e., un-maximize it) when you close the report, because maximizing any window affects all Access windows. Here’s how it works. First, create a new macro, add a single line that uses the Maximize action, and save the macro as “Max.” Next, create another macro with a single line that uses the Minimize action, and save it as “Min.” Then, in each of your reports, call the Max macro from the On Open property (on the Event tab) and the Min macro from the On Close property. To do the same thing with code, place DoCmd.Maximize in the Open event procedure and DoCmd.Minimize in the Close event procedure.
Alas, you can’t save a specific zoom level for previewing a report, or change it during event procedures in the report itself. However, if you open the report in preview mode using code, you can set its zoom level like this:
	DoCmd.OpenReport "Report1", acViewPreview
	DoCmd.RunCommand acCmdZoom150
Voilà! Your report zooms to 150 percent. To select another RunCommand constant, right-click “acCmdZoom150” in the Visual Basic Editor, and click “List Constants.”
Unexpected Parameter Boxes
THE ANNOYANCE: Every time I preview or print my report, the little "Enter Parameter Value” box appears. What did I do to deserve this?
THE FIX: Whenever Access runs a query to display a report, it has to match up all the field names. If there’s a name it doesn’t recognize, it assumes you’ve added this field on purpose and want Access to display the parameter box so you can enter a value.
To stop this annoying behavior, you must find the offending field name. Make sure that all the field names used in the report’s design are spelled correctly and match the actual field names in the underlying tables. Check these areas:
The Control Source property of all the controls on the report
The Field/Expression column in the Sorting and Grouping box
All fields in the report’s Record Source
For more information on this common annoyance, see “Enter Parameter Value” in Chapter 1.
Calculated Field Shows #Error?
THE ANNOYANCE: I entered an expression for a calculated field and it looks right. But when I preview or print the report, the field shows #Error?.
THE FIX: When Access can’t evaluate an expression, it displays #Error? in the field. If your expression was entered properly, your text box probably has the same name as its underlying field. (This happens frequently, because Access names bound controls after the fields they display.) Using a field name for the control causes a circular reference, because you are referring to the control’s name while trying to set its value.
The simplest solution is to rename the control. Double-click the control in Design View to display its properties, and change the value of its Name property on the Other tab. For example, for a text box whose Control Source is =Year([StartDate]), you could change the Name property from StartDate to txtStartYear. This would clear up the confusion and allow Access to evaluate the expression. For more information, see “#Name? and #Error?” in Chapter 1.
Truncated Memo Field
THE ANNOYANCE: I added a text box to my report to display data in a memo field, but the text gets cut off.
THE FIX: Make sure that the text box is big enough to display the data in the memo field. Either resize it manually, or use the properties sheet to set the Can Grow property to “Yes” for both the text box and the report section it’s in. Preview your report to see if the entire memo field’s contents can now be viewed.
Even when there’s room for the memo text, Access will cut it off after 255 characters—under certain conditions. Here’s why, and what to do about it:
- Format property is set.
It doesn’t make sense to use a format setting with a memo field, but you might have set the property inadvertently. Check the Format property of the text box that displays the memo and the Format property of the field in the underlying table. Clear any settings you find.
- Grouping in totals query.
If the underlying query is a totals query, Access truncates fields that are used in grouping data. You might be able to work around the problem by displaying the memo field’s value without grouping by that field.
Open the underlying query in Design View by clicking the report’s properties sheet, selecting the Data tab, and, in the Record Source property, clicking the Build (…) button. Look in the query design grid—if the memo field has “Group By” in the Total row, change it to “First.” This will solve the truncation problem, but the field name will change to FirstOf<MemoFieldName>. Back in report Design View, change the memo field’s Control Source to the new name.
Reports with No Data
THE ANNOYANCE: When I open an empty report—one based on a query that returns no records—the report is completely blank, and its calculated fields display #Error? values. Can’t Access just say that there are no records in the report?
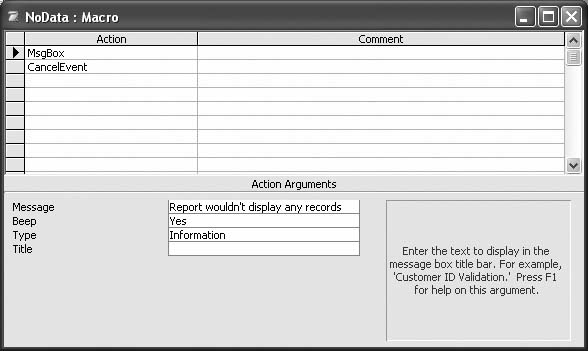
THE FIX: Yes, but to force Access to do this you will need to create a macro or write some VB code. Reports have a NoData event, so you can perform any action you want when there are no records to display. The simplest fix is to click Insert → Macro and create a macro (see Figure 6-4). Use the
MsgBox action to display your message (e.g., “Report wouldn’t display any records”). If you want to prevent the report from printing (or previewing) after the user sees the message, include the
CancelEvent action. Save the macro with a name such as "NoData.” In each report, set the On No Data property (on the Events tab of the report’s properties sheet) to the name of the macro.
If you’d rather use Visual Basic to add code to the report’s NoData event procedure, you can do some fancy stuff. For instance, if you want to prevent the report from printing and have Access issue a clear message, set the Cancel argument to True and add the
MsgBox line shown here:
	Private Sub Report_NoData(Cancel As Integer)
	    MsgBox "The report wouldn't display any data.", vbExclamation
	    Cancel = True
	End Sub
If you want to allow users to print or preview a report, even when it has no data (perhaps you need to file a monthly report even when there’s no activity), you can display a message in the report itself noting that there are no records. To do this, create a label on the report that will display your message, and set its Visible property to “False” (so it won’t ordinarily appear). Then, in the NoData event procedure, use this code to change the property to “True”:
	Private Sub Report_NoData(Cancel As Integer)

	    lblNoDataMessage.Visible = True
	End Sub
Note
If you use the NoData event procedure to prevent a blank report from printing, you may get an "OpenReport action was canceled” message when you cancel the report. For error-handling tips, see the next Annoyance, “Error 2501: The OpenReport Action Was Canceled.”
If there are any controls on the report that cause problems when there are no records (such as calculated controls), hide them the same way (by setting Visible to “False”).
Error 2501: The OpenReport Action Was Canceled
THE ANNOYANCE: I’ve set up the NoData event procedure (as you suggested in the previous Annoyance) to cancel printing when there’s no data. But now, when I click the command button that opens the report, the code is interrupted with an error: “Error 2501: The OpenReport action was canceled.” I canceled the report intentionally; why does this error show up?
THE FIX: Whenever you use DoCmd.OpenReport and then cancel the report as it opens (manually or in code), you’ll see this unhelpful error. To prevent it, use error handling in the procedure that opens the report. Here is an example:
	Private Sub cmdOpenReport_Click()
	On Error GoTo Err_cmdOpenReport_Click

	    DoCmd.OpenReport "rptEmpty", acPreview

	Exit_cmdOpenReport_Click:
	    Exit Sub

	Err_cmdOpenReport_Click:
	    If Err <> 2501 Then
	            MsgBox Err.Description
	    End If
	    Resume Exit_cmdOpenReport_Click

	End Sub
The On Error GoTo statement sets up an “error trap” that redirects code whenever there is an error. If the DoCmd.OpenReport method fails to open the report for any reason, you’ll jump to the bottom section, which displays an error message for unanticipated errors but ignores good old Error 2501.
Filter with Parameters
THE ANNOYANCE: I have a report that I usually want to restrict to specific sets of records—sometimes just one record. For example, I might want the report to show records for just the customer I’m working with. Please don’t tell me I have to save separate reports for each customer!
THE FIX: It depends. If you frequently run a report to display the same subset of records, it makes sense to save a separate version of the report with its own query. If you want a flexible report that can display a different subset of records each time you print it, there are various ways to filter records on the fly.
The simplest way to filter a report is to add one or more parameters to its underlying query. Then, every time you run the report, a parameter box will pop up asking you for the value to use for filtering the records. For example, if you want a report to print records for a specific customer, you could add a parameter for the CustomerID field, and you’d get a parameter box like the one in Figure 6-5.
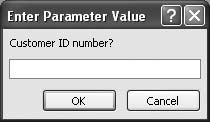
To add a parameter, open the report’s underlying query in Design View. (Open the report’s properties sheet, go to the Data tab, and, in the Record Source property, click the Build button.) In the Criteria row under the field you want to filter, enter the message you want to appear in the parameter box, in square brackets (see Figure 6-6). Pick a descriptive phrase for the parameter name, such as [Customer ID Number?]. To test your parameter, switch to Datasheet View.

Note
Once your parameters are working properly, you may want to display them in your report. For example, if you filter records to display information for just one specific customer, you might want to use that customer’s ID as the title for the report. To do this, just add an unbound text box to the report and set its Control Source to the parameter name. To create an unbound text box, open the report in Design View, click the Text Box button in the Toolbox, then click in the report. An unbound text box will be placed in the report. Right-click it, select “Properties,” and go to the Data tab, where Control Source lives.
To ensure that Access interprets your parameters correctly, it’s always a good idea to declare the parameter’s data type—especially when the parameter doesn’t use the Text data type (for instance, when it’s a date or a number). Click Query → Parameters, and enter the name and data type of each parameter in the query. For more ideas on using parameters, see “User-Friendly Parameter Queries” in Chapter 4.
Using parameters in your query isn’t always the best approach. If you use multiple parameters, you’ll get boxes popping up one after another when you run the report. For a friendlier and more flexible interface, consider these options:
- Let users select a saved query as a filter.
When you open a report using
DoCmd.OpenReport, you can optionally supply the name of a query to use as a filter. The query must include the same tables as the report’s underlying query, but it can include additional criteria to filter records in the report. For example, to filter customer records based on State and Country fields, you could save three queries called "In State,” "Out of State,” and "International.” Then, create a form with a list or combo box that users can use to select one of these queries. On the form, add a command button that uses the following code to generate your report (wherelbxFilterQueryis the name of the list or combo box containing query names):Private Sub cmdOpenReport_Click() DoCmd.OpenReport "rptCustomers", acViewPreview, lbxFilterQuery End Sub
- Apply the current filter from a form.
If you filter records in forms—using the Filter by Form or Filter by Selection buttons on the toolbar, for example—you can give users, via a form, a way to open a report based on the current filtered set of records. To do this, create a button on the form and use the following code in its Click event procedure:
	Private Sub cmdOpenReport_Click()
	   If Len(Me.Filter) > 0 And Me.FilterOn Then
	      DoCmd.OpenReport "rptCustomers", acViewPreview, , Me.Filter
	   Else
	      DoCmd.OpenReport "rptCustomers", acViewPreview
	   End If
	End Sub
- Build a custom WHERE clause to filter the report.
If you need a user-friendly way for users to select the records they want, you can build custom criteria based on the selections they make in a form (see Figure 6-7). This option requires the most work to set up, but it also provides the most intuitive way for users to filter records.

For example, to filter an Orders report by the OrderDate field, you could create a form with text boxes called txtStartDate and txtEndDate. (Tip: set the Default Value properties of these controls to appropriate defaults, such as #1/1/2004# and =Date().) Then, create a button that uses the following code to open
your report:
	Private Sub cmdOpenReport_Click()
	   Dim strWhere As String

	   If IsNull(Me!txtStartDate) Or IsNull(Me!txtEndDate) Then
	      DoCmd.OpenReport "rptOrders", acViewPreview
	   Else
	      ' Build the WHERE clause.
	      strWhere = "[OrderDate] Between #" & Me!txtStartDate & _
	         "# And #" & Me!txtEndDate & "#"
	      DoCmd.OpenReport "rptOrders", acViewPreview, , strWhere
	   End If
	End Sub
Note
Programmers may find it odd that we’re suggesting passing the filter string in the
WhereCondition
argument of
OpenReport
(the fourth argument), rather than in the
FilterName
argument (the third argument). It reveals an inconsistency in the way things are named in Access: the
FilterName
argument must be the name of a saved query, while the
WhereCondition
argument is a string containing criteria (like the form’s Filter property setting).
Here’s how the code works. If the dates are both filled in (i.e., not null), the code builds a WHERE clause that filters records based on the value of the OrderDate field, disregarding any records where the order date is outside the user-specified range. The WHERE clause then gets passed to the OpenReport method as the fourth (WhereCondition) argument, causing a report to be generated with this filter applied.
As you can see, the code must account for cases where the user does not enter both filter values. Your own filtering code will probably be more complex, requiring several lines of code to build the WHERE clause. Your form might include list boxes, option groups, or other controls where users can specify multiple filter values.
When developing this type of code, make sure you test the value of the strWhere variable with all possible entries in the form; if the WHERE clause syntax is invalid, an error will occur.
Tip
In a WHERE clause, always include quotation marks around string values and # signs around dates (see “"Quotes”, #Quotes#, and more #%&@!! “"""Quotes""""” in Chapter 7).
Number Records Consecutively
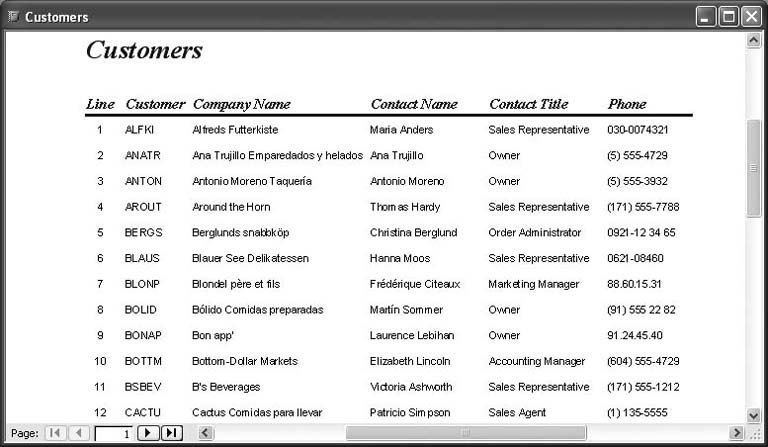
THE ANNOYANCE: I put an ID field on my report because I want records to be numbered. But AutoNumber fields are not always consecutive—numbers get skipped or deleted all the time. Is there a way to number records consecutively on the report?
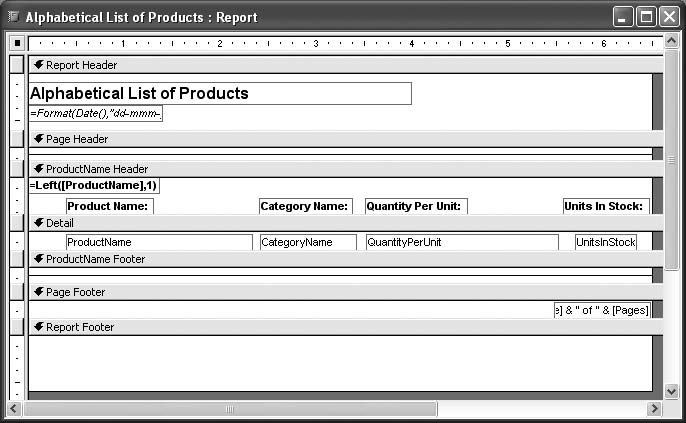
THE FIX: For a report that looks like the one in Figure 6-8, add an unbound text box to the Detail section of the report and place it wherever you want the record numbers to appear. Set its Control Source property to =1 and its Running Sum property to Over Group or Over All.
Export to Word/RTF
THE ANNOYANCE: I exported my report in Rich Text Format (RTF) format and opened it in Microsoft Word. Most of the data is there, but the formatting isn’t the same, some labels and fields are truncated, and lines and charts didn’t come across at all. There must be a better—and more complete—way to move reports into Word.
THE FIX: When you export a report to RTF, or use the Publish It to Microsoft Word button, Access puts your data into a document with a similar layout to your report. This can be useful if you want to send a report to someone who doesn’t use Access, but it seldom produces an accurate rendition of your Access report. Worse, the document may be missing some data. If the exported report is close enough to what you want, you may be able to work around the shortcomings. For example, if fields or labels are truncated in Word, increase their size in Access and export again. If there are lines or boxes on your report, you can recreate them in Word using Format → Borders and Shading. Copy any other missing items into Word, and apply the necessary formatting to make the report look right.
If the exported report is way off, there are several alternatives, depending on your requirements:
- The report must be viewable in Word.
Try Access guru Stephen Lebans’s free ReportUtilities suite (
http://www.lebans.com/ReportUtilities.htm). It will convert your report into a series of Enhanced Metafile (EMF) images embedded in an RTF file, preserving all formatting, layout, and graphics. One downside: the result isn’t editable. One plus: if you have any questions, Lebans actively fields queries and bug reports on the Access newsgroups.- The report must be editable/updatable in Word.
The easiest way to create an editable report is to simply pour the Access data into a Word table. First, “draw” the table in Word. Then, in Word, click View → Toolbars → Database and click the Insert Database button. Follow the steps to specify the data source, query, and formatting options. If you want Word to update the data automatically whenever it changes in Access, check the “Insert Data As Field” box in the Insert Data dialog box. For more information, search Word’s Help for “Access data.”
- You simply want to move data into a Word document.
Don’t go through all this trouble! Just copy records from your Access datasheet and paste them into Word. You’ll get a simple table of records with headings at the top, and you can use Word to format it as you please.
- The report must be viewable anywhere.
From Access, export the report as a Portable Document Format (PDF) file. PDF files are the de facto standard for read-only documents requiring wide distribution. They are viewable with Adobe’s free and ubiquitous Acrobat Reader.
There’s only one catch: Access doesn’t export directly to PDF format, so you’ll need the full version of Adobe Acrobat (the Standard 7.0 edition that goes for a whopping $299), or one of its competitors. There are more affordable alternatives, such as the $49 PDF4U (
http://www.pdf4free.com) and the free CutePDF Writer (http://www.cutepdf.com). Many PDF writers install as print drivers, so to export your Access report, all you do is “print” it, selecting the PDF writer as the “printer.”- Multiple users must export reports in a distributable format.
Installing a PDF writer on every client may not be a viable solution. In this case, Microsoft’s Snapshot (SNP) format may be a better way to go. Like PDFs, SNPs preserve report formatting, and the snapshot viewer is included with Microsoft Office. (If you need to distribute copies to non-Office users, the viewer is freely downloadable; see MSKB 175274). When you export to SNP from Access (File → Export → Save as type), you’ll be prompted to install the snapshot viewer if it’s not already installed.
Give Up and Try Excel Instead
THE ANNOYANCE: I’m an Excel ace but a newbie at Access, and I can’t get my Access report to look right. Can you tell me how to get the data into Excel?
THE FIX: If you’re accustomed to working in Excel, it might make sense to create and format your reports there. To bring Access data from an existing table or query into Excel, in Excel, click Data → Import External Data → Import Data. (In Excel 2000, select Data → Get External Data → New Database Query.) This brings up the Select Data Source dialog box, where you can choose from a variety of data sources—including MDB. Browse to and select the desired MDB file; you’ll then see a series of dialog boxes that let you specify the username and password (if any) for your database and choose which table or query to import. The exact sequence of dialogs you’ll see depends on your setup. The last one will be the Import Data dialog, which lets you specify where in your workbook you want the data to go.
These dialogs are mostly self-explanatory, but there’s one gotcha: Excel’s Select Table dialog (Choose Columns in Excel 2000) won’t list any Access query that uses an expression or function (such as
MonthName) or any user-defined function that Excel doesn’t recognize. If it doesn’t recognize yours, you’ll have to create a version of the query that doesn’t use that function. What a pain in the neck!
When you import data into Excel, Excel links to the Access database so it can update your data automatically. You can specify refresh options by simply right-clicking anywhere in the imported data in the Excel worksheet and selecting “Data Range Properties” (see Figure 6-9). Excel will automatically handle your query or table by adding rows over time. The External Data Range Properties dialog also gives you several options for dealing with new or deleted rows. The default, “Insert cells for new data,” is generally fine, and formulas and charts that refer to your data range will automatically pick up the new cells as well. You can refresh the data manually by right-clicking anywhere in the imported cells and choosing “Refresh Data,” or by clicking the appropriate button on Excel’s External Data toolbar. The Data Range Properties dialog also has other useful settings that cover range names, passwords, and data formatting.

If you won’t need to update your data after moving it into Excel, or if you have an older version of Excel that doesn’t support external data ranges, don’t bother linking to Access—just move the data. You can copy a table or query in the Access Database window (or records in a datasheet) and paste the data into Excel. You can also export data directly to an Excel spreadsheet by selecting a table or query and clicking File → Export. If you have trouble, check out the topics in the “Importing, Linking, and Exporting Data” section in Chapter 3.
PAGE LAYOUT AND PRINTING
Too Much Blank Space
THE ANNOYANCE: My report layout has big, blank gaps that cause it to take up too many pages. I tried setting the Can Shrink property, but the blank space is still there.
THE FIX: Adjusting the vertical space between fields and sections is tricky. It’s even trickier when you use the Can Shrink and Can Grow properties, because in many situations they don’t work as expected.
Note
You’d think that setting a section’s Can Shrink property to “True” would cause any extra blank space in that section to be eliminated. Not so! A section will shrink only to the extent that the controls in it shrink (as described in this section).
The most important factor controlling blank space in your report is the height of each section—especially a repeating section, such as the Detail section. If you leave extra space in the Detail section (see Figure 6-10), it will fill your report with blank spaces. To reduce the vertical spacing in your report, move controls (fields and so on) to the top of each section, and drag the bottom of the section up snugly underneath the controls.

In addition to section height, consider the sizes of the text box controls themselves. A text box must be large enough to accommodate the largest chunk of data stored in that field. But if the fields on your report are occasionally blank, or the length of the data in a field varies a lot from record to record, you don’t want every record to take up enough space to allow its fields to display their largest possible values. Instead, use the Can Shrink and Can Grow properties to adjust the field sizes from record to record. This minimizes blank space. Here are two basic strategies:
- Make the field smaller and use Can Grow.
If most values in a field take just one line, but some contain long values that need more space, double-click the field in Design View to open its properties sheet, and set its Can Grow property (on the Format tab) to “Yes.” You must also set Can Grow to “Yes” for the report section that contains the field (usually the Detail section). Whenever a field is too small for its data, it will expand vertically, expanding its section along with it.
- Make the field larger and use Can Shrink.
If a field is blank, you may not want it to take up any space on the report. In this case, set the Can Shrink property for the field—and its section—to “Yes” (see Figure 6-11). When a line on your report contains only empty fields, blank space will not appear.

Shrinking and growing controls can get tricky. For example, if another control—a label, line, or object—is adjacent to the “shrinking” field, the shrinking field won’t shrink. The simplest solution, of course, is to move the controls so they don’t overlap.
Also, if your field has an attached label, you might expect the label to automatically shrink with the field—but no such luck. You can, however, hide the label whenever the field is empty. First, give the label control a recognizable name that you can refer to, such as “lblNotes.” Then, to hide the label, use code such as this in the Format event for the section containing the field:
	Private Sub Detail_Format(Cancel As Integer, FormatCount As Integer)
	    lblNotes.Visible = Not IsNull(Me.Notes)
	End Sub
Whenever the Notes field is null, this code sets the label’s Visible property to “False” (i.e., hides it), allowing the Notes field and label to shrink.
If the fields you want to shrink are adjacent to a tall object or field that can’t shrink, you can avoid blank lines between them. Create a single text box tall enough to display all the fields together. Then create a VB function in your report module that combines the fields into one string with line breaks. For example, the following function combines four fields—FirstName, LastName, Title, and Office—into a single string with no blank lines:
	Private Function NameTitleOffice() As String
	   NameTitleOffice = ((Me.FirstName & " " & Me.LastName) + _
	      vbNewLine) & (Me.Title + vbNewLine) & Me.OfficeLocation
	End Function
This code avoids blank lines because the + operator, unlike the & operator, evaluates to null if either side is null. To use the function, set the Control Source for the text box to =NameTitleOffice().
Every Other Page Is Blank
THE ANNOYANCE: When I preview or print my report, every other page is blank (or has just a few characters or lines at the left edge). What gives?
THE FIX: Blank or nearly blank pages show up whenever your report’s design is wider than the space available on the page. Access makes it very easy to create this problem, but not so easy to fix it. It typically occurs when you move or resize a control, inadvertently pushing the report width outside the boundaries of the printed page (see Figure 6-12). When you preview or print, Access sees that your report (plus its left and right margins) is too wide for the paper, and it assumes that you want the overflow to appear on a second page. Reports created with a wizard are often set to fill the exact width of the page, so even the slightest increase in report width causes this problem.

Note
This problem can crop up when you print a report on a different printer than the one it was designed for. If your report has very small left or right margin settings, they may be too close to the edge of the page for another printer. In this case, Access will increase the margins and display a message. Every other page will then be blank, because the page will no longer be wide enough for the report. For this reason, avoid using margins smaller than 0.5” for a report that someone else might print.
To avoid the extra pages, use the following simple formula:
| Report width + left margin + right margin <= total page width |
For example, if your report is 6.5” wide and has 1” left and right margins, it will just fit on a standard 8.5"-wide page.
There are two straightforward fixes for the extra-page problem:
- Reduce the width of the report.
Examine the righthand edge of your report in Design View. If any controls extend beyond the others, move them to the left or resize them as necessary. (The Format → Size and Format → Align commands can help here.) Then, drag the righthand edge of any section to the left to resize the report, making it as small as possible.
- Increase the page size.
Click File → Page Setup and decrease the left and right margins, or, on the Page tab, switch to Landscape orientation or select a larger paper size.
Blank Page at End of Report
THE ANNOYANCE: A blank page prints at the end of my report. Why? This is driving me crazy.
THE FIX: Even if a section is completely blank, it can take up space in your report. A blank page at the end of your report indicates that at least one section—most likely the Report Footer section—has extra space at the bottom (see Figure 6-13).
If the Report Footer section contains no controls, set its Height property to 0. If any other section has extra space at the end, drag up the bottom of the section to close the gap.
Column Layout Issues
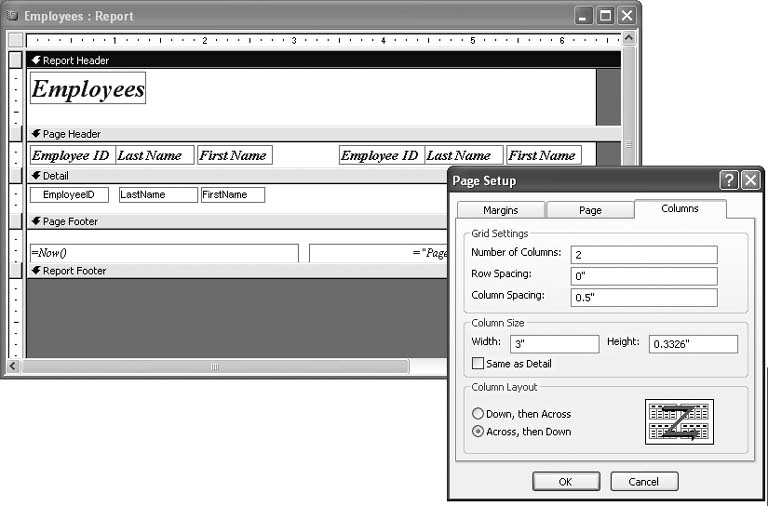
THE ANNOYANCE: My report has only a few fields, so I’m trying to arrange the data in two or three columns (one field to a column) to get more of it on the page. I used File → Page Setup to specify the number of columns and their spacing, but it isn’t working.
THE FIX: Columns aren’t difficult to set up, but there are a couple of tricks that aren’t obvious. For columns to work properly, you must first calculate the amount of space available for each column. In a report with three columns, this formula applies:
| ( column width * 3 ) + ( space between columns * 2 ) + left margin + right margin <= page width |
All the stuff on the left must be either less than or equal to the page width. If it is more, the columns won’t fit on the page.
For example, to fill a standard 8.5” page, you could have three columns, each 2” wide (6” total), with a .25” space between each column (.5” total) and margins of 1” (2” total). You can specify these settings by clicking File → Page Setup and, on the Columns tab, filling in the Number of Columns, Column Spacing, and Width properties.
Back in Design View, arrange just one set of fields at the left side of the report—not one set of fields for each column. Make sure that the fields don’t take up more space than the column width you are shooting for. Reduce the report width to match the column width (by dragging the right side of any section), and you’re all set. In the example above, you would reduce the report width to 2,” but your report would end up filling the entire 8.5” page because of its column settings.
What if you want your header or footer sections to extend across the page? Leave the report at full width, but make sure all the controls in the Detail section are on the far left side (within the space available for the first column). If you didn’t already specify the precise column width, click File → Page Setup, click the Columns tab, uncheck the “Same as Detail” box, and enter the width under “Column Size” (see Figure 6-14).
If your report includes column headings in the Page Header section, you may need to duplicate them across the top of the page, even though the fields themselves appear only at the left. Otherwise, the headers will appear only over the first column.
At Least One Printer Required
THE ANNOYANCE: I bought a new computer and copied my database onto its hard drive. Now I can’t view my reports in Print Preview! I keep getting a message saying that I have to install a printer. What if I don’t want to print from this computer?
THE FIX: Access depends on a printer driver to lay out pages in Print Preview. However, you don’t need to actually connect a printer—just add any printer using the Windows Printers control panel. If there are printers available on your network, installing any network printer will solve this problem.
When you’re installing a “ghost” printer (i.e., one that isn’t connected) in Windows XP, you’ll need to uncheck the “Automatically Detect My Plug and Play Printer” box in order to select a printer from the list. It doesn’t matter which printer you choose, but if other computers in your office use a certain printer, that’s probably a good choice.
Using the Default Printer
THE ANNOYANCE: When I print my report, Access tries to send it to a printer I don’t have access to. I think it was the printer someone in our other office used with the database. Why doesn’t Access use my default printer?
THE FIX: Access lets you save a specific printer (in Page Setup) with each form or report. If that printer is no longer connected, you’d think Access would fall back on your system’s default printer. Think again. In reality, you’ll get an error message every time you try to print the report. To fix the problem, open the report in Design View, click File → Page Setup, click the Page tab, click Default Printer, click OK, and then click File → Save (see Figure 6-15).

If you want to reset the printer settings on all the reports in a given database so they all use the default printer, use the following code (which works in Access 2002 and later):
	Sub ClearPrinterSettings()
	   Dim rpt As AccessObject

	   For Each rpt In CurrentProject.AllReports
	      DoCmd.OpenReport rpt.Name, acViewDesign
	      If Not Reports(rpt.Name).UseDefaultPrinter Then
	         Reports(rpt.Name).UseDefaultPrinter = True
	         DoCmd.Save acReport, rpt.Name
	      End If
	      DoCmd.Close
	   Next rpt
	End Sub
To run this code, enter it into any standard module (Insert → Module), type ClearPrinterSettings in the VB Editor’s Immediate window, and hit Enter. Repeat this procedure in any other database with unwanted printer settings.
For a good article about checking or changing printer settings in Visual Basic, see http://msdn.microsoft.com/library/en-us/dnacc2k2/html/ODC_acc10_Printers.asp.
SORTING, GROUPING, AND SUBREPORTS
Records Aren’t Sorted Like the Underlying Query
THE ANNOYANCE: I opened the query that’s the record source for my report and added a sort order. The query sorts properly, but records in the report are still in the same screwed-up order as before.
THE FIX: Access has several ways of sorting, and it’s often difficult to keep track of them. Setting up sort order or grouping fields via the Sorting and Grouping dialog box overrides any sort instructions in the underlying query. To put records in the desired order, click View → Sorting and Grouping and specify the fields you want to sort.
If you want to change the sort order using Visual Basic—for example, to sort differently each time the report opens—set the SortOrder property of the report’s GroupLevel object. The GroupLevel object is a zero-based array containing an entry for each field that your report groups on, so GroupLevel(0) refers to the first group level, GroupLevel(1) to the second, and so on. It’s hardly intuitive, but to sort in ascending order you set the SortOrder property to False; for descending order, you set it to True. For example, the following code changes the sort order of the report’s first group level based on a sorting box checked in a form:
	Private Sub Report_Open(Cancel As Integer)
	    If Forms!frmOpenReport!chkDescending Then
	            Me.GroupLevel(0).SortOrder = True
	    Else
	            Me.GroupLevel(0).SortOrder = False
	    End If
	End Sub
Note
If you want to sort records on a calculated field, you must include the calculation in the underlying query. Once included, the field will appear in the Field/Expression drop-down in the Sorting and Grouping dialog box (and will work with the Order By property).
To apply an additional sort order after any sorting specified in Sorting and Grouping, set the report’s Order By and Order By On properties. Set Order By to the name of the field you want to sort, or specify multiple field names (separated by commas), following each field name with DESC to sort in descending order; set Order By On to Yes (or True, in code) to apply the sort. You can set these properties in the report’s properties sheet, or use code such as the following:
	Private Sub Report_Open(Cancel As Integer)
	    If Forms!frmOpenReport!chkSortByDate Then
	            Me.OrderBy = "[OrderDate] DESC"
	            Me.OrderByOn = True
	    End If
	End Sub
Orphaned Group Header
THE ANNOYANCE: My report is designed to group records, but sometimes the group headings appear “orphaned” at the bottom of the page while the records start on the next page (see Figure 6-16). How do I avoid this?
THE FIX: To make a group header move to the next page when there isn’t room for any records under it, open the report in Design View, click View → Sorting and Grouping, click the grouping field in the Field/Expression drop-down list, and then set the Keep Together property to “With First Detail” or “Whole Group.”
Beware: if you use “Whole Group,” you may end up with partially empty pages, because the header will move to the next page unless all records in the group fit on the current page. The “With First Detail” setting is a better choice; with this setting, the header starts on a new page only if no records fit underneath.
Subreport Loses Its Headings
THE ANNOYANCE: When I print my subreport on its own, it has a nice header and footer. But when I print the main report, the subreport’s header and footer don’t appear. How can I bring them back?
THE FIX: As you’ve discovered, Access ignores a subreport’s internal Page Header and Page Footer sections when you print a subreport from within a main report. If you want the subreport’s Page Header/Footer controls to appear, move them to the Report Header/Footer or Group Header/Footer sections of the main report.
Total Not Allowed in Page Footer
THE ANNOYANCE: I want to include the count and sum of the orders shown on each page in my report. I placed a text box in the Page Footer section and set its Control Source to calculate the sum, but it displays #Error?.
THE FIX: Access only allows you to calculate aggregate functions per group or per report, not per page. To count and sum the records on each page, you’ll need to add a little VB code to three separate event procedures:
In the Format event of the Page Header section (in the section’s properties sheet, select the Event tab and click the Build button next to the On Format property), add this code:
	Private Sub PageHeaderSection_Format(Cancel As Integer, _
	   FormatCount As Integer)

	   curTotal = 0
	   intCount = 0
	End Sub
In the Print event of the Detail section, add this code:
	Private Sub Detail_Print(Cancel As Integer, PrintCount As Integer)
	   If PrintCount = 1 Then
	      curTotal = curTotal + Me!OrderTotal
	      intCount = intCount + 1
	   End If
	End Sub
In the Format event of the Page Footer section, add this code:
	Private Sub PageFooterSection_Format(Cancel As Integer, _
	   FormatCount As Integer)

	   Me!txtPageTotal = "Page Total: " & Format(curTotal, _
	      "$#,##0") & " (" & intCount & " orders)"
	End Sub
Finally, scroll to the top of the code window. At the top of the report module (outside of any event procedure), type the following code to declare the two variables that keep track of the totals between procedures:
	Dim curTotal As Currency
	Dim intCount As Integer
The Page Header code resets the totals at the beginning of each page, the Detail section code adds values for the current record, and the Page Footer code sets the value of a text box in the page footer that displays the totals (see Figure 6-17).

Crosstab Headings Don’t Match
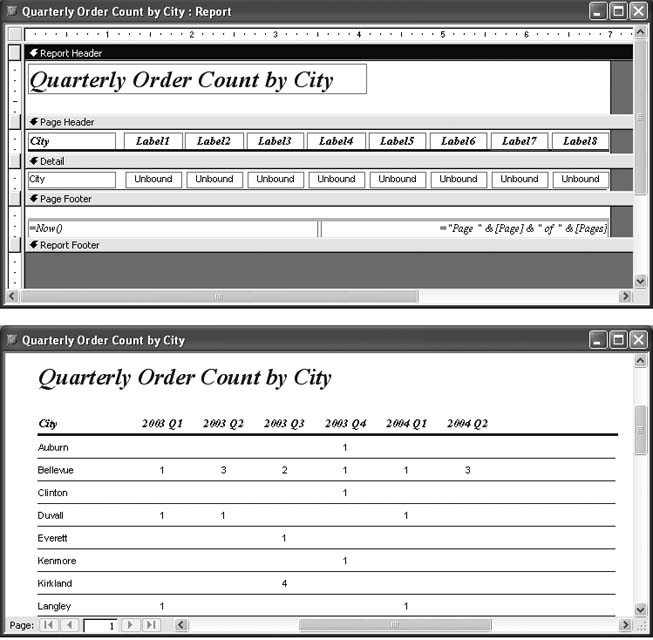
THE ANNOYANCE: I created a report based on a crosstab query. It counts the number of orders by city and splits them into quarterly date ranges. The report worked fine until we moved into a new fiscal year and added records to new date ranges in the query—which meant adding new columns to the crosstab. How can I make sure my report has the same fields as my crosstab query?
THE FIX: A report has a fixed set of fields, even when it’s based on a crosstab query. (See the sidebar “Crosstab Traffic” in Chapter 4.) If the underlying data results in new columns in the crosstab, they won’t be included in the report. Worse, when a report field no longer has an associated column from the query, you’ll get an error when opening the report: “The Microsoft Jet database engine does not recognize <field name>….”
Depending on your requirements, you can choose one of two solutions to this problem.
Fixed Column Headings
If you want the same crosstab columns to appear in your report every time you run it, you can tell your crosstab query to produce those specific fields. For example, if your crosstab totals values for different product categories, you can list the specific categories you want to show in the report. This will avoid errors on the report, because the fields will always match. However, the report won’t include any new columns that are added to the crosstab.
Fixed column headings are especially useful when you expect that some columns might have no data at all. For example, you might include in your report a product category in which you have had no sales. The crosstab query wouldn’t ordinarily include that column, but with fixed column headings you can make sure columns will still appear even when they contain no data.
To specify column headings, open the query in Design View. To display the properties sheet, double-click the background in the window above the query design grid, outside a field list. Set the Column Headings property, enclosing each of the column headings in quotes and separating them with commas. The headings you provide must exactly match the names of your crosstab columns (which are values in the field that you’ve specified as the crosstab’s Column Headings field).
For example, suppose you create a report that counts orders for each city. If your crosstab has columns for quarterly order totals, you might set the Column Headings property to “2003 Q1”,"2003 Q2”,"2003 Q3”,"2003 Q4”(as in Figure 6-18).

Dynamic Column Headings
If you want your report to adapt to changes in crosstab columns, create a report with all unbound text boxes. Then add code that updates all the labels and text boxes when you open the report. Here are the steps:
Create a crosstab query that produces the rows and columns you want. Don’t set the Column Headings property, because you want to use all the current columns each time the query runs.
Create a report with unbound text boxes and generic labels, giving them consistent names, such as Label1, Label2, Label3 and Field1, Field2, Field3. Use enough fields to cover the maximum number of columns that you’ll need. Your code will hide any that don’t get used.
Add code in the report’s Open event procedure that sets the Caption for each label and the Control Source for each text box. The sample code below assumes that your Detail section consists entirely of text boxes—one for the row header field, and an arbitrary number for the column values. If you have additional controls (such as a line control), subtract those from the
intControlsvalue.
	Private Sub Report_Open(Cancel As Integer)
	   Dim rst As DAO.Recordset
	   Dim intFields As Integer
	   Dim intControls As Integer
	   Dim N As Integer

	   ' Open a recordset for the crosstab query.
	   Set rst = CurrentDb.OpenRecordset(Me.RecordSource)

	   ' Find the number of text boxes available in the Detail
	   ' section, minus 2 because we don't count the row header
	   ' control (City) or the line control.
	   intControls = Me.Detail.Controls.Count - 1

	   ' Find the number of fields, minus 1, because we don't
	   ' count the row header field (City).
	   intFields = rst.Fields.Count - 1

	   ' We can't use more than intControls number of fields.
	   If intFields > intControls Then
	      intFields = intControls
	   End If

	   ' Iterate through report fields to set label captions
	   ' and field control sources.
	   For N = 1 To intControls
	      If N <= intFields Then
	         Me.Controls("Label" & N).Caption = _
	            rst.Fields(N).Name
	         Me.Controls("Field" & N).ControlSource = _
	            rst.Fields(N).Name
	      Else
	         ' Hide extra controls.
	         Me.Controls("Label" & N).Visible = False
	         Me.Controls("Field" & N).Visible = False
	      End If
	   Next N
	   rst.Close
	End Sub
Each time the report runs, the current set of fields in the crosstab will appear in the report, while extra fields and labels will be hidden. Figure 6-19 shows the resulting report, in Design View and Print Preview.
MAILING LABELS
Off to See the Wizard
THE ANNOYANCE: In the Database window, I clicked “Create report by using wizard,” but I don’t see any option for creating mailing labels. Where’s this Mailing Label Wizard I’ve heard about?
THE FIX: Access provides shortcuts to the standard Report Wizard, but for labels or charts, you must go through the New Report dialog box. To create a mailing label report, click Reports in the Database window, click the New button, choose “Label Wizard” from the list box, select the table or query that will provide your data from the drop-down menu, and click OK (see Figure 6-20).

Custom Label Templates
THE ANNOYANCE: I’m setting up my mailing labels using the Label Wizard. I read the entire list of label types, but the one we use isn’t on the list. Not that it would help—just as a test I printed out a label type that is on the list, and the output still wasn’t aligned correctly.
THE FIX: Access won’t allow you to download updated label lists (awww…), so if yours isn’t listed you may have to create a custom template for it. However, the Label Wizard does include plenty of standard label types, and they aren’t always easy to find. When searching the list of label types, make sure you try all the relevant combinations—Unit of Measure (English/Metric), Label Type (Sheet feed/Continuous), and Manufacturer—otherwise, your label may not appear in the list.
If you still can’t find your label type, or if you aren’t sure of the label manufacturer or number, you can create a custom label template. This will allow you to measure more precisely than Microsoft or Avery did, and account for your printer’s margins. Even if your label is in the standard list, the printed labels may not align properly because their built-in specifications aren’t correct or don’t work with your printer’s margins. In these cases, a custom label template might be just the ticket.
Get out your ruler and measure the label’s dimensions and spacing. In the first Label Wizard screen, click the Customize button, then the New button. Give your custom label a name and enter all the dimensions carefully. There are text boxes for nine different dimensions, including label height and width, label margins, label spacing, and page margins (see Figure 6-21).

It may take some trial and error to get your labels aligned perfectly, but once you do the Label Wizard will be a lot more helpful.
Too Much Label, Not Enough Margin
THE ANNOYANCE: In the Label Wizard, I selected the standard Avery label number to match the labels I bought. When the wizard finished, it said: “Some data may not be displayed. There is not enough horizontal space on the page.” Says who? The addresses aren’t spilling off the labels!
THE FIX: The error lies not with the Label Wizard, although it would be nice if the wizard told you what’s wrong. The problem is that your labels are too close to the edge of the page for your printer. Many mailing labels have less than a 1/4” margin, but the minimum margin for your printer may be more than 1/4”. (For more information on other margin problems that you may encounter, see “Every Other Page Is Blank” and “Column Layout Issues,” earlier in this chapter.)
The best solution, of course, is to buy labels that don’t go so close to the edge of the page—but you’d probably prefer to use the labels you have, at least for now. First, simply ignore the error message and print one page of labels. Examine the righthand margin of each row of labels. If your data is not as wide as the entire label and is not being cut off, you can ignore the message and print your labels as they are.
If data is being lost, you’ll need to adjust the report settings. Access will have automatically increased the left and right margins to accommodate the minimum margins of your printer, so you’ll have to work on the label width and horizontal spacing. Switch to the report’s Design View. First, reduce the width of each field just a bit. Then pull in the righthand edge of the report to reduce the width of the label area. This will probably quash the error message, but now your labels won’t be properly aligned. To adjust them, click File → Page Setup, click the Columns tab, and increase the Column Spacing value by a small amount—for example, from 0.125” to 0.175” (see Figure 6-22). Print a page of labels to see the effects of your changes, and readjust as necessary.

Eliminate Blank Lines, and Other Label Tweaks
THE ANNOYANCE: I created customer mailing labels with two address fields: AddressLine1 and AddressLine2. The problem is, whenever AddressLine2 is blank, Access leaves a blank line in the middle of the label. How can I control exactly what appears on the label?
THE FIX: The most common way to avoid blank lines on a label is to set the offending field’s Can Shrink property to “Yes” (see Figure 6-23). As long as there’s only one control per line—and they don’t overlap at all from top to bottom—the empty control will shrink so it doesn’t take up any space. If you still get blank lines with this technique, check whether the control contains any spaces or punctuation marks; if so, it won’t shrink. Also, be aware that the space between controls never shrinks—only space inside them. If there’s space between fields on your label, you might want to move them closer together (see “Too Much Blank Space,” earlier in this chapter).

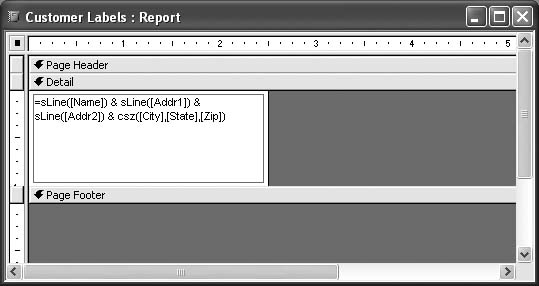
Fortunately, there’s a better solution that not only eliminates blank lines, but also addresses other items on many users’ label printing “wish lists.” The key is to use a single large text box to hold all the address fields, and set the box’s Control Source to use an expression that combines all the label fields. Here’s how:
Type the following utility function into your report module, or into any standard module in your project. (To create a new module, click Insert → Module.) You will then use this function to add line break characters when combining label text.
	Function sLine(LineOfText As Variant) As String
	' Trim text, then add a new line at the end unless zero-length.

	        Dim strText As String

	        strText = Trim(Nz(LineOfText, ""))
	        If Len(strText) > 0 Then
	                sLine = strText & vbNewLine
	        End If
	End Function
While you could insert the line breaks directly in your Control Source expression, this function automatically trims blank spaces from around the text you send it, and then adds a line break if there’s any text present.
Next, type another utility function underneath the first. This function will combine the city, state, Zip Code, and country:
	Function csz(City, State, Zip, Optional Country = Null)
	   csz = Trim((City + ", ") & (State + " ") & Zip & _
	      (" " + Country))
	End Function
In this function, the + operator evaluates to null if either side is null, while the & operator disregards null values. In other words, if there is no city, you get no comma or space following, but you still get the other fields if they contain values.
Save the module (any name is fine) and switch back to your report.
Now you are ready to update your label. On your label report, delete all but one text box and expand the remaining text box to fill the entire label.
Set the label’s Control Source property to combine all the fields you want on the label. Use the
sLinefunction to add line breaks where appropriate (see Figure 6-24). For example, to combine address fields, you’d enter:Figure 6-24. To exercise maximum control over a label’s format, use a single text box to hold all the address info, and then apply functions to that box.=sLine([Name]) & sLine([Addr1]) & sLine([Addr2]) & csz([City],[State], [Zip])
Once you are using a single text box to contain the address block for your labels, you’ll have an easier time solving other challenges. For example, what if you want to include a home address when no business address is available? Just rewrite the expression above like this:
	=sLine([Name]) & IIf(IsNull([Addr1]), sLine([HAddr1]) & sLine([HAddr2])
	& csz([HCity],[HState],[HZip]), sLine([Addr1]) & sLine([Addr2]) &
	csz([City],[State],[Zip]))
In this expression, the IIf function checks whether the Addr1 field is null and inserts the home address or work address field, as appropriate.
If the conditions you want to handle are complex, your expression can quickly get out of hand. In that case, create a separate function to combine fields (similar to the “csz” function above). For example, if you need to include spouse names and courtesy titles in your name line, write a function to handle all the different possibilities, and then call it from within your expression to fill in the label.
Prompt for Trim Function
THE ANNOYANCE: I’m trying to print labels, and Access keeps asking me for a "Trim” value. I have no idea what this means.
THE FIX: By default, the Mailing Label Wizard uses the Trim function in every label report; this message indicates that Visual Basic can’t find that function. Since Trim is a built-in function, this shouldn’t happen—but (sigh) it does. (See MSKB 160870.) Under some conditions, when your database is missing references to required code libraries, VB can’t find certain built-in functions. The fix is to clean up your missing references. See “Missing References” in Chapter 1 for more information.
Zip+4 Codes Run Together
THE ANNOYANCE: Why do my Zip+4 Codes run together, with no hyphens, on my mailing labels? When I view them in a table or form they look fine.
THE FIX: This problem occurs because you have an input mask on your Zip Code field that makes the Zip Codes display with a hyphen, even though that hyphen isn’t actually stored in the field (see “Input Mask Nixes Queries” in Chapter 4). If you place the Zip Code field on its own line, the input mask will work fine and the hyphens will print out properly. However, if you include it on a line with other fields, such as city and state, the input mask won’t be applied, because the Label Wizard will combine the fields into a single expression.
To work around this problem, you can fix the label report so that it inserts the hyphen when the Zip Code is nine characters long. Edit the Control Source property for the text box that holds the Zip. Leave the existing expression in place, but replace the field name (such as [Zip]) with the following:
IIf(Len([Zip]) = 9, Left([Zip], 5) & "-" & Right([Zip], 4), [Zip])
This IIf expression tests to see whether Zip has exactly nine characters. If it does, the expression combines the leftmost five characters, a hyphen, and the rightmost four characters; otherwise, it simply returns the Zip value without a hyphen.
More Than One Label for Each Record
THE ANNOYANCE: I’m trying to print multiple copies of a single label. I filtered the records to display only that label (so far, so good). Then I entered the number of copies in the Print dialog box—but Access put the copies on separate pages, so it only printed one label per page!
THE FIX: By default, Access prints one record per label—and there’s no easy way to repeat a record multiple times unless your table includes duplicate records. As you’ve seen, asking for multiple copies will only get you more pages like the first one.
Fortunately, reports have a NextRecord property that gives you precise control over printing. (Don’t look for this property in the properties sheet; it’s available only in Visual Basic.) By setting this property to False during printing, you can cause your report to stay on the same record and print it repeatedly.
To print multiple copies of each label, create a form called frmOpenLabels. On that form, create a text box where users enter the number of label copies they want, and a command button that opens your label report. Then, add the following code to the report’s module:
	Dim intCopy As Integer
	Dim intTotalCopies As Integer

	Private Sub Report_Open(Cancel As Integer)
	    On Error Resume Next

	    ' Get the number of copies from the frmOpenLabels form.
	    intTotalCopies = Forms!frmOpenLabels!txtLabelCopies
	End Sub

	Private Sub Detail_Print(Cancel As Integer, PrintCount As Integer)
	    intCopy = intCopy + 1
	    If intCopy < intTotalCopies Then
	             Me.NextRecord = False
	    Else
	             Me.NextRecord = True
	             intCopy = 0
	    End If
	End Sub
The code uses variables to keep track of how many label copies it has printed and the total number of copies you want. In the Print event procedure, it sets the NextRecord property to False to ensure that the record will be repeated until the desired number of copies have been printed. Note that if the user doesn’t specify the number of copies to print, it prints normally (one copy per record).
For another solution, check out the free Label Saver module from Peter’s Software, at http://www.peterssoftware.com/ls.htm.
Printing Partial Sheets of Labels
THE ANNOYANCE: I’m fed up with having to throw away partially used sheets of mailing labels. Can’t I start printing in the middle of the page?
THE FIX: Access can only start from the top of the sheet. But if you don’t mind writing a bit of code (since these properties are not in the properties sheet), you can skip over labels by setting the report’s NextRecord and PrintSection properties.
To skip a specified number of labels, create a form called frmOpenLabels. On that form, create a text box called txtSkipLabels where users enter the number of labels they want to skip, and a command button that opens your label report. Then, add the following code to the report’s module:
	Dim intCurrent As Integer
	Dim intSkip As Integer

	Private Sub Report_Open(Cancel As Integer)
	    On Error Resume Next

	    ' Get the number of lables to skip from the frmOpenLabels form.
	    intSkip = Forms!frmOpenLabels!txtSkipLabels
	End Sub

	Private Sub Detail_Print(Cancel As Integer, PrintCount As Integer)
	    If intCurrent < intSkip Then
	            Me.NextRecord = False
	            Me.PrintSection = False
	            intCurrent = intCurrent + 1
	    End If
	End Sub
The code uses the intCurrent and intSkip variables to keep track of which label position is current, and how many labels you want to skip. In the Print event procedure, it sets the NextRecord and PrintSection properties to keep the recordset on the first record while moving through all the label positions you want to skip. Note that if you don’t enter a value on the form, it will print normally (without skipping any labels).
For a solution that requires writing far less code, try the free Label Saver module from Peter’s Software, at http://www.peterssoftware.com/ls.htm.
CHARTS AND GRAPHS
Where’s Charting?
THE ANNOYANCE: I know that Access is supposed to support charting, but I’ve looked everywhere for a chart button and I can’t find one. How do I put a chart on my form or report? Also, if I add a chart and it doesn’t look right, where are the menus and options to change it?
THE FIX: Charts you create in Microsoft Access are not ordinary Access objects, but embedded objects created by a separate application called Microsoft Graph. Because Graph is not part of Access, its commands and buttons are difficult to find, and its features are buggy (as described below). What’s even more annoying is that Access and Graph do not always communicate well. Still, there are times when a chart is a must.
To add a chart to a form or report in Design View, click Insert → Chart, then drag out an area on your form or report where you want the chart to appear. The Chart Wizard (see Figure 6-25) will appear to help you create your chart. Follow the wizard’s screens to pick the data source (tables and/or queries) for the chart, the fields, the chart type and name, and so on.
Note
When creating a chart on a report, your best bet is to create it on a form first, then copy and paste it onto the report when it is complete. The reason is that charts created on forms reflect underlying data even in Design View, while those created on reports do not. For details, see the next Annoyance, “Chart Only Shows Sample Data.”

The Chart Wizard rarely gets your chart just right, so you will surely want to make changes. Unfortunately, since charts are embedded objects, this can be tricky. In Design View, click the chart object, and then click the Properties button on the toolbar. Here, you can set properties for the object control that contains your chart. For example, you can specify a border, or change the Row Source that provides data for the chart.
To edit the chart object itself, double-click it (see Figure 6-26). The Access menus and toolbars will be replaced with those for Microsoft Graph, which allow you to change the chart’s type, formatting, and options. Double-click an area of the chart, such as the axis, gridlines, title, or legend, to view options for that element. When you are finished editing the chart, click outside the chart control to return to Access.

Chart Only Shows Sample Data
THE ANNOYANCE: I created a chart for sales figures, but instead of real data it shows sample data for North, West, and East (see Figure 6-27). I specified the query and fields to use. Why aren’t they showing up in the chart?
THE FIX: When you insert a new chart on a form or report, Microsoft Graph displays sample data so that you can get an idea of what the chart will look like. Unfortunately, even when you’ve provided a valid source of data, your chart will often stubbornly insist on displaying the sample data. This is baffling (to say the least), and it makes it very difficult to format your chart. Here’s when you’ll see the sample data, and how to banish it:

- You created the chart in form Design View and haven’t switched views yet.
Switch to Form View or Print Preview to see the real data. When you return to Design View, the chart will continue to display it. (However, the data will not update if the underlying records change. You’ll need to switch views again to force it to update.)
- You created the chart on a report.
If you created the chart on a report rather than a form, you’ll be able to view the real data in Print Preview, but when you return to report Design View the sample data will be back. The fix: create your chart on a form, switching between Design and Form View until you get the chart right. Then, copy the chart and paste it onto your report. The actual data will appear, as it did in form Design View.
If you’ve already created the chart on your report, copy it to a blank form, switch to Form View and back to Design View, then copy the chart back to your report.
- The Locked property of your chart control (i.e., the object frame) is set to “True.”.
If you are creating the chart on a form, the chart’s object frame control will have Locked and Enabled properties (these properties don’t exist on a report). When the chart control is locked, Access can’t update it before returning to Design View. Set the Locked property to “False” and the Enabled property to “True” (see the sidebar “Enabled Versus Locked” in Chapter 5 for more on these properties).
- Your version of Access has problems with Graph.
If these fixes don’t work, you may have a buggy version of Access. The initial release of Office XP (and hence, Access 2002/XP), for example, had problems with Graph. (They were fixed in the SP1 release.) Install the latest service pack update for your version of Office before using charts. See “Installation Checklist” in the Appendix for more information.
Chart Changes Are Gone
THE ANNOYANCE: I edited the data labels in my chart. They looked fine in Design View, but when I previewed the report, my changes disappeared! Why weren’t my changes saved?
THE FIX: If a chart is bound—that is, if it draws its information from your database—its data and labels come from the chart’s underlying data source, not from what you enter in Microsoft Graph. This can be confusing, because Graph has a datasheet where you can enter data to be displayed in your chart. This only works if the chart is unbound. Every time you view a bound chart in Print Preview or Form View, Access gets the current data from the underlying table or query and passes it to Graph, and that data overrides any changes you may have made (see Figure 6-28).

If you want to change the data or labels in a bound chart, you must edit the underlying query so it produces the set of records you want to chart (see Figure 6-29). To change labels that come from field names, such as legend labels, you must provide the field names in the underlying query. For example, if your chart displays data from a totals query, the field name might show up in the chart as “SumOfProductSales.” To change the field name, you could precede the field in the query with the name you want, followed by a colon, such as Total Sales:

To change chart data or labels that come from bound data values, you’ll have to edit the data in the underlying tables. Alternatively, you may be able to use a calculated field in your query to provide the data values you want. For example, if you wanted to display currency values as “$10K” instead of “$10,000,” you would replace the field in your query with a calculated field expression such as Sales 000s: Sum([ProductSales])1000, then set a custom format for your chart’s x-axis in Graph, such as $0k.
Note
Another time you’ll want to edit a chart’s underlying query is to change the order of fields or data in the chart. To change the order in which fields appear—in the legend, for example—rearrange the field order in the underlying query (by dragging columns in the design grid). To change the order of data values in the chart, apply a sort order in the query.
Incorrect Data in Chart
THE ANNOYANCE: My chart is bound to the current record in a report. For some reason, the chart links to the wrong record and displays incorrect data! Is this a bug, or am I going completely crazy?
THE FIX: This is a known bug in Access 97, 2000, and 2002 running under Windows 2000 or XP. Access and Graph are not properly synchronized, and the chart sometimes displays the incorrect record.
To fix the problem for Access 2002 (Office XP), install Service Pack 1 or later. To repair Access 2000 (and 97), insert the following code in the Format event procedure for the section of the report that contains the chart:
Me.myChart.Requery
If that doesn’t do the trick, another option is to insert this code (also in the Format event):
	Dim i As Integer
	For i = 1 To 5
	    DoEvents
	Next i
In either case, running the code should allow Graph to “get onto the same page” with Access as each record is displayed.
For more information about this Access bug, see MSKB 318096.
Chart Is Blank
THE ANNOYANCE: When I switch to Form View or Print Preview, the chart control is blank. Where’d it go?
THE FIX: A blank chart indicates that the underlying data source for the chart is returning no records. In some cases, you’ll see an error message describing the problem; at other times, a blank chart is your only hint.
First, make sure that the chart’s data source is correct. In Design View, right-click the chart control and select Properties. Set Row Source Type to “Table/Query,” and set Row Source to an existing table or query (or a valid SQL statement). Make sure that the table or query you specify returns records.
If your chart links to each record in your form or report (that is, the chart control’s Link Master Fields and Link Child Fields properties are set), you might see a blank chart for some records but not others. For example, if your chart displays sales data for each product category, the chart will appear blank when a category record has no associated products.
When your chart is blank, you might want the chart control itself to be invisible and not take up space. Don’t be tempted to use the Can Shrink property—it won’t work. Instead, add the code below to the Format event procedure for the section that contains the chart. (For a shortcut to the event procedure, right-click the section header and select “Build Event.”) When there are no product records associated with the current supplier record, the code shrinks the chart control completely and adjusts the section height.
	Private Sub Detail_Format(Cancel As Integer, _
	   FormatCount As Integer)

	   Dim intRecordsToChart As Integer
	   ' Find the number of records that the chart will contain.
	   intRecordsToChart = DCount("*", "Products", _
	      "SupplierID=" & Nz(Me!SupplierID, 0))
	   If intRecordsToChart = 0 Then
	      ' Shrink the chart and Detail section.
	      Me.Graph1.Height = 0
	      Me.Graph1.Width = 0
	      Me.Graph1.Visible = False
	      Me.Detail.Height = 1080
	   Else
	      ' Restore the chart to size and refresh it.
	      Me.Detail.Height = 6200
	      Me.Graph1.Height = 5220
	      Me.Graph1.Width = 6040
	      Me.Graph1.Object.Refresh
	      Me.Graph1.Visible = True
	   End If
	End Sub
Fixed-Scale Charts
THE ANNOYANCE: I created a chart that appears for each record. The problem is that the scale of the chart varies from record to record, based on the value of the data. For instance, some categories have far fewer sales than others, but in each sales category’s chart, bars for product sales fill the available chart area. This makes it very difficult to compare sales values between category records. I tried setting the Maximum value for the axis, but it didn’t make any difference.
THE FIX: Unless you provide a specific scale, Graph formats each chart so that the largest value fills the entire chart. Here’s how to set up a fixed scale:
Double-click the chart to edit it.
Double-click the axis you want to keep consistent. (This can be tricky—it’s easy to select another part of the chart by mistake. Make sure the dialog box that appears is titled “Format Axis,” as in Figure 6-30.)
Click the Scale tab, and then type a value in the Maximum box. If you like, you can also set Minimum, Major Unit, and Minor Unit. Make sure the “Auto” box is unchecked for each value you want to apply consistently; otherwise, Graph will adjust the scale again when you view the chart.

Control Charts in Code
THE ANNOYANCE: I want to write code that changes the appearance of my chart, but I can’t find the properties or methods to use.
THE FIX: Access includes an object library for Microsoft Graph that includes the Chart object. Using Visual Basic code, you can do just about anything that’s possible in the Microsoft Graph interface. However, before using the Chart object in your code, be sure to set a reference to the Microsoft Graph Object Library in the Visual Basic Editor (click Tools → References).
For more information on setting references, see “Missing References” in Chapter 1.
The following code demonstrates how you might take control of a chart on a form. The code sets the chart type, using predefined constants, and (optionally) adds a legend based on the user’s selections in two checkboxes. It assumes you’ve created a chart in a control called myChartControl.
	Dim theChart As Chart

	Set theChart = Me.myChartControl.Object
	If Me!chkClustered Then
	    theChart.ChartType = xlBarClustered
	Else
	    theChart.ChartType = xlBarStacked
	End If
	theChart.HasLegend = Me!chkLegend
Link a Chart from Excel
THE ANNOYANCE: I created a chart in Excel and copied it to my Access form. Why doesn’t it update automatically?
THE FIX: To place an Excel chart on an Access form and have the chart automatically change when the chart in Excel changes, do the following:
In Excel, click the chart and click Edit → Copy.
Switch back to your Access form, click Edit → Paste Special, choose “Paste Link,” and click OK. Access creates an Unbound Object Frame control to hold the chart object.
Set the control’s Size Mode property to “Zoom” or “Stretch,” so you can resize the chart as needed.