
by Richard S. Wright, Jr.
This book is about OpenGL, a programming interface for creating real-time 3D graphics. Before we begin talking about what OpenGL is and how it works, you should have at least a high-level understanding of real-time 3D graphics in general. Perhaps you picked up this book because you want to learn to use OpenGL, but you already have a good grasp of real-time 3D principles. If so, great: Skip directly to Chapter 2, “Using OpenGL.” If you bought this book because the pictures look cool and you want to learn how to do this on your PC…you should probably start here.
The first computers consisted of rows and rows of switches and lights. Technicians and engineers worked for hours, days, or even weeks to program these machines and read the results of their calculations. Patterns of illuminated bulbs conveyed useful information to the computer users, or some crude printout was provided. You might say that the first form of computer graphics was a panel of blinking lights. (This idea is supported by stories of early programmers writing programs that served no useful purpose other than creating patterns of blinking and chasing lights!)
Times have changed. From those first “thinking machines,” as some called them, sprang fully programmable devices that printed on rolls of paper using a mechanism similar to a teletype machine. Data could be stored efficiently on magnetic tape, on disk, or even on rows of hole-punched paper or stacks of paper-punch cards. The “hobby” of computer graphics was born the day computers first started printing. Because each character in the alphabet had a fixed size and shape, creative programmers in the 1970s took delight in creating artistic patterns and images made up of nothing more than asterisks (*).
Paper as an output medium for computers is useful and persists today. Laser printers and color inkjet printers have replaced crude ASCII art with crisp presentation quality and near photographic reproductions of artwork. Paper, however, can be expensive to replace on a regular basis, and using it consistently is wasteful of our natural resources, especially because most of the time we don't really need hard-copy output of calculations or database queries.
The cathode ray tube (CRT) was a tremendously useful addition to the computer. The original computer monitors, CRTs were initially just video terminals that displayed ASCII text just like the first paper terminals—but CRTs were perfectly capable of drawing points and lines as well as alphabetic characters. Soon, other symbols and graphics began to supplement the character terminal. Programmers used computers and their monitors to create graphics that supplemented textual or tabular output. The first algorithms for creating lines and curves were developed and published; computer graphics became a science rather than a pastime.
The first computer graphics displayed on these terminals were two-dimensional, or 2D. These flat lines, circles, and polygons were used to create graphics for a variety of purposes. Graphs and plots could display scientific or statistical data in a way that tables and figures could not. More adventurous programmers even created simple arcade games such as Lunar Lander and Pong using simple graphics consisting of little more than line drawings that were refreshed (redrawn) several times a second.
The term real-time was first applied to computer graphics that were animated. A broader use of the word in computer science simply means that the computer can process input as fast or faster than the input is being supplied. For example, talking on the phone is a real-time activity in which humans participate. You speak and the listener hears your communication immediately and responds, allowing you to hear immediately and respond again, and so on. In reality, there is some delay involved due to the electronics, but the delay is usually imperceptible to those having the conversation. In contrast, writing a letter is not a real-time activity.
Applying the term real-time to computer graphics means that the computer is producing an animation or sequence of images directly in response to some input, such as joystick movement, keyboard strokes, and so on. Real-time computer graphics can display a wave form being measured by electronic equipment, numerical readouts, or interactive games and visual simulations.
The term three-dimensional, or 3D, means that an object being described or displayed has three dimensions of measurement: width, height, and depth. An example of a two-dimensional object is a piece of paper on your desk with a drawing or writing on it, having no perceptible depth. A three-dimensional object is the can of soda next to it. The soft drink can is round (width and height) and tall (depth). Depending on your perspective, you can alter which side of the can is the width or height, but the fact remains that the can has three dimensions. Figure 1.1 shows how we might measure the dimensions of the can and piece of paper.

For centuries, artists have known how to make a painting appear to have real depth. A painting is inherently a two-dimensional object because it is nothing more than canvas with paint applied. Similarly, 3D computer graphics are actually two-dimensional images on a flat computer screen that provide an illusion of depth, or a third dimension.
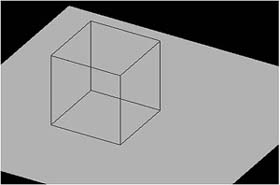
The first computer graphics no doubt appeared similar to Figure 1.2, where you can see a simple three-dimensional cube drawn with 12 line segments. What makes the cube look three-dimensional is perspective, or the angle between the lines that lend the illusion of depth.

To truly see in 3D, you need to actually view an object with both eyes or supply each eye with separate and unique images of the object. Look at Figure 1.3. Each eye receives a two-dimensional image that is much like a temporary photograph displayed on each retina (the back part of your eye). These two images are slightly different because they are received at two different angles. (Your eyes are spaced apart on purpose.) The brain then combines these slightly different images to produce a single, composite 3D picture in your head.

In Figure 1.3, the angle between the images becomes smaller as the object goes farther away. You can amplify this 3D effect by increasing the angle between the two images. Viewmasters (those hand-held stereoscopic viewers you probably had as a kid) and 3D movies capitalize on this effect by placing each of your eyes on a separate lens or by providing color-filtered glasses that separate two superimposed images. These images are usually over-enhanced for dramatic or cinematic purposes. Of late this effect has become more popular on the PC as well. Shutter glasses that work with your graphics card and software will switch between one eye and the other, with a changing perspective displayed onscreen to each eye, thus giving a “true” stereo 3D experience. Unfortunately, many people complain that this effect gives them a headache or makes them dizzy!
A computer screen is one flat image on a flat surface, not two images from different perspectives falling on each eye. As it turns out, most of what is considered to be 3D computer graphics is actually an approximation of true 3D. This approximation is achieved in the same way that artists have rendered drawings with apparent depth for years, using the same tricks that nature provides for people with one eye.
You might have noticed at some time in your life that if you cover one eye, the world does not suddenly fall flat! What happens when you cover one eye? You might think you are still seeing in 3D, but try this experiment: Place a glass or some other object just out of arm's reach, off to your left side. (If it is close, this trick won't work.) Cover your right eye with your right hand and reach for the glass. (Maybe you should use an empty plastic one!) Notice that you have a more difficult time estimating how much farther you need to reach (if at all) before you touch the glass. Now, uncover your right eye and reach for the glass, and you can easily discern how far you need to lean to reach the glass. You now know why people with one eye often have difficulty with distance perception.
Perspective alone is enough to create the appearance of three dimensions. Note the cube shown previously in Figure 1.2. Even without coloring or shading, the cube still has the appearance of a three-dimensional object. Stare at the cube for long enough, however, and the front and back of the cube switch places. Your brain is confused by the lack of any surface coloration in the drawing. Figure 1.4 shows the output from the sample program BLOCK from this chapter's subdirectory on the CD-ROM. Run this program as we progress toward a more and more realistic appearing cube. We see here that the cube resting on a plane has an exaggerated perspective but still can produce the “popping” effect when you stare at it. By pressing the spacebar, you will progress toward a more and more believable image.
The reason the world doesn't become suddenly flat when you cover one eye is that many of a 3D world's effects are still present when viewed two-dimensionally. The effects are just enough to trigger your brain's ability to discern depth. The most obvious cue is that nearby objects appear larger than distant objects. This perspective effect is called foreshortening. This effect and color changes, textures, lighting, shading, and variations of color intensities (due to lighting) together add up to our perception of a three-dimensional image. In the next section, we take a survey of these tricks.
Now you have some idea that the illusion of 3D is created on a flat computer screen by means of a bag full of perspective and artistic tricks. Let's review some of these effects so we can refer to them later in the book, and you'll know what we are talking about.
The first term you should know is render. Rendering is the act of taking a geometric description of a three-dimensional object and turning it into an image of that object onscreen. All the following 3D effects are applied when rendering the objects or scene.
Perspective refers to the angles between lines that lend the illusion of three dimensions. Figure 1.4 shows a three-dimensional cube drawn with lines. This is a powerful illusion, but it can still cause perception problems as we mentioned earlier. (Just stare at this cube for a while, and it starts popping in and out.) In Figure 1.5, on the other hand, the brain is given more clues as to the true orientation of the cube because of hidden line removal. You expect the front of an object to obscure the back of the object from view. For solid surfaces, we call this hidden surface removal.

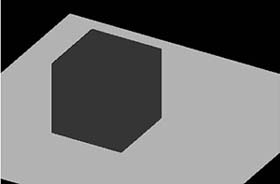
If we stare at the cube in Figure 1.5 long enough, we can convince ourselves that we are looking at a recessed image, and not the outward surfaces of a cube. To further our perception, we must move beyond line drawing and add color to create solid objects. Figure 1.6 shows what happens when we naively add red to the color of the cube. It doesn't look like a cube anymore. By applying different colors to each side, as shown in Figure 1.7, we regain our perception of a solid object.

Making each side of the cube a different color helps your eye pick out the different sides of the object. By shading each side appropriately, we can give the cube the appearance of being one solid color (or material) but also show it is illuminated by a light at an angle, as shown in Figure 1.8. Figure 1.9 goes a step further by adding a shadow behind the cube. Now we are simulating the effects of light on one or more objects and their interactions. Our illusion at this point is very convincing.


Achieving a high level of realism with nothing but thousands or millions of tiny lit and shaded polygons is a matter of brute force and a lot of hard work. Unfortunately, the more geometry you throw at graphics hardware, the longer it takes to render. A clever technique allows you to use simpler geometry but achieve a higher degree of realism. This technique takes an image, such as a photograph of a real surface or detail, and then applies that image to the surface of a polygon.
Instead of plain-colored materials, you can have wood grains, cloth, bricks, and so on. This technique of applying an image to a polygon to supply additional detail is called texture mapping. The image you supply is called a texture, and the individual elements of the texture are called texels. Finally, the process of stretching or compressing the texels over the surface of an object is called filtering. Figure 1.10 shows the now familiar cube example with textures applied to each polygon.

Most of us know what fog is. Fog is an atmospheric effect that adds haziness to objects in a scene, which is usually a relation of how far away the objects in the scene are from the viewer and how thick the fog is. Objects very far away (or nearby if the fog is thick) might even be totally obscured.
Figure 1.11 shows the skyfly GLUT demo (included with the GLUT distribution on the CD-ROM) with fog enabled. Note how the fog lends substantially to the believability of the terrain.

Blending is the combination of colors or objects on the screen. This is similar to the effect you get with double-exposure photography, where two images are superimposed. You can use the blending effect for a variety of purposes. By varying the amount each object is blended with the scene, you can make objects look transparent such that you see the object and what is behind it (such as glass or a ghost image).
You can also use blending to achieve an illusion of reflection, as shown in Figure 1.12. You see a textured cube rendered twice. First, the cube is rendered upside down below the floor level. The marble floor is then blended with the scene, allowing the cube to show through. Finally, the cube is drawn again right side up and floating over the floor. The result is the appearance of a reflection in a shiny marble surface.

Aliasing is an effect that is visible onscreen due to the fact that an image consists of discrete pixels. In Figure 1.13, you can see that the lines that make up the cube have jagged edges (sometimes called jaggies). By carefully blending the lines with the background color, you can eliminate the jagged edges and give the lines a smooth appearance, as shown in Figure 1.14. This blending technique is called antialiasing. You can also apply antialiasing to polygon edges, making an object or scene look more realistic. This Holy Grail of real-time graphics is often referred to as photo-realistic rendering.


Three-dimensional graphics have many uses in modern computer applications. Applications for real-time 3D graphics range from interactive games and simulations to data visualization for scientific, medical, or business uses. Higher-end 3D graphics find their way into movies and technical and educational publications as well.
As defined earlier, real-time 3D graphics are animated and interactive with the user. One of the earliest uses for real-time 3D graphics was in military flight simulators. Even today, flight simulators are a popular diversion for the home enthusiast. Figure 1.15 shows a screenshot from a popular flight simulator that uses OpenGL for 3D rendering (www.flightgear.org).

The applications for 3D graphics on the PC are almost limitless. Perhaps the most common use today is for computer gaming. Hardly a title ships today that does not require a 3D graphics card in your PC to play. 3D has always been popular for scientific visualization and engineering applications, but the explosion of cheap 3D hardware has empowered these applications like never before. Business applications are also taking advantage of the new availability of hardware to incorporate more and more complex business graphics and database mining visualization techniques. Even the modern GUI is being effected, and is beginning to evolve to take advantage of 3D hardware capabilities. The new Macintosh OS X, for example, uses OpenGL to render all its windows and controls for a powerful and eye-popping visual interface.
Figures 1.16 through 1.20 show some of the myriad applications of real-time 3D graphics on the modern PC. All these images were rendered using OpenGL.


Some compromise is required for real-time 3D applications. Given more processing time, you can generate higher quality 3D graphics. Typically, you design models and scenes, and a ray tracer processes the definition to produce a high-quality 3D image. The typical process is that some modeling application uses real-time 3D graphics to interact with the artist to create the content. Then the frames are sent to another application (the ray tracer), which renders the image. Rendering a single frame for a movie such as Toy Story could take hours on a very fast computer, for example. The process of rendering and saving many thousands of frames generates an animated sequence for playback. Although the playback might appear real-time, the content is not interactive, so it is not considered real-time, but rather pre-rendered.
Figure 1.21 shows an example from the CD-ROM. This spinning image shows crystal letters that spell OpenGL. The letters are transparent and fully antialiased and show a myriad of reflections and shadow effects. The file to play this animation on your computer is opengl.avi in the root directory of the CD-ROM that accompanies this book. This large file (more than 35MB!) took hours to render.

Now, you have a pretty good idea of the basics of real-time 3D. We've covered some terminology and some sample applications on the PC. How do you actually create these images on your PC? Well, that's what the rest of this book is about! You still need a little more introduction to the basics, which we present here.
There are two different approaches to programming APIs for real-time 3D graphics. The first approach is called retained mode. In retained mode, you provide the API or toolkit with a description of your objects and the scene. The graphics package then creates the image onscreen. The only additional manipulation you might make is to give commands to change the location and viewing orientation of the user (also called the camera) or other objects in the scene.
This type of approach is typical of ray tracers and many commercial flight simulators and image generators. Programmatically, the structure that is built is called a scene graph. The scene graph is a data structure (usually a DAG, or directed acyclic graph, for you computer science majors) that contains all the objects in your scene and their relationships to one another. Many high-level toolkits or “game engines” use this approach. The programmer doesn't need to understand the finer points of rendering, only that he has a model or database that will be handed over to the graphics library, which takes care of the rendering.
The second approach to 3D rendering is called immediate mode. Most retained mode APIs or scene graphs use an immediate mode API internally to actually perform the rendering. In immediate mode, you don't describe your models and environment from as high a level. Instead, you issue commands directly to the graphics processor that has an immediate effect on its state and the state of all subsequent commands.
With immediate mode, new commands have no effect on rendering commands that have already been executed. This gives you a great deal of low-level control. For example, you can render a series of textured unlit polygons to represent the sky. Then you issue a command to turn off texturing, followed by a command to turn on lighting. Thereafter, all geometry (probably drawn on the ground) that you render is affected by the light but is not textured with the sky image.
Let's consider now how we describe objects in three dimensions. Before you can specify an object's location and size, you need a frame of reference to measure and locate against. When you draw lines or plot points on a simple flat computer screen, you specify a position in terms of a row and column. For example, a standard VGA screen has 640 pixels from the left to right and 480 pixels from top to bottom. To specify a point in the middle of the screen, you specify that a point should be plotted at (320,240)—that is, 320 pixels from the left of the screen and 240 pixels down from the top of the screen.
In OpenGL, or almost any 3D API, when you create a window to draw in, you must also specify the coordinate system you want to use and how to map the specified coordinates into physical screen pixels. Let's first see how this applies to two-dimensional drawing and then extend the principle to three dimensions.
The most common coordinate system for two-dimensional plotting is the Cartesian coordinate system. Cartesian coordinates are specified by an x coordinate and a y coordinate. The x coordinate is a measure of position in the horizontal direction, and y is a measure of position in the vertical direction.
The origin of the Cartesian system is at x=0, y=0. Cartesian coordinates are written as coordinate pairs in parentheses, with the x coordinate first and the y coordinate second, separated by a comma. For example, the origin is written as (0,0). Figure 1.22 depicts the Cartesian coordinate system in two dimensions. The x and y lines with tick marks are called the axes and can extend from negative to positive infinity. This figure represents the true Cartesian coordinate system pretty much as you used it in grade school. Today, differing window mapping modes can cause the coordinates you specify when drawing to be interpreted differently. Later in the book, you'll see how to map this true coordinate space to window coordinates in different ways.
The x-axis and y-axis are perpendicular (intersecting at a right angle) and together define the xy plane. A plane is, most simply put, a flat surface. In any coordinate system, two axes (or two lines) that intersect at right angles define a plane. In a system with only two axes, there is naturally only one plane to draw on.
A window is measured physically in terms of pixels. Before you can start plotting points, lines, and shapes in a window, you must tell OpenGL how to translate specified coordinate pairs into screen coordinates. You do this by specifying the region of Cartesian space that occupies the window; this region is known as the clipping region. In two-dimensional space, the clipping region is the minimum and maximum x and y values that are inside the window. Another way of looking at this is specifying the origin's location in relation to the window. Figure 1.23 shows two common clipping regions.

In the first example, on the left of Figure 1.23, x coordinates in the window range left to right from 0 to +150, and the y coordinates range bottom to top from 0 to +100. A point in the middle of the screen would be represented as (75,50). The second example shows a clipping area with x coordinates ranging left to right from –75 to +75 and y coordinates ranging bottom to top from –50 to +50. In this example, a point in the middle of the screen would be at the origin (0,0). It is also possible using OpenGL functions (or ordinary Windows functions for GDI drawing) to turn the coordinate system upside down or flip it right to left. In fact, the default mapping for Windows windows is for positive y to move down from the top to bottom of the window. Although useful when drawing text from top to bottom, this default mapping is not as convenient for drawing graphics.
Rarely will your clipping area width and height exactly match the width and height of the window in pixels. The coordinate system must therefore be mapped from logical Cartesian coordinates to physical screen pixel coordinates. This mapping is specified by a setting known as the viewport. The viewport is the region within the window's client area that is used for drawing the clipping area. The viewport simply maps the clipping area to a region of the window. Usually, the viewport is defined as the entire window, but this is not strictly necessary; for instance, you might want to draw only in the lower half of the window.
Figure 1.24 shows a large window measuring 300×200 pixels with the viewport defined as the entire client area. If the clipping area for this window were set to 0 to 150 along the x-axis and 0 to 100 along the y-axis, the logical coordinates would be mapped to a larger screen coordinate system in the viewing window. Each increment in the logical coordinate system would be matched by two increments in the physical coordinate system (pixels) of the window.

In contrast, Figure 1.25 shows a viewport that matches the clipping area. The viewing window is still 300×200 pixels, however, and this causes the viewing area to occupy the lower-left side of the window.

You can use viewports to shrink or enlarge the image inside the window and to display only a portion of the clipping area by setting the viewport to be larger than the window's client area.
In both 2D and 3D, when you draw an object, you actually compose it with several smaller shapes called primitives. Primitives are one- or two-dimensional entities or surfaces such as points, lines, and polygons (a flat, multisided shape) that are assembled in 3D space to create 3D objects. For example, a three-dimensional cube consists of six two-dimensional squares, each placed on a separate face. Each corner of the square (or of any primitive) is called a vertex. These vertices are then specified to occupy a particular coordinate in 3D space. A vertex is nothing more than a coordinate in 2D or 3D space. Creating solid 3D geometry is little more than a game of connect-the-dots! You'll learn about all the OpenGL primitives and how to use them in Chapter 3, “Drawing in Space: Geometric Primitives .”
Now, we extend our two-dimensional coordinate system into the third dimension and add a depth component. Figure 1.26 shows the Cartesian coordinate system with a new axis, z. The z-axis is perpendicular to both the x- and y-axes. It represents a line drawn perpendicularly from the center of the screen heading toward the viewer. (We have rotated our view of the coordinate system from Figure 1.22 to the left with respect to the y-axis and down and back with respect to the x-axis. If we hadn't, the z-axis would come straight out at you, and you wouldn't see it.) Now, we specify a position in three-dimensional space with three coordinates: x, y, and z. Figure 1.26 shows the point (-4,4,4) for clarification.

You've seen how to specify a position in 3D space using Cartesian coordinates. No matter how we might convince your eye, however, pixels on a screen have only two dimensions. How does OpenGL translate these Cartesian coordinates into two-dimensional coordinates that can be plotted on a screen? The short answer is “Trigonometry and simple matrix manipulation.” Simple? Well, not really; we could actually go on for many pages and lose most of our readers who didn't take or don't remember their linear algebra from college explaining this “simple” technique. You'll learn more about it in Chapter 4, “Geometric Transformations: The Pipeline,” and for a deeper discussion, you can check out the references in Appendix A, “Further Reading.” Fortunately, you don't need a deep understanding of the math to use OpenGL to create graphics. You might, however, discover that the deeper your understanding goes, the more powerful a tool OpenGL becomes!
The first concept you really need to understand is called projection. The 3D coordinates you use to create geometry are flattened or projected onto a 2D surface (the window background). It's like tracing the outlines of some object behind a piece of glass with a black marker. When the object is gone or you move the glass, you can still see the outline of the object with its angular edges. In Figure 1.27, a house in the background is traced onto a flat piece of glass. By specifying the projection, you specify the viewing volume that you want displayed in your window and how it should be transformed.
You are mostly concerned with two main types of projections in OpenGL. The first is called an orthographic or parallel projection. You use this projection by specifying a square or rectangular viewing volume. Anything outside this volume is not drawn. Furthermore, all objects that have the same dimensions appear the same size, regardless of whether they are far away or nearby. This type of projection (shown in Figure 1.28) is most often used in architectural design, computer-aided design (CAD), or 2D graphs. Frequently, you will use an orthographic projection to add text or 2D overlays on top of your 3D graphic scene.

You specify the viewing volume in an orthographic projection by specifying the far, near, left, right, top, and bottom clipping planes. Objects and figures that you place within this viewing volume are then projected (taking into account their orientation) to a 2D image that appears on your screen.
The second and more common projection is the perspective projection. This projection adds the effect that distant objects appear smaller than nearby objects. The viewing volume (see Figure 1.29) is something like a pyramid with the top shaved off. The remaining shape is called the frustum. Objects nearer to the front of the viewing volume appear close to their original size, but objects near the back of the volume shrink as they are projected to the front of the volume. This type of projection gives the most realism for simulation and 3D animation.

In this chapter, we introduced the basics of 3D graphics. You saw why you actually need two images of an object from different angles to be able to perceive true three-dimensional space. You also saw the illusion of depth created in a 2D drawing by means of perspective, hidden line removal, coloring, shading, and other techniques. The Cartesian coordinate system was introduced for 2D and 3D drawing, and you learned about two methods used by OpenGL to project three-dimensional drawings onto a two-dimensional screen.
We purposely left out the details of how these effects are actually created by OpenGL. In the chapters that follow, you will find out how to employ these techniques and take maximum advantage of OpenGL's power. On the companion CD, you'll find one program for this chapter that demonstrates the 3D effects covered here. In the program BLOCK, pressing the spacebar advances you from a wireframe cube to a fully lit and textured block complete with shadow. You won't understand the code at this point, but it makes a powerful demonstration of what is to come. By the time you finish this book, you will be able to revisit this example and even be able to write it from scratch yourself.