A Multiscale Sequential Fusion Approach for Handling Pupil Dilation in Iris Recognition
Raghunandan Pasula; Simona Crihalmeanu; Arun Ross Computer Science & Engineering, Michigan State University, East Lansing, MI, USA
Abstract
Pupil dilation is shown to degrade iris recognition accuracy (Hollingsworth et al., 2009, [7]) by increasing the Hamming distance between genuine samples thereby increasing the false reject rate (FRR). Dilation of pupil due to illumination changes or drugs results in complex deformation of the iris texture. In this work, a database to study the effect of pupil dilation is acquired. The adverse effect of pupil dilation on iris recognition is demonstrated using this database. A novel fusion scheme that sequentially fuses IrisCode bit information at different scales is proposed to reduce the effect of non-linear deformation. The experimental results show that the proposed method improves the matching accuracy on both the pupil dilation data as well as other non-ideal iris data.
Keywords
Pupil dilation; IrisCode; Multi-scale filters; Non-ideal Iris
4.1 Introduction
The iris is widely accepted as a strong biometric trait that varies significantly across individuals thereby resulting in low False Match Rates (FMR) [5]. Iris is the colored portion of the eye enclosed between the pupil and the sclera as shown in Fig. 4.1. When observed in the near-infrared (NIR) spectrum, the iris reveals a rich texture that is used for recognizing an individual. The color of the iris is not used by most iris recognition systems.

A typical iris recognition process involves acquiring a high quality image of the eye in the near infrared spectrum. This is followed by segmentation where the pupillary and limbic boundaries, along with other obstructions such as eyelids, eyelashes and specular reflections, are automatically detected. Next, the region between the pupillary and limbic boundaries is unwrapped into a fixed size normalized rectangular image such that pixels along a fixed angular direction in the original image are represented as a column in the normalized image. The radial and angular sampling rate in the original iris image determines the dimensions of the normalized image. A corresponding normalized binary mask indicating iris (“1”) and non-iris (“0”) pixels is also created. Next, the normalized image is subjected to a set of 2-D Gabor filters resulting in a complex numbered output at every pixel which is then quantized into a binary code depending on the sign of the real and imaginary parts of the complex number. Thus, each pixel in the normalized image generates two bits, and the resulting binary representation of the normalized image is referred to as an IrisCode. Fig. 4.2 shows an example of the steps involved in converting an input iris image into an IrisCode using a single Gabor filter.

The match score between two IrisCodes, ![]() and
and ![]() , with corresponding masks,
, with corresponding masks, ![]() and
and ![]() , is computed as a normalized Hamming distance score
, is computed as a normalized Hamming distance score

This equation computes the number of non-matching bits corresponding to iris pixels normalized by the total number of valid iris pixels. This, in principle, can result in a score between 0 (perfect match) and 1 (perfect non-match). However, in practice, the impostor match score is around 0.5, resulting in a score range of ![]() .
.
4.1.1 Pupil Dilation
There are several factors that negatively impact the matching accuracy of an iris recognition system. These include out-of-focus imaging, occlusions, specular reflections, image blur, non-uniform illumination, sensor noise, and pupil dilation. While most of these factors are a result of human–sensor interaction, pupil dilation is a result of ambient factors such as intensity of visible light entering the eye, psychological factors such as stress, and chemical factors such as alcohol intake [1] and drugs. Eye drops can also regulate the size of the pupil. Pupil dilation is measured in terms of pupil dilation ratio (ρ) which is the ratio of pupil radius over iris radius:
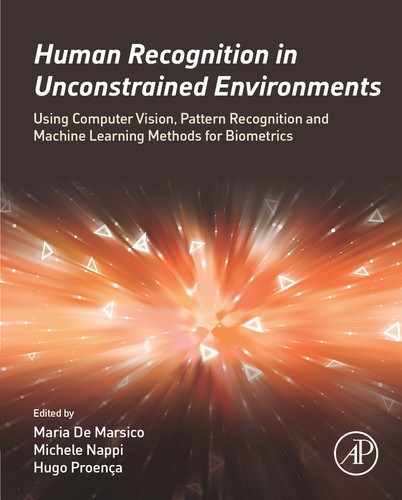
ρ typically varies from 0.2 to 0.8 in humans [5]. Smaller values of ρ indicate pupil constriction while larger values of ρ indicate pupil dilation. Fig. 4.3 shows two iris images of the same person at different visible illumination levels with a large difference in pupil dilation ratio.
Traditionally, the region between the pupillary and limbic boundaries is linearly sampled in order to unwrap it into a rectangular grid. This is referred to as the rubber sheet model [5]. It is often assumed, for the purpose of linear sampling, that the pupillary and limbic boundary are circular. One implementation of the rubber sheet model samples pixels radially along a fixed angular direction at regular intervals and maps them into a single column in the normalized image. This is repeated across multiple angular directions corresponding to different angular values. It was previously assumed that this type of linear sampling would be sufficient to handle changes in iris due to variation in pupil size. However, as can be seen in Fig. 4.4, employing the linear sampling of images in Fig. 4.3 results in different outputs.

The iris texture undergoes complex 3-D deformation when the pupil dilates or constricts. Hence, the linear normalization technique employed in Daugman [5] may not be a suitable method to match two images of the same iris with substantially different pupil sizes [7].
There are multiple ways to address this problem. These are pictorially represented in Fig. 4.5 and briefly discussed below.

Solutions to the problem of matching iris images with disparate pupil size may be incorporated at different stages of an iris recognition system, viz., image acquisition, normalization, encoding, and matching. Each of these stages could be modified either independently or in conjunction with the other stages to improve the iris matching performance.
Image Prediction. A deformation model based on the biology of the iris and the pupil could be used to predict how the iris texture would change as a function of pupil radius. Once the deformed iris pattern is predicted, subsequent processing steps such as normalization, encoding and matching can be applied without any modification. Examples of such an approach can be found in Wyatt [17] and Clark et al. [2].
Non-linear Sampling. A typical normalization technique radially samples the iris linearly in each angular position. The sampling scheme can be modified to better match the two normalized images [15]. Image prediction models could be potentially used to guide the non-linear sampling method.
New Encoding Method. A new feature encoding method can be developed to better match iris images with disparate pupil sizes. A corresponding matching method may have to be developed depending on the type of extracted features.
In this work, we propose a multi-scale fusion scheme where the IrisCodes generated using multiple Gabor filters are sequentially fused at the bit-level. The proposed scheme and its rationale is described in detail in Section 4.5.
4.1.2 Layout
This chapter is organized as follows. Section 4.2 discusses previous work on the topic of modeling the iris deformation due to pupil dilation and also on other types of IrisCode bit matching schemes. Section 4.3 describes the WVU Pupil Light Reflex (WVU-PLR) dataset that was assembled for the purposes of this research. Section 4.4 uses this dataset to demonstrate the negative influence of pupil dilation on iris recognition performance. The proposed method to mitigate the effect of pupil dilation is presented in Section 4.5. The experimental results are summarized in Section 4.6, while conclusions and future work are presented in Section 4.7.
4.2 Previous Work
4.2.1 Pupil Dilation
The previous work on this topic may be broadly divided into three categories based on their end goals. The first line of work tried to model the dynamics of iris deformation by deriving a theoretical model to understand the deformation process. The second line of work only focused on improving the iris matching performance in presence of pupil dilation without explicitly accounting for the biological basis for the associated deformation. The third category of work only focused on documenting the effects of pupil dilation.
Theoretical models include (i) minimum wear and tear model [17], where the iris tissue is assumed to be a network of orthogonal fiber like structures, and (ii) mechanical stress and strain model [2], where iris is assumed to be an elastic material enclosed between two concentric boundaries and the force is assumed to be exerted radially outwards from the pupillary boundary, while keeping the limbic boundary fixed. Wyatt's model [17] represented the iris deformation caused by pupil dilation as a sum of a linear term and a non-linear term, i.e.,
where ![]() is the solution to a linear deformation model and ΔR is the additional displacement of a point in the iris after application of the linear model. ΔR is approximated using a 6th order polynomial.
is the solution to a linear deformation model and ΔR is the additional displacement of a point in the iris after application of the linear model. ΔR is approximated using a 6th order polynomial.
Several techniques have been published to improve the matching accuracy when comparing iris images with different pupil size. For example, Yuan and Shi [18] used the minimum wear and tear model to derive an equation that predicted the displaced location of a point in the iris region after dilation. In another work, Wei et al. [16] approximated the non-linear term in Wyatt's model, ![]() , using a Gaussian distribution that in turn is learned from a training set. Thornton et al. [14] divided the normalized irises into a set of non-overlapping blocks, and computed transformation parameters between corresponding blocks of the images to be compared. Then the posterior probability of these parameters was maximized iteratively resulting in the optimal deformation parameter set. This information was used to compute block-wise similarity metrics that were averaged to produce a final score.
, using a Gaussian distribution that in turn is learned from a training set. Thornton et al. [14] divided the normalized irises into a set of non-overlapping blocks, and computed transformation parameters between corresponding blocks of the images to be compared. Then the posterior probability of these parameters was maximized iteratively resulting in the optimal deformation parameter set. This information was used to compute block-wise similarity metrics that were averaged to produce a final score.
Pamplona et al. [10] acquired extremely dilated images of a few eyes by administering mydriatic drugs that dilated the pupil. Specific points in the iris region were then manually annotated and tracked across the images. It was observed that points are displaced predominantly in the radial direction and structures such as crypts deform also in the angular direction. Hollingsworth et al. [7] demonstrated that pupil dilation degrades iris matching performance by grouping the images based on pupil dilation ratio and comparing them against each other.
4.2.2 Bit Matching
There have been other methods developed that exploit the characteristics of IrisCode bits to improve the performance of iris recognition. Hollingsworth et al. [8] used a matching scheme where only the “best bits” in an IrisCode are used. These bits are chosen based on their stability, i.e., they retain their value across different samples of the same eye. Rathgeb et al. [11] employed a selective bit matching scheme by comparing only the most consistent bits in an IrisCode. These consistent bits were obtained by using different feature extractors. In another work, Rathgeb et al. [12] proposed a new distance measure based on Hamming distance values that are generated when matching two IrisCodes at different offsets. In Short Length IrisCode (SLIC) [6], IrisCodes were compared using one row at a time, thereby allowing for faster exclusion of potential non-matches.
4.3 WVU Pupil Light Reflex (PLR) Dataset
Major drawbacks of the previous works are as follows: (i) Theoretical models have not been empirically validated; (ii) Software solutions require major alterations to existing systems; and (iii) Datasets used in previous work do not systematically measure the impact of pupil dilation on iris matching. Previously demonstrated effects of pupil dynamics were tested on generic datasets that were not specifically acquired for studying the effect of pupil dilation. As noted earlier, there are several other contributing factors such as focus, illumination changes and blur that can impact recognition accuracy. In our work, these factors are overcome by acquiring a dataset in highly controlled illumination conditions and distances as described in Crihalmeanu and Ross [3]. Videos are captured with a Redlake(DuncanTech) MS3100 multispectral camera at roughly 8 frames/second and stored as a sequence of still images. The camera is attached to the mobile arm of an ophthalmologist's slit lamp and connected to an Epix frame grabber. An annular ring light flanked by 2 NIR LEDs (810 nm) is placed in front of the camera and is connected via an optic fiber guide to a StelarNet light source (a voltage regulator and a tungsten–krypton bulb with a broad spectrum of 300 to 1700 nm). The two LEDs are used for an even illumination of the eye while the camera is focused prior to data collection. With the chin on the chin rest and gazing into the camera, the participant is given time to adjust to the darkness. Once the eye is in focus with the camera, the recording is started. After 10 s, the on/off button on the light source panel is turned on, the light is directed to the eye through the annular ring for an additional 10 s interval of time, after which the light is turned off. The video recording is stopped following 10 s of darkness. The NIR LEDs are on for the duration of the recording. The video captures the pupil dynamics: the constriction of the pupil when the eye is exposed to the flash of light and the dilation of the pupil when the eye adapts to the darkness. Fig. 4.6 depicts the variation of the voltage on the tungsten–krypton bulb. The camera acquires color infrared images (CIR) with a resolution of ![]() that includes the NIR spectrum as well as visible light spectrum. The data is collected from 54 subjects, one video/eye with an average of 130 frames/video. The total number of images is 7115 for the left eye and 6985 for the right eye with an average of 440 pixels across the iris diameter.
that includes the NIR spectrum as well as visible light spectrum. The data is collected from 54 subjects, one video/eye with an average of 130 frames/video. The total number of images is 7115 for the left eye and 6985 for the right eye with an average of 440 pixels across the iris diameter.

Examples of NIR images are shown in Fig. 4.7. Distribution of demographics and eye color information is presented in Tables 4.1 and 4.2.

Table 4.1
Demographics distribution
| Demographics | |
| Caucasian | 32 |
| Asian | 20 |
| African | 1 |
| African American | 1 |
Table 4.2
Eye color information
| Eye color | |
| Blue | 7 |
| Green/Hazel | 6 |
| Light Brown/Mixed | 4 |
| Brown | 10 |
| Dark Brown | 27 |
Relation between pupil radius ![]() and iris radius (
and iris radius (![]() ) may be represented as a difference, D, or a ratio, R; where
) may be represented as a difference, D, or a ratio, R; where
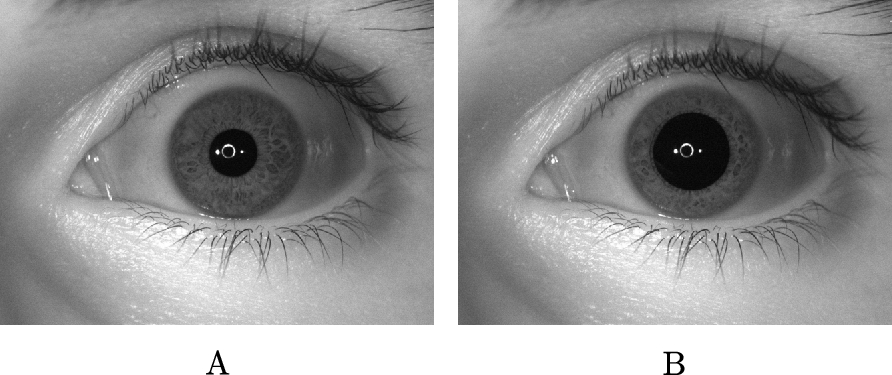
R is usually referred to in the literature as pupil dilation ratio. The iris radius does not change for all the eyes even when the pupil is undergoing dilation and constriction. Hence, only the pupil size is found to vary when the light source is turned on or off. Fig. 4.8 shows the histogram of pupil dilation ratio of a subset of 2218 images corresponding to the left eye in the dataset.
In this paper, we propose a novel distance measure based on traditional IrisCodes that are generated using Gabor filters of different sizes. This has several advantages over previously proposed solutions.
• It works with existing IrisCode. Hence, the original image and the intermediary normalized image are not needed.
• Computational overload is minimal since the proposed method works on binary data and Hamming distance is used to compute similarity.
4.4 Impact of Pupil Dilation
Pupil dilation is known to impact iris matching systems by increasing the Hamming distance between images of the same eye having different pupil sizes. Genuine scores are computed for images of the same eye at different pupil sizes in order to study the impact of pupil dilation. Relation between the pupil and iris radius for images ![]() and
and ![]() , denoted as
, denoted as ![]() and
and ![]() , respectively, can be computed as follows:
, respectively, can be computed as follows:

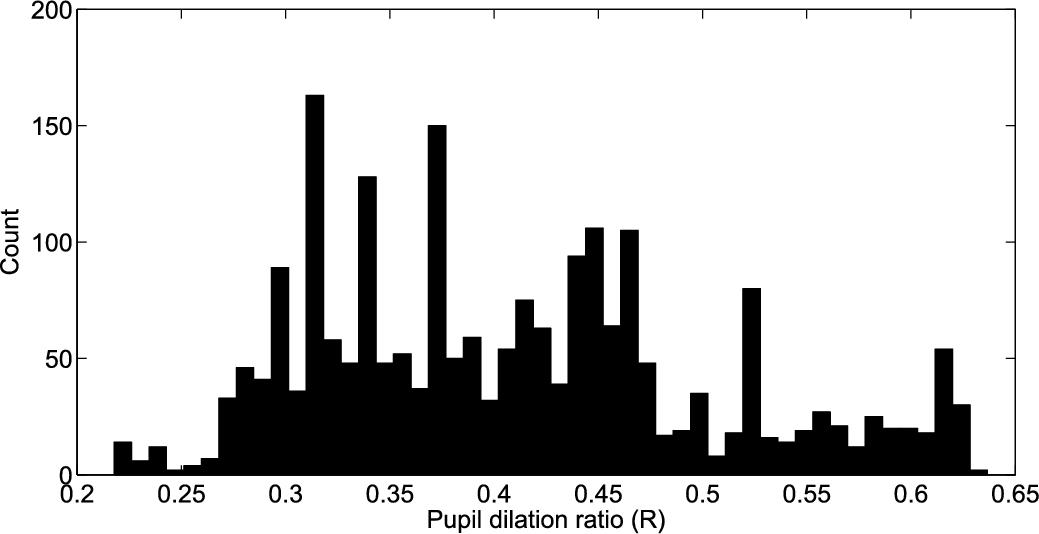
Fig. 4.9 shows the distribution of genuine Hamming distance scores as a function of (A) ![]() and (B)
and (B) ![]() . Typical iris radius is around 6 mm. The difference in iris widths and dilation ratios are scaled with respect to 6 mm iris radius and three different categories of dilation differences/ratios are considered. The boundaries between these categories correspond to approximately 0.5, 1, and
. Typical iris radius is around 6 mm. The difference in iris widths and dilation ratios are scaled with respect to 6 mm iris radius and three different categories of dilation differences/ratios are considered. The boundaries between these categories correspond to approximately 0.5, 1, and ![]() deformation in pupil radius.
deformation in pupil radius.
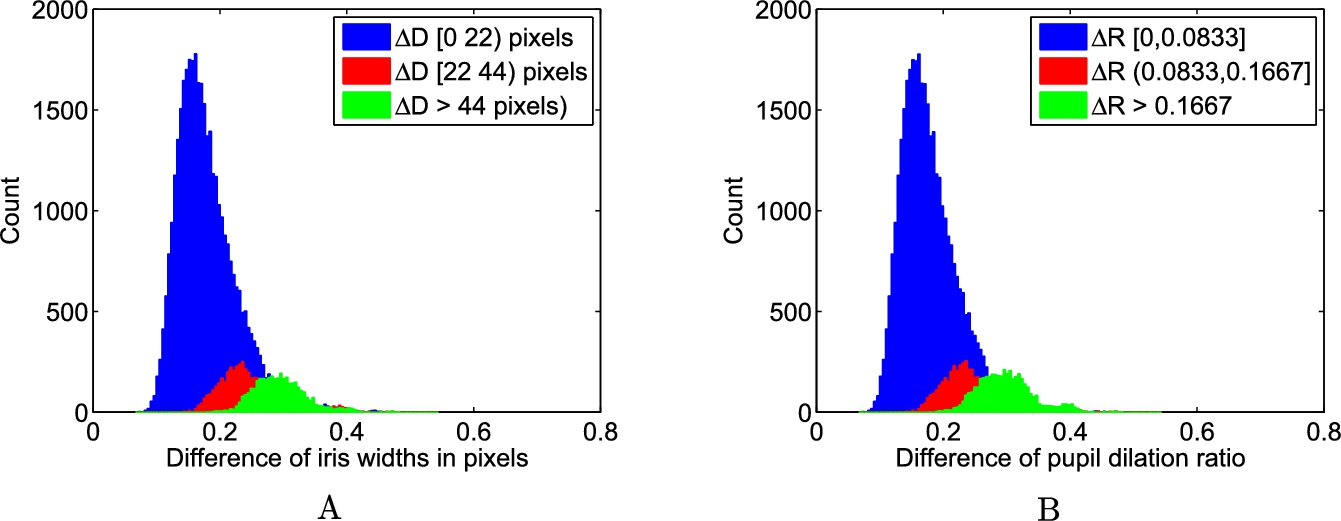
It can be observed from all the plots in Fig. 4.9 that, in general, larger differences in iris widths or pupil dilation ratios result in a larger Hamming distance when matching iris images of the same eye. This substantiates the previous findings of the adverse impact of pupil dilation on iris matching systems.
4.5 Proposed Method
4.5.1 IrisCode Generation
IrisCodes can be generated by applying multi-scale filters on a normalized iris image and quantizing the complex output. One such implementation by OSIRIS applies filters of three different sizes. Each filter produces two bits of IrisCode per pixel.
Let the ith image be denoted by ![]() . Its normalized image is denoted as
. Its normalized image is denoted as ![]() . The size of normalized image is
. The size of normalized image is ![]() where r is the radial resolution and t is the angular resolution. Three rectangular complex filters
where r is the radial resolution and t is the angular resolution. Three rectangular complex filters ![]() ,
, ![]() , and
, and ![]() are applied on the normalized image. The resulting complex output is then converted to a binary IrisCode set
are applied on the normalized image. The resulting complex output is then converted to a binary IrisCode set ![]() along with a mask
along with a mask ![]() . Fig. 4.10 pictorially shows an IrisCode set.
. Fig. 4.10 pictorially shows an IrisCode set.

Normalized image with size ![]() and
and ![]() for filter sizes
for filter sizes ![]() ,
, ![]() , and
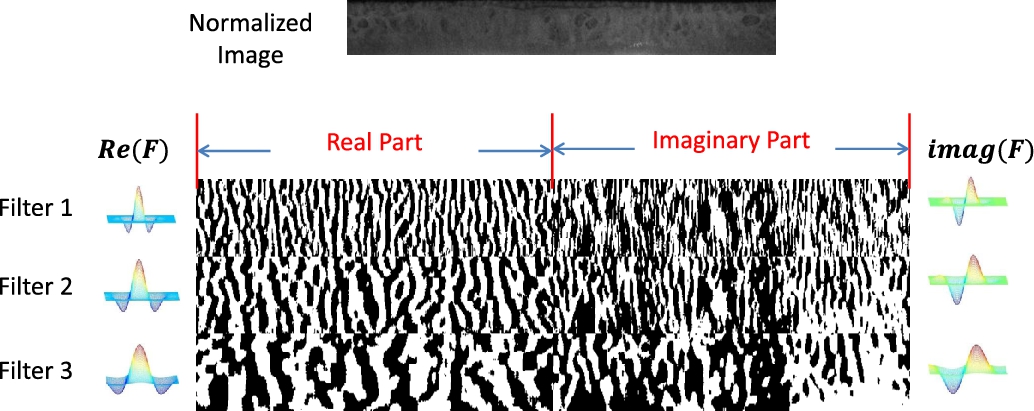
, and ![]() are used in this work. Fig. 4.11 shows a normalized iris image and its corresponding IrisCode generated using the 3 complex filters. The smallest filter encodes smaller regions in the image and the largest filter encodes larger regions in the image. This is reflected in the smoothness of IrisCodes at different filter sizes. Larger filter results in a smoother IrisCode compared to smaller filter.
are used in this work. Fig. 4.11 shows a normalized iris image and its corresponding IrisCode generated using the 3 complex filters. The smallest filter encodes smaller regions in the image and the largest filter encodes larger regions in the image. This is reflected in the smoothness of IrisCodes at different filter sizes. Larger filter results in a smoother IrisCode compared to smaller filter.
4.5.2 Typical IrisCode Matcher
Suppose that IrisCode sets generated from two normalized images ![]() and
and ![]() are being matched. The IrisCode sets are represented as
are being matched. The IrisCode sets are represented as ![]() and
and ![]() , respectively. A common mask,
, respectively. A common mask, ![]() , is computed to denote the location of common valid bits in both the IrisCodes.
, is computed to denote the location of common valid bits in both the IrisCodes.
Let the result of XOR operator, ⨂, for matching individual IrisCodes at filter F be ![]() given by
given by
⨂ results in 0 if the corresponding bits are the same and 1 if they are not. Hamming distance between two IrisCodes at the fth filter scale is then given by

Typically, the Hamming distances computed for each filter are fused using sum rule to produce a final matching score.
The above described steps employed by a typical iris matcher are presented in the form of a flow chart in Fig. 4.12.

4.5.3 Multi-filter Matching Patterns
Three filter outputs are available at each pixel location in an iris image. Hence three filter matching results (![]() ) are generated at every location when two IrisCode sets are matched. These three results at each location may be combined and represented as a single vector, R, which is hereby referred to as the matching bit pattern at every bit location. It can have values from
) are generated at every location when two IrisCode sets are matched. These three results at each location may be combined and represented as a single vector, R, which is hereby referred to as the matching bit pattern at every bit location. It can have values from ![]() . Here, 000 at a specific location would mean that the pixel matches at all the filter scales; 100 would mean that although the pixel is mismatched by filter 1, it is matched by filter 2 and filter 3. Similarly 111 would indicate that the pixel is mismatched at all filter scales.
. Here, 000 at a specific location would mean that the pixel matches at all the filter scales; 100 would mean that although the pixel is mismatched by filter 1, it is matched by filter 2 and filter 3. Similarly 111 would indicate that the pixel is mismatched at all filter scales.
Fig. 4.13 shows the distributions of these matching patterns for a few cases of intra-class matching corresponding to one subject. The legend in the plots denotes the size of pupil radius in pixels of the two images that are being matched. It is observed that the percentage of 000s (matched by all filters) decreases with increase in difference of pupil dilation ratios between the matched samples. Fig. 4.14 shows distributions of multi-filter matching patterns for a few randomly selected inter-class (impostor) pairs in the dataset. It is observed that the distribution of these decisions is roughly equal and similar across the decision patterns.


In a traditional sum rule matcher, the instances of ![]() are summed up and divided by the total number of locations. However some interesting patterns are observed in the distribution of these multi-filter matching patterns for genuine and impostor matching cases. Fig. 4.15 shows the distribution of these matching results from three different filter scales for genuine and impostor matching cases.
are summed up and divided by the total number of locations. However some interesting patterns are observed in the distribution of these multi-filter matching patterns for genuine and impostor matching cases. Fig. 4.15 shows the distribution of these matching results from three different filter scales for genuine and impostor matching cases.

It is observed from Fig. 4.15 that some matching patterns such as 000, 011, 101, 110, and 111 are much more discriminative compared to others. Hence, these filter decisions could be selectively fused to provide better performance.
4.5.4 Proposed IrisCode Matcher
The idea behind the proposed method is to make a matching decision at each pixel location based on information at multiple scales. The distribution of decision patterns shown in the previous section is exploited to come up with a better decision strategy. IrisCode bits generated from multiple filters are selectively matched to compute a final dissimilarity score. This is pictorially depicted in Fig. 4.16.

Multiple decision making strategies can be developed to allow for stricter or easier matching conditions. The proposed matching strategies are described below.
Method 1. Two iris images ![]() are first matched using IrisCodes generated by filter 1 at each bit location,
are first matched using IrisCodes generated by filter 1 at each bit location, ![]() . If the images are not matched by filter 1, i.e.,
. If the images are not matched by filter 1, i.e., ![]() , then the matching is extended to IrisCodes generated by larger filters 2 and 3. The bit location is deemed a match, if IrisCodes are at least matched by filters 2 and 3. This helps in handling local deformations since match is established at a larger scale for those bits that would have otherwise mismatched at smaller scales.
, then the matching is extended to IrisCodes generated by larger filters 2 and 3. The bit location is deemed a match, if IrisCodes are at least matched by filters 2 and 3. This helps in handling local deformations since match is established at a larger scale for those bits that would have otherwise mismatched at smaller scales.
Method 2. This method relaxes the conditions for a match. If two IrisCodes are not matched at the lowest scale, an additional opportunity is provided at medium scale filter 2. In case IrisCodes are not matched by filter 2, then a final opportunity is afforded by larger filter 3.
Method 3. This method provides a stricter matching criterion by requiring the IrisCodes to match at filter 1 as well as either filter 2 or filter 3. This method removes the possibility of matching locally deformed regions. Only those regions that are matched at multiple scales are deemed a match.
The logical operations shown in Figs. 4.17, 4.18, and 4.19 are used in a sequential fusion step in Fig. 4.16 and can be implemented using a single Boolean expression. Corresponding truth tables are used to derive the Boolean expression that directly computes the final result based on the decisions at each scale. Hence, a single decision is made, i.e., ![]() (match) and
(match) and ![]() (non-match), at each bit location in an IrisCode. The final decision will be equivalent to applying a single complex filter on the normalized image. Let the final matching decision bits be presented as a matrix R. Hamming Distance between two IrisCode sets
(non-match), at each bit location in an IrisCode. The final decision will be equivalent to applying a single complex filter on the normalized image. Let the final matching decision bits be presented as a matrix R. Hamming Distance between two IrisCode sets ![]() and
and ![]() is then given by
is then given by
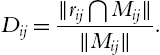
Table 4.3 shows the logical operations for these three methods along with the simple sum rule fusion.


Table 4.3
Logical operations used to combine the output of multiple IrisCodes
| Fusion | Logic |
| Sum rule | R1 + R2 + R3 |
| Method 1 | R1&(R2|(∼R2&R3)) |
| Method 2 | R1&R2&R3 |
| Method 3 | R1|(∼R1&R2&R3) |
4.6 Experimental Results
The proposed methods are tested on left eye images acquired at full illumination in the proprietary pupil dilation dataset. A total of 2218 images of left eyes from 52 subjects is used to test the proposed methods. The images are automatically segmented, normalized and encoded using the OSIRIS_v4.1 SDK. Semilog ROCs are presented to better observe the performance at low FARs. A total of 46,480 genuine scores and 1,696,504 impostor scores are generated. Fig. 4.20A shows ROCs for the full data. It is clearly seen that all three methods improve upon the traditional sum rule fusion method. However, generic matching using Masek's 1-D encoded IrisCodes [9] is observed to provide better stand-alone performance. Proper parameter tuning using 2-D Gabor filter would probably yield better performance in which case the proposed method is expected to further improve the performance. It can also be observed that fusing scores from Method 1 with match scores from Masek's 1-D encoded IrisCode provides the overall best performance.

In order to observe the proposed methods' impact on deformed iris patterns, scores for traditional matching and proposed methods are compared based on differences in pupil dilation ratio are examined. The genuine scores are divided into three dilation groups – small, medium, and large – depending on the absolute value of the difference in pupil dilation ratio between a pair of images used to generate the match score. Impostor distributions are kept the same for the respective methods. These ROCs are shown in Fig. 4.21.

It is evident from the ROC plots in Fig. 4.21 that the proposed methods have a larger positive impact when comparing highly deformed iris patterns than when comparing two images with almost the same pupil dilation values. Fusing best performing Method 1 with Masek 1-D method [9] provides the best overall performance when comparing images with a larger difference in pupil size.
These matching methods are not only useful for handling deformation due to pupil dilation/constriction, but they can be used to address other types of deformations due to non-precise segmentation, etc. To validate the efficacy of these methods, experiments were conducted on WVU non-ideal [4] and QFire [13] datasets as well. WVU non-ideal dataset has 1557 images from 241 subjects obtained under non-ideal conditions exhibiting the presence of blur, out of focus, and occlusion. A total of 5277 genuine scores and 1,206,069 impostor scores are generated on the WVU dataset. QFire has 1304 left eye images from 90 subjects imaged at various acquisition distances. A total of 8847 genuine scores and 840,709 impostor scores are generated on QFire dataset. Fig. 4.22 shows the result of applying the proposed matching methods on WVU and QFire datasets, and the improvement in performance is clearly seen.

4.7 Conclusions and Future Work
A novel selective matching scheme based on IrisCodes obtained using multiple scale filters is proposed. It is shown to improve the performance when matching images with large difference in pupil dilation ratios and is also shown to improve generic non-ideal iris matching. Future work will aim at exploring other matching strategies, which are based on a deeper understanding of the advantage of these methods. The distribution of multi-filter decision patterns could be used as a feature vector and a classifier could be trained to select the best decision strategy. In this work, filter sizes are increased along the angular direction; in the future, we aim to explore other filter sets such as those increasing in the radial direction, combination of radial and angular filters, etc.