
Chapter 4 Business-centric business intelligence development with the BI pathway method
“The key question is whether a firm’s investment in information technology is in harmony with its strategic objectives … and thus building the capabilities necessary to deliver business value. This state of harmony is referred to as ‘alignment.’ It is complex, multi-faceted, and never completely achieved.”
—Peter Weill and Marianne Broadbent, Leveraging the New Infrastructure, 1998
There’s good news and bad news about the business value of business intelligence (BI). The good news is that management is paying more attention to it. The bad news is why they’re paying attention: all too often, BI hasn’t delivered the return on investment (ROI) that it promised. It has eaten up money and resources but, in the end, delivered little. However, the other good news is that things don’t have to be that way. If we plan and manage BI as a business investment instead of a technological toy, it can outperform our most optimistic forecasts. What’s been missing until recently is the evolution of BI methods to capture the full business value of BI. And that’s what we’ll tackle in this chapter.
All of the traditional BI methods encompass structures, components, activities, and deliverables that seek to put the right information into the hands of the right people at the right time. Some of those methods are stronger than others, but they are all address the need for BI to have a business impact. Where the traditional technically focused methods fall short is in ensuring that BI investments pay off. The principal limitations of the traditional methodologies, from the point of view of ROI delivery, are that they
This is not to say that traditional approaches are deficient for designing, building, and deploying data warehouses. These approaches have proven excellent for those tasks. Rather, we simply mean that such approaches do not design ROI into the process, which sometimes results in BI investments that don’t pay off as well as they should.
These shortcomings of traditional, technically focused methods are a consistent theme that we hear over and over, both as instructors and as consultants. We’ve observed that these shortcomings are owing to the following:
This might sound heretical, but IT too often assumes that the SMEs understand BI and its potential—when they don’t. Because SMEs come from the business and are considered to be experts in the business, IT assumes that they should be the natural source of BI requirements. IT too often assumes that SMEs have given sufficient thought to the subject so that they can articulate a cogent and comprehensive vision of how BI can be applied in their subject area—when they haven’t. If you’re lucky enough to work with visionary or enlightened SMEs, those assumptions can sometimes work—but just as often, they don’t. In many cases, the SMEs don’t understand BI and/or they don’t have time really to think through BI opportunities and requirements. We’ve seen this time and again within major organizations in a wide range of industries.
To solve these problems, we have developed a business-centric BI method called the BI Pathway method. Many organizations are used to running the business based on inadequate access to information. Unfortunately, these legacy information delivery paradigms frequently go unchallenged as businesses invest in DW. The unfortunate result is expensive DW implementations that have minimal business impact. The BI Pathway method strives to identify new information delivery paradigms that identify how organizational performance can be optimized based on having adequate access to information to guide business decisions and take business actions.
DW has historically focused on the technical challenges, technical methods, and project management methods required to successfully deploy data warehouses and data marts. In contrast, the BI Pathway method extends the important contributions to DW that were popularized early in the industry by Inmon, Kimball, Imhoff, and others. The BI Pathway complements these contributions by adding business rigor into BI business analysis and design activities. ROI is designed into BI initiatives from the outset by systematically driving the use of BI into the core business processes and decisions that determine profits. The BI Pathway method goes beyond traditional approaches by defining the business value capture mechanism for each BI project (Williams and Williams, 2004). It recognizes that the missing link in many DW efforts is the lack of clarity in the value proposition and/or the lack of business process change to capture the business value of BI.
Up to this point in the book, we have focused on introducing BI to business executives. We have talked about what BI is, how it can be leveraged to improve profits, how to identify and prioritize BI-driven profit opportunities, and how to identify the business risks that must be mitigated and managed in order to ensure that BI investments pay off.
In this chapter, our focus is to provide information for chief information officers (CIOs), business executives, and managers with an interest in IT and process reengineering methods, as well as for the BI project teams who are charged with delivering BI that makes a difference. We will describe the BI Pathway method, a full life-cycle, business-driven approach to designing, developing, and deploying BI applications that improve profits. This approach marries business-centric BI methods with proven traditional technical methods to reduce risk and ensure BI success.
This chapter focuses on BI methods that are essential to ensuring business value. These methods go beyond conventional DW industry approaches practiced by most organizations today. Incorporated into the BI Pathway approach are some of the “best practices” (e.g., the need for an “architectures phase”) taught by The Data Warehousing Institute (TDWI) for many years. The BI Pathway’s DW components, such as data acquisition design and data mart models, are not unique to the BI Pathway and are rather technical. Because other DW publications and books cover these topics very well, and each could warrant its own book, we have decided to cover these topics only as they relate to the BI Pathway.
Note: We’ve used as much plain English as possible, but parts of this chapter are unavoidably somewhat technical. Nontechnical readers can feel free to skip over these sections or refer to the glossary in the back of the book.
4.1 The BI Pathway Overview
In Chapter 3, we noted that a company’s ability to leverage BI to increase profits depends on three things: the ability of the company to align and govern a BI program, the ability of IT to perform technically, and the ability of the business to change in order to leverage BI within core processes that have a profit impact. This concept is shown graphically in Figure 4-1.
We need business-centric BI methods that ensure business and IT managers are aware of these three success factors. These methods must provide an integrated, mutually reinforcing approach to addressing the success factors. The BI Pathway approach meets those needs, extending traditional methods while embracing the best of industry-proven technical approaches and tools.

FIGURE 4-1 Three crucial business intelligence success factors: align, leverage, and deliver.
4.1.1 Unique Characteristics of the BI Pathway Method
The BI Pathway method (“the BI Pathway”) is an iterative, full life-cycle method consisting of three phases, each with specific purposes and deliverables.
The architectures phase focuses on managing the alignment and governance of the BI program or initiative. Although other DW approaches include an architectures phase, the BI Pathway method incorporates a number of unique program-level activities, including the following:
The implementation phase uses industry best practice approaches to iterative, incremental technical delivery. In addition, it applies analytical and design rigor to ensure a full understanding of requirements and the “value proposition” associated with a BI release, including the following:
Pitfall
BI requirements are a common stumbling block for organizations because these requirement techniques are unlike operational system requirements techniques. They also go well beyond the techniques used to specify reports.
The operations and continuous improvement phase focuses on improving the cost-effectiveness of BI delivery to intended users and on discovering new ways to use BI to improve core business processes. The specific activities and deliverables within the three phases provide a structured, systematic way to design, develop, deploy, and continuously improve BI applications that increase company profits. This phase also provides the unique features of instituting business performance metrics that quantify improved business performance in line with ROI expectations for a BI application.
Although the basic flow of activities is shown in Figure 4-2 as a top-down flow, the architectures phase, via the BI opportunity map, effectively sets the stage for developing and deploying BI increments in a time-boxed, iterative fashion via repetition of relevant portions of the implementation phase.
4.1.2 Organizational Tailoring of the BI Pathway Method
The BI Pathway is designed to be used in practical, flexible ways based on the company context. For example, the approach to the architectures phase activities and deliverables can be and should be tailored according to such factors as the following:

FIGURE 4-2 Overview of the BI Pathway method.
We have used the BI Pathway in a wide range of industries, such as lodging, financial services, government, consumer products, industrial products, and high-technology manufacturing. In these widely different contexts, our clients were at different stages of BI maturity. Some were essentially clean slates, and others had years of BI experience and had established large-scale BI environments. Based on these experiences, we find that business-centric BI methods in general, and the BI Pathway in particular, are appropriate in any organization, in any industry, and at any stage of BI maturity. The key is to effectively customize the application of the BI Pathway to the specific industry and company context.
The BI Pathway is a results-oriented framework for organizing a sequence of activities aimed at producing specific deliverables that fit together and guide effective design, development, deployment, and continuous improvement of BI applications that improve profit. It has been designed specifically to overcome the shortcomings of traditional technically oriented methodologies and to leverage the strengths of traditional methodologies, and the wide range of associated best practices, to execute the technical portions of the BI life cycle.
What this means is that the BI Pathway encompasses new, business-driven analytical, architectural, and business process re-engineering activities and deliverables that drive subsequent technical activities. The technical activities can be performed by using an appropriate, proven technical methodology that fits for the specific BI context. For the BI Pathway, the technical elements of the Implementation phase are based on proven approaches that have been taught by TDWI for more than a decade.
That said, the BI Pathway can be adapted to work with other organizational development approaches, as long as such methodologies are adapted to the need for business-driven analytical, architectural, and business process re-engineering activities that provide the distinct BI Pathway advantage.
The BI Pathway approach, although using standard implementation steps, deliverables, and guidelines as a starting point, can be implemented flexibly to work within any organizational context. For example, requirements activities are commonly tailored to an individual organization to ensure the optimal outcome. This may leave some development teams in an uncomfortable position if they are accustomed to highly formal, step-by-step, template-based methodologies from the transactional applications configuration or development worlds. For example, we worked with a team that had no BI or DW design or development experience. The team was led by an individual with years of experience configuring SAP R/3 ERP systems and was staffed by application developers accustomed to using the rational unified process to iteratively develop chunks of application code. This team was extremely uncomfortable operating without a highly prescribed, template-driven approach, and it had difficulty making the paradigm shift to the BI/DW way of designing and developing. We relate this story because we often encounter situations in which BI and DW methods are either new or not well ingrained in the IT organization. This can be overcome by training and by building the technical capabilities of the team around experienced senior BI and DW professionals. There is such a rich body of best practices for the technical side of BI and DW that it does not make sense not to leverage those best practices. That is what the BI Pathway does.
Tip
The BI Pathway, like any BI/DW approach, provides a guideline for your BI initiatives. It must be tailored to your organization to provide maximum value.
4.2 Part 1: The Architectures Phase of the BI Pathway Method
The architectures phase of the BI Pathway method encompasses all of the activities needed to institute and govern a BI program. It serves as an organizing framework for the business alignment, prioritization, planning, development, and support of individual, dependent BI projects. Organizations that begin DW and BI initiatives frequently overlook the need for an architectures phase. It is common that this need is identified once they have implemented several BI applications and experience some of the problems we will discuss in this section.
4.2.1 The Case for Investing in an Architectures Phase
According to Webster’s Dictionary, a program is “a plan or system under which action may be taken toward a goal.” When funding a BI initiative, the goal is to leverage information assets to support informed decisions that lead to actions that improve business performance. Architectures phase activities are critical to achieving this goal.
Common symptoms of organizations that do not adequately pay attention to and fund architectures phase activities are as follows:
Although critical to the success of a BI initiative, there are frequently organizational impediments to instituting architectures phase activities. The first impediment is that the need for BI program is not always recognized by organizations because the concept of a program is frequently a paradigm shift for IT departments and business sponsors and stakeholders that are used to funding and managing individual application development projects. An additional impediment is a common organizational belief that the value of IT starts when the coding begins. Planning, analysis, and design activities are not assigned the same level of importance as technical activities. This, coupled with the imperative for IT to “deliver” an application, often gets in the way of critical program-level activities. Finally, even when there is a recognition that program-level efforts are important, many organizations lack ways to fund such initiatives.
Tip
Whether you use the BI Pathway or some other BI/DW approach, it is critical to include program level planning, analysis, and design activities to avoid business and technical problems later.
4.2.2 BI Pathway Architectures Phase Overview: Aligning the Business Intelligence Program to Deliver Return on Investment
Earlier, we mentioned the idea that to increase profits by leveraging BI, we need to be able to align and govern a BI initiative or program. This requires strategic alignment of BI with your company’s competitive environment and critical success factors. It also requires creating an effective alignment between the business user community and the IT team charged with designing and delivering BI to support the business. Finally, it requires your ability to govern the business and IT processes required to deliver BI, whether as a single BI initiative or as a portfolio of BI projects. The American Heritage Dictionary defines architecture as “any design or orderly arrangement perceived by man.” From a business and technology perspective in the BI context, we are concerned about designing, creating, and maintaining/adjusting an orderly relationship between the environment in which your company operates and your company’s business strategy, business operations, IT strategy, and IT operations (Henderson and Venkatraman, 1990; Cooper et al., 2000). You create this relationship to ensure that your investment in BI is building capabilities that create incremental profit. The architectures phase of the BI Pathway (Figure 4-3) focuses on this crucial task.
The architectures phase of the BI Pathway focuses on creating an orderly alignment among the following:

FIGURE 4-3 The architectures phase of the BI Pathway method.
Practically speaking, alignment is “complex, multi-faceted, and never completely achieved” (Broadbent and Weil, 1998). Our experience with leading companies in different industries supports this assertion, and as with any conceptual framework, Figure 4-3 is an oversimplification of the business reality. That said, the relationships among the architectural components described above can be analyzed, characterized, aligned, and managed to improve profit if your company has the will to do so. It’s vital that you convince business executives of the value of doing so, and that gets you deeply into tailoring the use of the BI Pathway.
Another key is to recognize that it is not practical or advisable to overanalyze these architectural components and their relationships. Massive project teams do not need to be used to accomplish the goal of understanding and aligning the factors that drive BI success. Compared with the tens or hundreds of millions of dollars that companies have spent on enterprise IT “solutions” to generate transactional data, the $100,000 to $1 million spent to align these architectural factors is a drop in the bucket that helps ensure returns in the tens of millions of dollars.
From an execution perspective, the architectures phase of the BI Pathway provides a framework for systematically analyzing and documenting the architectural components so that they can be adjusted, aligned, and managed to support BI success. The specific analyses, methods, and deliverables we use to do this are shown in Figure 4-4.
When done correctly, performing the analyses and developing the deliverables prescribed for the architectures phase of the BI Pathway provides empirical information that enables your company to

FIGURE 4-4 Analyses, methods, and deliverables in the BI Pathway.
In effect, this empirical information increases the likelihood that your BI investment will pay off. That said, there are no silver bullets when it comes to BI and ROI. The analyses, assessments, and deliverables that compose the architectures phase of the BI Pathway are only as good as the quality of information, effort, rigor, and thinking that you bring to bear. For more information on the architectures phase of the BI Pathway, you might wish to take advantage of the full-day course on the BI Pathway method offered by TDWI (http://www.tdwi.org).
4.2.3 Setting the Architectural Foundation for Business Intelligence Project Success
The BI Pathway implementation phase consists of design, development, and implementation activities that create a BI project asset. Unlike operational systems that are designed independently to support a specific functional business area, BI projects are usually dependent projects, accessing the same source systems for data and overlapping in business subjects, and accessed by the same business users. Because of this dependency, it is critical that they use the same architectural foundation to avoid many of the problems outlined earlier in this chapter. The BI program architectural decisions that are made during this effort are documented in the BI program charter deliverable mentioned in the earlier BI architecture discussion. This architectural foundation is composed of four distinct but closely related architectures:
These architectures may exist in various stages of maturity in any given company, ranging from a blank slate for companies with no BI and DW experience to fully specified architectures for all aspects of BI and DW in companies with more mature BI and DW programs. In discussing the architectures phase of the BI Pathway, we noted that we need to understand the BI architectural context, but we did not elaborate. Before we describe the various implementation phase technical activities, let’s take a look at the BI architectural context in which they occur. That context is largely determined by the governance structure, data architecture, and the technical architecture, as well as (to a lesser degree) the operational architecture.
Pitfall
Organizations often fail to appreciate that BI projects are unlike operational systems designed independently to support a specific functional business area. BI projects, in contrast, are usually dependent projects. They access the same source systems for data, overlap in business subjects, and are accessed by the same business users. Because of this dependency, it is critical that all BI projects use the same architectural foundation.
Governance Architecture
Because there is a wide range of issues in the BI arena that need to be managed across all individual BI project efforts, it is important to establish organizational authority, as well as roles and responsibilities, for these items. Typical areas of governance include the following:
Data Architecture
As noted earlier, there are options for how you implement BI and DW, depending on your company’s circumstances, BI maturity, and overall BI strategy. Generally speaking, data architecture is the means by which BI—in the form of business information, business analyses that use the business information, and flows of information to decision makers—is delivered for use in business processes that improve profits. This concept is illustrated in Figure 4-5.
The data architecture encompasses data structures, databases (source and target), data flows, and data integration. It also includes the data and meta-data requirements for the BI/DW environment. The data architecture is represented as a high-level model that illustrates the desired databases, the roles each will play, and the data flows between the databases. The typical roles that are discussed within the industry include the following:
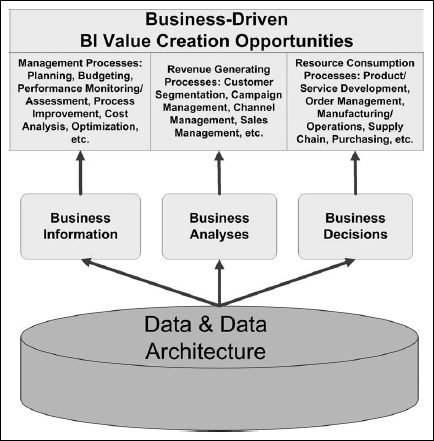
FIGURE 4-5 Architecture to deliver data for increased profits.
Within these broad parameters, a variety of technical means exist to provide for these roles, which means that there are a number of data architectures from which to select. The advantages and disadvantages of the various data architectures are beyond the scope of this section. The important point to consider here is that the choice of data architecture influences what tasks are undertaken and the methods for performing those tasks.
The implementation phase of the BI Pathway tasks are aimed at designing, developing, and deploying BI within a basic two-tier data architecture, as shown in Figure 4-6.
The data warehouse is responsible for intake, integration, and distribution needs. BI access and delivery is handled through data mart and other types of BI applications. Although the starting point for the BI Pathway data architecture is a two-tier hub-and-spoke data architecture, other configurations may be optimal depending on their specific organizational factors. The BI Pathway method can actually be used in conjunction with any of a number of traditional data architecture approaches, and thus from a technical perspective, it is “nondenominational.” As long as the right business information is deployed within core business processes to support key analyses and decisions that affect profits, it doesn’t matter which approach is taken. We’ll have more to say on that in Chapter 5.
Technical and Operational Architectures
The implementation phase of the BI Pathway includes an activity labeled “technology installed, ready, and trained.” This is a highly simplified, high-level shorthand for the idea that any BI initiative occurs in an existing or new technical architecture and technologies. Together, the technical architecture and the operating architecture can be thought of as the target technical environment. This is where “the rubber meets the road,” where the business requirements for BI and the logical representations of the data must be converted into the physical IT processes and data stores that move and store the bits and bytes. Accordingly, we must either use the existing technical environment or design and implement a new technical environment. In the past few years, we have worked in a variety of companies with a range of technical environments. Two common situations are as follows:

FIGURE 4-6 Basic data architecture in the BI Pathway.
The maturity and characteristics of the target technical environment affect the cost, schedule, and technical risk for a given BI initiative, and thus they affect ROI. Understanding the technical environment allows you to make sound technical plans, ensure timely availability of technical expertise with the right skills for the environment, and anticipate technical risks. This understanding helps you avoid cost overruns and schedule delays that reduce—and in extreme cases, even eliminate—ROI.
4.2.4 BI Pathway Architectures Summary
Similar to building a house that contains many rooms that must work together, the job of the BI architectures is to provide the foundation for delivering business information that works together and provides a “single version of the truth” that guides actions that improve business performance. The required effort to achieve this is much larger than funding individual BI applications projects and requires a solid BI architectural foundation to guide and govern individual project efforts. There are numerous case studies within the industry of DW failures resulting from individual BI project efforts that delivered unarchitected information silos with little business value. In contrast, the architectures phase of the BI Pathway provides the solid BI program foundation needed to set a course for fully leveraging information assets to achieve business value.
4.3 Part 2: The Implementation Phase of the BI Pathway Method
During the architectures phase, we created the BI opportunities map, which is a tool to help prioritize BI projects. The implementation phase of the BI Pathway is an iterative approach that helps you complete BI projects (sometimes called “increments” or “releases”) in as short a time as possible given the scope of the project and the constraints from the target technical environment, organization, and budget. By use of this approach, the BI opportunities identified during the architectures phase are incrementally developed and deployed during the implementation phase. This incremental, release-driven approach is shown in Figure 4-7, wherein BI projects sequentially flow from the BI opportunity map into the implementation phase for development and deployment.
The architectures phase and the implementation phase are connected by the BI requirements and the business process re-engineering models developed during the architectures phase, what we call the “information requirements.” As we set about to build each increment, we further refine and complete the detailed requirements for that increment that support and reinforce the business justification for building the increment, and those requirements drive the implementation phase activities and deliverables. By use of such detailed requirements, we can apply proven BI and DW technical methods in a logical sequence aligned via an integrated set of technical deliverables. We can also execute the business process re-engineering required to ensure that the new BI delivered is fully leveraged to improve profits. The basic flow from requirements through the implementation phase activities is shown in Figure 4-8 below.

FIGURE 4-7 The business intelligence opportunity portfolio.
When all of the above activities and their associated deliverables have been completed for an individual increment, you have deployed a usable BI application within a new or modified business process that creates incremental profit for your company. You have created a BI asset, ready to be leveraged. As each project identified in the BI opportunity map is delivered, the BI asset increases in value and affords your company more ways to improve profits.
The implementation phase consists of an integrated series of activities that produce specific deliverables that feed or complement subsequent activities and deliverables. Because all activities are based on the requirements and business justification for investing in the BI application, there is full traceability throughout the process. In other words, there should not be information in the BI application that cannot be explained vis-à-vis the detailed requirements and the business value of having that information. As noted earlier, the BI Pathway method leverages established technical best practices, about which there are many excellent reference books and courses. Accordingly, we will not get into the technical details here. Rather, we will share some high-level observations and case examples to highlight some of the key challenges and success factors that must beaddressed during the implementation phase.

FIGURE 4-8 Business intelligence development process flow from requirements through implementation.
Detailed Requirements and Re-engineered Business Processes
As shown in Figure 4-8, detailed requirements consist of the following:
Notice that detailed requirements are much more than just a simple list of data elements. There is a very specific connection between a business process that has a profit impact, as determined via BI opportunity analysis, and the BI that would be deployed within the business process to improve profit. That connection is what we mean by the term business value capture mechanism. How must current business processes change to leverage BI to increase profit?
The detailed requirements, as described above, are absolutely critical in that they determine what physical IT processes and databases get built during the implementation phase. They also describe which business processes must change and how they must change and the intended use of the information once it becomes available to business users. It is unfortunately common that organizations do not have a common understanding of the intended use of information. Rather they simply expect the flexibility to perform ad hoc analysis as needed. This lack of clarity makes it impossible to determine the potential business value of a BI application, and this lack of a common understanding regarding how BI applications will be used once they are deployed also explains why may BI applications go unused once training is complete. Accordingly, it is imperative that the requirements be complete, well considered, and clearly defined. It is also critical that business users have a clear and common understanding regarding the intended use of the information, within the context of business processes, once it is made available. This understanding must be relevant to the business and must address a business problem that needs to be solved to improve business performance. In other words, we must explicitly “connect the dots” between the information, how it will be used, and how this will translate into improved business performance. We like to call it answering the “so what?” question associated with detailed information requirements. By building rigor into this analysis, BI applications are funded or not funded, as well as implemented or not implemented, based on the merits. Databases are designed for a purpose, rather than serving as a general “one size fits all” repository that serves no one very well.
The need for good requirements translates to the need for experienced business professionals to vigorously and rigorously examine the business value capture mechanism to assess its soundness. In effect, the business value capture mechanism is an up-front hypothesis that states: “If we change Process A by adding this specific business information and performing this specific business analysis to support this specific decision, we will be able to improve profit by X% or $X million.” Before investing capital to build and deploy a given BI increment, companies would be well served to examine such hypotheses in detail. The results of the detailed requirements and re-engineered business process analysis get translated into the data and data relationships needed to satisfy the requirements. This is the input needed to create the logical data mart model.
4.3.1 Logical Data Mart Modeling
Once requirements are known, they need to be translated into a logical model that represents the type of analysis that will be made available through the BI application. This is an extra step of analysis and design that is done “on paper” to make sure that the type of the requirements for analysis are clearly understood by IT. These models use standard logical data modeling notation and are “translated” by the data modelers to the business audience to ensure that there is a common understanding of what will and won’t be contained within the BI application. The value proposition of having this information is also confirmed during this review session. Frequently, questions about business definitions, business hierarchies, and data quality issues surface during these reviews. The results of the logical data mart model review becomes input into designing the data mart prototype.
The Importance of Data Mart Prototyping
One of the challenges of doing requirements well is that human language is often ambiguous. For example, we once spent the better part of four hours in a discussion with a small group in the marketing department of a major hotel company in order to arrive at a consensus on what the term “customer” meant to that company. Another key challenge of doing requirements well is maintaining sponsor enthusiasm for a BI project or program in the face of sponsor impatience with the development process. To overcome these challenges, we strongly recommend the use of a data mart design prototype, which is an inexpensive, time-boxed effort that uses a sample set of production data and the BI tool that will be used to deploy the BI application to help the business community refine what business information they want to see, how they want to see it on the screen, and how key terms are defined. By using “real” production data, it also serves to give business users a preview of the types of data quality problems that exist. This is an important first step in setting business user expectations regarding data quality issues and what is reasonable to expect based on the availability of source system data. The feedback from the prototype session is used to refine and finalize the user interface design for the BI application. The logical data mart model used to build the prototype becomes the starting point for building the production-ready data mart physical design.
An example of how this has worked on one of our projects is described below.
Financial Institution Cash Management Business Intelligence Prototype
A financial institution launched a BI program aimed at reducing cash collection costs, improving cash forecasting, and reducing cash balances. It contracted for a number of lockbox operations to serve different parts of the institution, and the people responsible for cash forecasting and for cash consolidation and management were in still other parts of the organization. By use of the BI Pathway method, we were able to identify and catalog a large number of business information needs. Although everyone agreed that gathering requirements was necessary, as often happens, there was a lot of impatience with the process. The business community also had a hard time envisioning how the BI would be presented and used.
To overcome wavering business support, we built a design prototype to present the kind of information the production BI release would provide. The prototype activity also included developing usage scenarios based on the business process re-engineering models. This allowed the BI team to present the BI in context, and this created tremendous enthusiasm for the entire BI program. It also allowed the BI team to clarify key terms, check on the reasonableness of cash collection amounts presented, and obtain feedback on how the information was delivered/displayed. Once the business users were able to visualize what they would be getting from the new BI application, they were willing to wait for the IT team to build it to production standards.
The Challenge of Data Sources
A quick scan through just about any book about DW and business intelligence will have a drawing that looks something like Figure 4-9, which shows an orderly flow of data from data sources to a data warehouse and on to specific BI applications.
The implicit assumption in these drawings is that there are mature, well-documented data sources from which we can readily extract the high-quality data we need to for our BI applications. Sometimes this is a valid assumption, and sometimes it is not. Because BI applications depend heavily on transactional data about a business and its customers, it is absolutely critical to develop a complete understanding of the potential data sources for the BI initiative in general and for a specific BI increment in particular.
During the BI opportunity analysis and the subsequent processes of developing detailed requirements, we identify the kind of business information and business analyses we believe will allow us to improve profits. We typically do not constrain these thought processes by considerations of whether data exists and/or can be obtained. Instead, we ask the fundamental kinds of questions posed by management theorist Peter Drucker, including the following:
The central premise of this approach is that the business needs the information it needs, regardless of whether there is a currently available source for that information. Once that has been determined, however, analytical attention must be turned to understanding the data the business has at hand so that the degree to which we can provide the business information needed can be determined, which in turn determines which business analyses can be performed. In other words, you must determine if there are gaps between the detailed requirements for business information and the potential sources of the data. This approach to source analyses has lead to some interesting and unconventional data sources that held valuable business information, including mainframe log files, a backend scanning equipment data base, and individual worker spreadsheets. It has also lead to organizations discussing the potential need to modify operational systems so that the systems would contain the information needed to better run the business. Although changing operational systems is never a popular or first choice, the possibility should not be dismissed outright. Instead, you need to weigh the potential benefit of making operational system changes against the cost of making them. We have worked with several clients who gave serious consideration to making operational system changes because of a strong business need to have certain information in order to improve business performance. The process of making the determination regarding the availability of source data is referred to variously as source analysis, source system analysis, source data analysis, or source-gap analysis. We will refer to it as source-gap analysis.
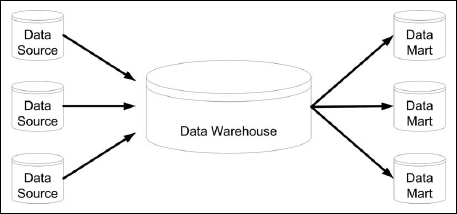
FIGURE 4-9 Data from sources through a data warehouse to business intelligence applications.
Practically speaking, there are a number of activities that make up source-gap analysis, including the following:
The amount of time and resources needed to perform this kind of source-gap analysis depends on such factors as the size of the company, the number of source systems relevant to the analysis, who owns the source systems, the degree to which information about the source systems is well documented, and whether there are automated tools to use for data profiling and data quality analysis. That being said, BI initiatives absolutely depend on source data, so the source-gap analysis cannot be avoided.
The issue, in our view, is whether management has the patience to let the BI team do the job well, thereby reducing overall BI project risk. If management lacks this patience, the risk increases that the business information required for improving profit will either be lacking altogether, lacking in quality, lacking in meaning, or some combination of these. This, in turn, increases the risk of project failure. The old IT adage of “garbage in, garbage out” is absolutely true for BI initiatives. Nothing will kill the credibility of a BI application faster than the perception that the business information being delivered is no good. To overcome this risk, it is imperative to educate business sponsors about source data risk and to set realistic expectations about the time and resources that will be required for source-gap analysis.
Pitfall
BI applications, unlike other IT applications, rely upon source data for input. Data quality problems and the lack of data needed to meet information needs often present BI program risks.
4.3.2 Technical Development Work
There are a variety of technical steps needed to complete the design and development of the databases and ETL processes that make up much of the technical “plumbing” that support the BI application. Because there are industry books dedicated to fully discussing industry best practices related to these topics, they will not be discussed in this book.
Deploying Re-engineered Business Processes
The central premise of the BI Pathway method is that investments in BI cannot increase profits unless the BI is leveraged by business processes that affect profits. Whether these are new business processes or re-engineered business processes does not matter. What does matter is putting business information, business analyses, and business decisions into action. Toward that end, we set the stage during the architectures phase by creating detailed requirements. Once the BI is actually available, we have to ensure that it is leveraged as intended. This connection is shown in Figure 4-10.
We described the role and characteristics of detailed requirements earlier, and we noted that the requirements describe a business value capture mechanism. Where the rubber meets the road is when BI is put into action. Once the technical challenges of the implementation phase have been overcome, close the loop by ensuring the BI is used within the target business process to increase profit.
One substantial challenge to capturing the return on a BI investment lies in gaining user acceptance of the BI application. Assuming that you have solved any data quality issues, gaining user acceptance becomes a matter of how the business information and business analyses are delivered in support of business decisions and actions. All BI applications contain underlying data, and substantial effort is required to ensure that you have the right data and it is of high quality. That being said, many users sensibly care only about how the data is delivered, how easy it is to use, how it is displayed, and other usability issues. This points to the need to distinguish between

FIGURE 4-10 Connection between the architectures phase and leveraging business intelligence.
This activity is shown in the Figure 4-10 as “design, develop and deliver BI applications, reports, and training.” The processes within this activity include user segmentation, development of usage scenarios for the various user segments, determination of which delivery and/or access methods are most appropriate for the user segments, development of the delivery and/or access methods, and training the various users in how to use the BI within the target business processes.
The other key challenge to capturing the return on a BI investment lies in making changes to the targeted business processes, which takes us into the province of business process re-engineering and change management. During the architectures phase, current-state and target-state business process models were developed, with the target state incorporating the use of the new BI application. During the implementation phase, the BI application was put into service within the target-state business process. This requires the business process owner(s), typically the business sponsor’s organization, to accept responsibility for changing the business process and to make the changes happen as effectively as possible. If a BI readiness assessment was performed during the architectures phase, then the sponsoring organization will have identified strengths and weaknesses resulting from
Pitfall
Organizations often do not recognize that they need to change business processes in order to reap the potential BI value from their BI investments. Organizations that have been publicly recognized for BI “best practices” recognize and explicitly address business process change within their BI efforts.
Based on the assessment, the business unit can develop a change management approach and then execute the approach when the BI application is ready. Empirical evidence suggests that IT has the biggest impact on business performance when it is a business-driven line activity (Dvorak et al., 1997). The implementation phase is the point in the BI development life cycle when the business must drive process change if the BI investment is to pay off.
4.4 The Operations and Continuous Improvement Phase of the BI Pathway Method
There are two distinct components in the operations and continuous improvement phase. The first consists of improvements in the BI application and how it is used within the targeted business process. Metrics are developed during the operations and continuous improvement phase to objectively measure the ROI that was associated with the use of a new BI application. Most frequently the “current state” performance metrics serve as a baseline of performance. The “future state” process/information is then put into use to measure performance improvement based on the change process. This objective measurement helps to further refine additional improvements that can be implemented to further improve performance.
The second consists of improvements in the IT production processes used to acquire, move, and store the underlying data that supports the BI application. The improvements in the application and how it is used affect the level of incremental profits, and the improvements in IT operations affect the total cost of ownership. By working on both, we can improve the overall ROI of our BI initiatives.
As with any production environment, we can aspire to year-over-year cost improvements by achieving operating efficiencies and by leveraging the physical IT assets in the BI technical environment to support more BI applications. In the BI world, operating efficiencies stem from
By improving the operating efficiency of the BI technical environment, we are optimizing capacity, which gives us the ability to pump more work through the same technical resources. This translates to the ability to run as many BI applications as possible within the environment, which avoids the costs of unused capacity and/or the cost of adding capacity, which tends not to be linearly scalable.
The operations and continuous improvement phase also deals with improvements to the BI application and its usage within the target business process. Typical examples of improvements to the BI application include incorporating additional business information, refining the business analyses made possible by the BI application, refining the decision processes that leverage the business information and business analyses, expanding the number of users of the application, and refining the ways that the target user segments employ the application. Many BI projects have demanding timetables established by business executives who do not have the background to judge how long the project should take. In the BI world, this may mean that all the ways that the business information could be leveraged are not implemented at once, and/or all the potential users do not get trained at once, and/or that the delivery of business information may not be as sophisticated as it eventually can be. Over time, however, we can address these opportunities through continuous improvement efforts.
4.5 Chapter Summary
The BI Pathway method is essentially a business and technical strategy for improving profits by leveraging information and analytical tools. As such, it is aimed at establishing alignment across a wide swath of relevant organizational elements, including business strategy, IT strategy, business operations, and IT operations. As noted at the outset, this alignment is complex, multi-faceted, and never completely achieved. That being said, the BI Pathway method presents a logical way to achieve sufficient alignment to ensure a fighting chance that an investment in BI will pay off. As with any profit improvement strategy, there is the thinking and the doing, and we must do both to realize the full potential of BI to improve profits.