
Chapter 7 Important Ways Business Intelligence Can Drive Profit Improvement
“The real competitive problem is laggards versus challengers, incumbents versus innovators, the inertial and imitative versus the imaginative…. At worst, laggards follow the path of greatest familiarity. Challengers, on the other hand, follow the path of greatest opportunity, wherever it leads.”
—Gary Hamel and C.K. Prahalad, Competing for the Future
Before writing this book, we received feedback on the outline from respected peers in the business intelligence (BI) field. One reviewer offered an important challenge to us: Would it be possible for this book, or any book, to “generalize how to do BI when treatments for various industries may be so different”?
Another reviewer felt it would be useful if we could “treat some or a variety of specific industries in the book.” We agree that these are important topics, and our short response is that we absolutely can generalize a systematic approach to analyzing and designing customized BI for a given company that operates in a given industry or in multiple industries. Furthermore, experience suggests that the application of BI by a given company is a potential source of competitive advantage and should be specific to the company, its industry or industries, and the manner in which it competes in the industry or industries. This ability to apply a standardized design approach to develop customized BI applications is exactly what we mean by “business-centric BI development methods,” which our clients in a variety of industries have successfully applied. We will elaborate on this important subject in the first section of this chapter.
More broadly, and building on the quote above, we feel that companies need to decide whether they want to be innovative and imaginative in their use of BI or whether they can safely be content as followers, fast or otherwise. The innovator path requires greater investment, focus, and risk-taking, with the potential for greater profits. The follower path does not have the same upside profit potential, but it may be less risky. Furthermore, in more and more industries it will become necessary to deploy BI capabilities to neutralize the competitive advantages achieved by the innovators.
Evidence suggests that BI innovators are in most industries these days, and that they are well down the road in how they use BI to improve profits. Both in our role as judges for annual BI and DW best practices competitions sponsored by The Data Warehousing Institute and in our consulting practice, we see innovators in a range of service and manufacturing industries. For followers, then, the task is either to identify new ways to innovate with BI or to identify and implement BI capabilities that are strategically relevant for their organizations.
The good news is that a lot more is known about the business and technical aspects of BI than was known a decade ago. Thus, it is possible to proceed more cost-effectively and with less risk if companies are willing to learn from others’ experience. Also, many published cases describe ways that BI has been successfully applied, and the later sections of this chapter will describe some of these BI applications. Our hope is that these examples will help you get a feel for where your company may stand in relation to competitors or other innovators.
7.1 The Impact of Industry, Competitors, and Company Business Design on Business Intelligence Opportunities
The North American Industry Classification System (NAICS) is an industry classification system that groups businesses into industries based on the economic activities in which they are primarily engaged (National Technical Information Service. NAICS, 1998). It is a comprehensive system covering the entire field of economic activities, producing and nonproducing. There are 20 sectors, 96 subsectors, and 1,170 industries in NAICS United States, and companies are grouped within these according to the similarity of the processes used to produce goods or services. For example, food manufacturing is a batch-oriented process manufacturing operation in which various ingredients are blended and converted into finished products. Food manufacturing is very different from other industries such as making fabricated metal products, which is a batch-oriented, discrete manufacturing operation with different parts requiring different operations performed by computer-controlled machine tools.
Because of the differences in production processes across industries and sectors, companies that operate in different industries tend to develop different vocabularies around the core operational processes of the business. For example, although food manufacturers talk of recipes and conversion processes, metal products manufacturers talk of bills of material and machining operations. Different production processes also cause industries to develop different performance measures, such as revenue or cost per ton-mile in the shipping industry or revenue per available room (revpar) in the hotel industry.
In addition to industry differences arising from fundamentally different production processes, industries also vary (Porter, 1980) with respect to the following:
These differences between industries impact what BI information is relevant within a given industry and for a given competitor at a given time, thus raising the question posed earlier: Can we usefully generalize about “how to do BI when treatments for various industries may be so different”? These differences suggest a broader strategic line of inquiry that considers the impact of industry, competition within the industry, and a given company’s business design on the BI opportunities for a given company within a given industry. In our view, looking at industry alone is too static because there are different ways of competing within the same industry. Those methods of competition can change over time as industries themselves evolve and mature and as their customers’ needs evolve.
For example, Michael Porter (1980) advances the view that there are three generic competitive strategies: cost leadership, differentiation, and niche focus. Although written some time ago, his observation still holds true. He points out that “each of the generic strategies involves a fundamentally different route to competitive advantage” and that the “specific actions required to implement each generic strategy vary widely from industry to industry, as do the feasible generic strategies in a particular industry” (Porter, 1985). Porter further asserts that competitive advantage “stems from the many discrete activities a firm performs in designing, producing, marketing, delivering, and supporting its product” (Porter, 1985). By using the value chain construct, Porter then leads us to understand that there are many different combinations and permutations of ways that firms and entire value chains (now called supply chains) compete, pointing out that value chain activities such as logistics, operations, marketing, and procurement, among others, are “the building blocks by which a firm creates a product valuable to its buyers” and that “any activity in the value chain can potentially contribute to differentiation” (Porter, 1985).
Porter’s seminal thinking about strategy and industrial economics has spawned elaborations, variations, and applications of his ideas that further suggest the need to customize BI for a given company competing in a given way within a given industry. Recognizing that industries are dynamic and their futures can be shaped, Gary Hamel and C.K. Prahalad (1994) argue that “companies not only compete within the boundaries of existing industries, they compete to shape the structure create differentiation and competitive advantage, as the company Owens & Minor has done in the medical products distribution industry. It uses a BI system called WISDOM (Web Intelligence Supporting Decisions from Owens & Minor) both to provide decision support information to its managers and employees and to help manage its supply chain.
Tip
What stays the same are the general principles of successful BI and management for results. What changes are the industry drivers of each organization, its BI readiness, its strategic needs, and thus the way in which you need to implement BI in that organization.
As industries evolve, competitive positioning and the means of competing also evolve. Richard D’Aveni (1994) points out that “the most important aspect of competition is not current position, but the changes created by the dynamic interaction between rival firms” and that “cycles of change are growing progressively shorter. Although it may be difficult to generalize about how short change cycles are, because cycle duration varies by industry, there is little doubt that what customers value changes over time, and thus the ways companies compete must also change. Adrian Slywotsky (1996) talks in terms of “value migration” and the evolution of “business designs,” where value migration occurs because customers’ most important needs change. To meet those changing needs, companies’ business designs must change. Customers give their business to the companies whose business designs best meets their needs, thus creating value migration from obsolete business designs to more effective business designs.
The concept of a business design is of particular importance for BI purposes. Slywotsky defines the business design as “the totality of how a company selects its customers, defines and differentiates its offerings, defines the tasks it will perform itself and which it will outsource, configures its resources, goes to market, creates utility for customers, and captures profit.” To illustrate, let us consider Wal-Mart, whose business design is summarized in Table 7-1.
For many of the elements of business design, Wal-Mart could have made different choices. For example, it could have chosen to compete on service, as does Nordstrom, or it could have concentrated on consumer electronics, as does Best Buy. For any given company, the choice of business design dictates the performance objectives of core business processes and the elements of business performance that are important to plan, measure, control, and improve. To continue with the Wal-Mart example, its business design dictates that it be concerned with core business processes such as demand planning, forecasting, purchasing, supply chain management, category management, and cost management. That focus drives BI opportunities such as those shown in Figure 7-1.
In other words, the choice of business design suggests areas of analysis for determining the specific BI opportunities that are strategically and operationally relevant for a given company. Given that business designs vary by company and industry, we certainly cannot say a priori how a company in a specific industry should use BI. That being said, we can generalize that for any given company in any given industry, we should systematically evaluate its industry, strategy, and business design as a means of identifying potential BI opportunities. This is the essence of business-centric BI development methods such as the BI Pathway.
Table 7-1
Sample subjects and techniques for business analysis
| Design Element | Value |
| Business focus | Retailing of a broad range of consumer products |
| Target customers | Cost-Conscious Shoppers |
| Competitive strategy | Cost leadership |
| Key points of differentiation | “Everyday low prices;” breadth of merchandise |
| Value disciplines | Supply chain logistics, information technology, merchandising, category management |
| Business scope | Some backward integration into logistics; no manufacturing |
| Value capture | Cost leadership allows gross margin maintenance despite low prices; low prices allow market share capture and incremental margin; expansion via new Stores allows capture of incremental margin |
| Purchasing | Use market share clout to drive down manufacturers prices and push supply chain costs back upstream |
| Operating systems | Leverage information technology and strong socialization of work force to hold down costs, excel at category management, and excel at supply chain and logistics |
| Capital intensity | Build and own big-box stores on land purchased in suburban and urban areas; invest in internal information technology (IT) and IT capabilities (versus outsourcing); invest in logistics capabilities |
The industry drivers faced by your organization partly determine its business design. In turn, your organization’s business design, mission, and strategic goals determine its BI needs. If you can draw a clear logical connection backwards from your BI design to your business design and from there to your industry drivers, you’ve probably done a good analysis of your BI needs.
More broadly, we have tried to establish that industries are dynamic, that the ways that companies compete within industries and industry segments are variable and dynamic, and that business designs are variable and dynamic. All those facts point to the conclusion that the way a given company uses BI ought to be customized to its specific circumstances. That said, industrial economics is industrial economics, and all industries have customers and all companies use inputs and processes to deliver products or services to meet the needs of those customers. Further, the functions within businesses are common, for example, research and development (R&D) or service line development, operations, marketing, sales, finance, human resources, and administration. So although the permutations and combinations of value chain activities are many and although the bases of competition are different within different industries at different stages of industry maturity, it is fair to say that the building blocks with which a given business design is built are common piece parts. Accordingly, what we look at in determining the appropriate BI investments for a given company is the same, even though the optimal BI portfolio for a given company in a given industry will certainly vary. We described an approach for this BI opportunity analysis in Chapter 2, and we elaborated on the subject in Chapter 4.

FIGURE 7-1 The connection of business design, business processes, and business intelligence opportunities.
We talked earlier about companies needing to decide whether they want to be innovative and imaginative in their use of BI or whether they can safely be content as followers, fast or otherwise. For either path, it helps to understand the state of the art, either as a means of stimulating thinking about how to innovate or as a means of understanding the path to follow. Toward that end, the remainder of this chapter will describe important ways that BI can be used to drive profit improvement, starting with a general overview.
7.2 A General Overview of Business Intelligence Opportunities
If we think of BI as business information and business analysis in support of fact-based decisions in the context of business processes that impact profits, it quickly becomes clear that BI is a broad concept. The nature of business information varies along a number of dimensions, including
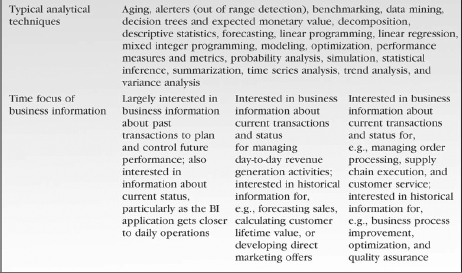
In addition to the wide range of types of business analyses, a broad range of business analysis techniques may be used alone or in combination with each other to support business analysis. The appropriateness of these techniques vary, based on the subject of analysis, for example, data mining techniques applied to risk analysis in contrast to trend analysis applied to sales performance analysis. Table 7-2 shows a sample list of analytical subjects and techniques.
As the above lists suggest, there are many different possible combinations of types of business information and business analyses. Selecting the relevant business information and analyses is a function of the kinds of business decisions that must be supported by BI, which in turn is a function of the type of business process within which the BI will be deployed. Business decisions are generally classified as strategic, tactical, and operational, although in practice the distinctions can be blurred. These classifications tend to imply differences in
Table 7-2
Sample subjects and techniques for business analysis
| Analytical Subjects | Analytical Techniques | |
| Customer analysis | Aging | Modeling |
| Productivity analysis | Alerters | Optimization |
| Quality analysis | Benchmarking | Performance measures and metrics |
| Risk analysis (fraud detection, loss analysis, litigation) | Data mining | Probability analysis |
| Inventory analysis | Decision trees and expected monetary value | Simulation |
| Financial analysis (revenue, profit, cost, accounts receivable) | Decomposition | Statistical inference |
| Channel analysis | Descriptive statistics | Summarization |
| Supply chain analysis | Forecasting | Time series analysis |
| Sales analysis | Linear programming Linear regression Mixed integer programming |
Trend analysis Variance analysis |
Business decisions also take place in the context of business processes, such as management processes, revenue-generating processes, and operating processes. Depending on the process and whether the decisions to be made are strategic, tactical, or operational, different combinations of business information and business analyses will be appropriate. The general relationship between business decisions and business processes is shown in Figure 7-2.
At the core of Figure 7-2 is a highly simplified representation of value chain business processes, that is, supply chain processes, operating processes, customer relationship processes, management processes, intra-company processes, and support processes. In the context of these value chain processes, companies make a variety of decisions, shown in the arrows surrounding the core business processes. To illustrate, manufacturing companies make long-term strategic decisions about supply chain and operational processes, such as the number and location of plants and distribution centers and investments in information technology (IT) to enable planning and operational collaboration with suppliers. For a service company such as a bank, the long-term strategic decisions about supply chain and operational processes might address the question of whether to outsource check-clearing processes. In general, value chains differ by industry and product, and companies occupy different positions in those value chains. That said, the value chain construct is very useful for stimulating thinking about BI opportunities.
Faced with the many combinations and permutations of business information, business analyses, and fact-based decisions that BI can deliver or support, we need a general framework that delineates the major types of BI opportunities that can be considered for inclusion in a given company’s BI portfolio. With such a framework, we can further stimulate our thinking about potential BI opportunities as we conduct the BI opportunity analysis using the techniques described in Chapter 2. Table 7-3 presents some of the major types of BI opportunities on which companies in a variety of industries are capitalizing.

FIGURE 7-2 The relation between business decisions and business processes.
What we see in Table 7-3 is that BI opportunities can be segmented into three major business process categories: management processes, revenue generation processes, and operating processes. Within these major business process categories, proven BI opportunities are aligned with key business subprocesses, such as forecasting, customer segmentation, and order processing. Although the exact way that a given company competing with a certain business design in a specific industry might design its BI applications will vary, the typical BI opportunities shown in Table 7-3 cut across industries. Furthermore, although the business vocabulary of industries might vary, the need for management processes, revenue-generating processes, and operating processes is a constant. Accordingly, we believe that the typical BI opportunities shown in Table 7-3 are a useful place to start when determining the specific BI opportunities your company should pursue.
7.3 Business Intelligence for Management Processes
Building on the information presented in Table 7-3, we see that BI is commonly used to improve basic management processes—be they strategic, tactical, or operational in orientation. The business information and business analyses used for fact-based decision making range from information about the current status of the enterprise or its subunits, to historical information about past business performance that can be used to predict future demand and guide process and quality improvement efforts. Overall, the goal of the entire set of management processes is to ensure the long-term success of the company, and BI has a proven track record of helping companies make better decisions toward that end. To illustrate this point, we will provide highlevel descriptions and/or brief examples of some common ways that BI is used to improve management processes. We will describe two such uses in depth: balanced scorecards and management accounting.
Table 7-3
Major types of business intelligence (BI) opportunities and their relation to categories of business processes

7.3.1 Common Ways Business Intelligence Is Used to Improve Management Processes
Management processes are the core of any business. To the extent that BI improves those processes, it improves the efficiency of the business and the accuracy of the management decisions that drive it. BI typically can improve management processes in several areas, among others:
Generally, these requirements drive a need for both current information and historical information, in which current information is used to understand the current-state performance and historical information is used to assess trends and provide inputs for establishing performance targets based on past performance. Further, in large companies there is generally a need to evaluate multiple dimensions of performance at multiple levels in the enterprise, as well as for the enterprise as a whole. From a BI perspective, many organizations have difficulty bringing together (integrating) all the business information they need for performance management, process improvement, quality management, and/or performance optimization. For that reason, they also have difficulty deploying appropriate analytical techniques because such techniques require appropriate business information. For example, statistical process control requires information on historical process performance in order to establish the upper and lower bounds of acceptable performance variation. As another example, companies often desire a comprehensive, multidimensional assessment of the performance of their organizational units, whereas the business information about all the relevant dimensions of performance is often found in multiple transactional IT systems. BI is designed to bring relevant business information together with appropriate analytical techniques to enable fact-based decisions that improve business performance, and ultimately profits.
Tip
Note that in each of the bullet list’s examples, organizations adapted their BI implementations to their specific industry drivers and business design. Although there are good general-purpose BI tools, methods, and technologies, no rigid “one size fits all” approach is likely to succeed. If a particular tool, method, or technology is too difficult to adapt to your organization’s situation, you should probably try something else.
7.3.2 Business Intelligence and Balanced Scorecards: Enabling Strategic Management
Over the past decade, business performance management (BPM) frameworks such as the Balanced Scorecard (see http://www.bscol.com) have been adopted by a growing number of major organizations. A 1999 Bain & Company survey of adoption of management tools revealed that almost 44% of firms in the survey used the Balanced Scorecard, and that the mean satisfaction rating among users was 3.85, with 5 being the highest rating (Rigby, 2001). Although a number of other management tools had higher adoption rates and higher satisfaction rates, the data suggest that BPM frameworks such as the Balanced Scorecard may become a staple within large organizations.
The business requirement for BPM frameworks stems from the fundamental limitation of “managing by the numbers.” Executives have long known that managing by the numbers, instead of managing the business processes that drive the numbers, ignores the root causes of business performance and often leads to gaming. To overcome this, performance management frameworks have been expanded to incorporate nonfinancial performance measurements. Examples include capacity utilization percentages, customer satisfaction ratings, cycle times, units of output, and cases handled, to name but a few of the thousands of different nonfinancial performance measures.
The need for BPM frameworks manifests itself at all levels and across all functions of an organization. Many executives now recognize the need to manage business performance strategically, to understand the key linkages between strategy and the business processes undertaken to execute strategy, and to measure the performance of those business processes. This need for strategic performance management tools has been the impetus for the Balanced Scorecard and other BPM tools. At the same time, functional managers and middle managers need performance management tools appropriate to the business processes they manage, which hopefully are aligned with the business strategy. This need has given rise to different strategies for using Balanced Scorecards. These range from the traditional top-down approach with supporting scorecards “cascaded” down from corporate, to bottom-up approaches in which business units devise scorecards that are meaningful for their purposes and there is no aggregated view of the whole company owing to local differences in measures.
Recognizing these broad needs for scorecard frameworks and tools, BI software vendors have developed packaged performance management offerings that are certified by the Balanced Scorecard Collaborative to meet Balanced Scorecard functional standards. Those standards are defined in the Balanced Scorecard Functional Release Standards Release 1.0a published in May 2000 by The Balanced Scorecard Collaborative. As of June 2004, there were 19 vendors with certified products, including all of the leading BI and ERP vendors. Balanced Scorecards are essentially analytical applications that map/model, accumulate, display, and report multidimensional performance information, including financial and nonfinancial performance targets, actual performance measures, variance and trend analyses, and associated meta-data. Given these functions, traditional BI tools are ideally suited to the task of automating the data collection, aggregation, and presentation tasks associated with using the Balanced Scorecard as a performance management framework.
To develop a Balanced Scorecard, one typically does a top-down mapping between business drivers, business strategies, and value-driving business processes. One then selects financial and nonfinancial performance measures for those value-driving processes, with the measures drawn from four perspectives: financial performance, performance for the customer, internal operating performance, and learning. So, for example, if a business competes on price, its Balanced Scorecard might include the following performance measures:
These financial and nonfinancial measures may be specific to the Balanced Scorecard initiative. More likely, some or all of these measures may be used within other BI applications, such as customer analytics, where measures such order-to-delivery cycle time are standard fare. In order to avoid stovepiping and to achieve the so-called “single view of the truth,” we must ensure that the data used by the Balanced Scorecard is consistent with the data used by other BI applications that use the same measures. This means that the Balanced Scorecard and other BPM approaches should be managed as part of the overall BI Portfolio.
One of the key assumptions in almost all of the books, articles, and other literature about the Balanced Scorecard is that the performance measurement data required for using the performance management framework is readily available. Based on our experience with major private sector and public sector organizations, and based on BI and data warehousing experience generally, we believe this is really a huge leap of faith. In fact, in a 2001 survey by International Data Corp. (IDC) and the Balanced Scorecard Collaborative, survey respondents from a broad range of industries stated that complex data sourcing remains the single biggest challenge to automating Balanced Scorecards, followed by the unavailability of needed source data (Morris, 2002). Fortunately, a well-architected business-centric BI environment can overcome the complex data sourcing issues. Within this approach, a Balanced Scorecard initiative is just one application in the portfolio, albeit a strategically important one.
Tip
The strength of using a Balanced Scorecard approach with BI tools is that it lets you connect strategic business drivers, goals, and performance with your specific informational needs. One challenge of using a Balanced Scorecard approach is that required performance measurement data is often not readily available; although if you plan and implement your BI program creatively, you can usually get the data you need.
7.3.3 Business Intelligence and Management Accounting: Improving Operational and Financial Performance
As Johnson and Kaplan (1987) elegantly describe in Relevance Lost, managerial accounting evolved in the early days of the industrial revolution as a tool for measuring and managing resource consumption, outputs, and productivity at the operational level of the firm. Early management accounting systems were devised by industrial engineers, and the business information these systems provided was essential for managing operational and financial performance.
The principal type of information provided by early management accounting systems was standard cost information, which was used for planning and controlling the productivity and efficiency of internal processes. Other key attributes of early managerial accounting systems were that (1) they were devised to provide the kind of information required to manage operations in the specific industry in which the firm operated; and (2) they combined financial and nonfinancial information.
An example used by Johnson and Kaplan to illustrate this was drawn from the railroad freight shipping industry, where a basic productivity measure was cost per ton-mile. Cost per ton-mile could be compared with revenue per ton-mile to calculate contribution margin, from which period costs and other indirect costs could be subtracted to determine how the business was doing overall. Furthermore, this information could be used by operations managers to plan, control, and improve efficiency. The combination of financial information and nonfinancial information that was specific to the industry, and type of operation was directly relevant to the operations management task of optimizing cost, time, asset utilization, and service.
Today, most observers agree that management accounting information derived largely from modern financial accounting systems is obsolete. A review of the management accounting literature finds this theme time and again: see, for example, Cokins (2001), Kaplan (1988), and Cooper and Kaplan (1991). Our discussions with operating managers in a variety of industries reinforce this finding. For example, during the course of our work with a $7 billion service organization to modernize and increase the relevance of its management accounting system, we conducted dozens of interviews at all levels of the organization, and we identified the need for the following:
As with many organizations, the current system of allocating expenses found in the general ledger (G/L) system down to service lines, channels, customers, and so forth generates cost accounting information in which the organization’s managers have no confidence. And yet the managers use that information because they have nothing better.
In addition to lacking cost information, the organization also lacks the information to systematically, consistently, and routinely perform fundamental operations management tradeoffs between asset levels, costs, process times, quality, service, outputs, and backlogs. In other words, the organization, similar to many organizations, does not have an integrated set of facts about organizational performance from which it can model, project, and analyze resource consumption under various customer-driven operating scenarios.
The commonly found deficiencies in cost information and the lack of integrated information about the other key operating variables of interest point to the need for expanded functionality for managerial accounting systems and for an expanded role for BI. To illustrate the differences between where we are and where BI can take us, we first examine traditional managerial accounting systems and the management tasks they support, as shown in Figure 7-3.
Figure 7-3 shows a representative managerial accounting framework, which we would note is concerned only with costs and not with the broader set of financial and nonfinancial information found in early managerial accounting systems and much needed today. The graphic shows the commonly used distinction between cost measurement and cost information uses. For cost measurement, the typical approach is to draw information from the G/L system and allocate it into a cost accounting model, which might be a standard cost model, a project cost model, or a process cost model, depending on the nature of the business. The costs thus allocated are then reported out on a period-by-period basis during the accounting year, with the reported information being aggregated or disaggregated according to a selected taxonomy of cost objects, such as organizational units, product lines, customers, geographic regions, sales territories, or other objects of management responsibility and attention. The reported costs can then serve as raw materials for various cost information uses, such as planning, budgeting, and performance measurement, as shown in the right-hand box near the top of the graphic. Figure 7-3 also shows some of the commonly encountered issues associated with traditional cost accounting systems, as reported in the literature and as we have encountered in practice. To move beyond these limitations, we need to provide a modern conceptual framework for managerial accounting information, such as the one shown in Figure 7-4.
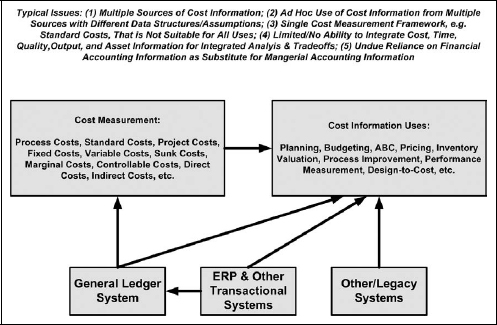
FIGURE 7-3 A representative managerial accounting framework.
The modern managerial accounting information framework (MAIF) encompasses a broader set of information than a traditional cost accounting framework, including information about costs but also information about assets, quality/service, time (e.g., cycle time or process time), and outputs. Further, the MAIF is built on a single integrated source of managerial accounting information, which for sake of discussion we have simplified and shown functionally as a BI environment. Properly designed and built from proven BI products, the MAIF can serve as a relatively inexpensive but robust source of managerial accounting information that can be used to

The BI products from which the MAIF can be constructed are proven and widely adopted. So are the management and technical methods for doing so.
With a customized MAIF in place, an organization is then positioned to truly leverage managerial accounting information to improve revenues, reduce costs, or both. This can be accomplished by deploying BI applications and incorporating their use into the key management and business processes that drive revenues and/or costs. An example of the range of such applications is shown in Figure 7-5.
Here are some examples of how a MAIF based on BI technologies and methods can be used:
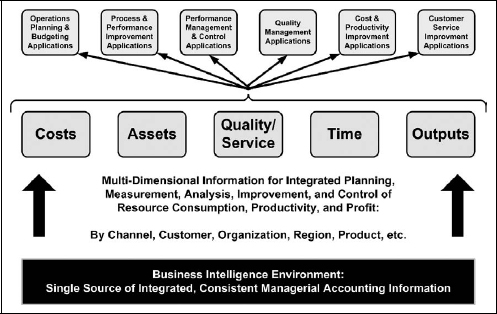
FIGURE 7-5 How the modern managerial accounting information framework (MAIF) can support resource management applications.
Tip
Modern managerial cost accounting is another area where BI can make a surprising contribution to an organization’s effectiveness. One way to gain top management support is to show how BI can provide a far higher quantity and quality of managerial accounting information than can be obtained from current methods.
There are many other examples of how leading companies in a variety of industries are using enhanced managerial accounting information—delivered by BI tools—to drive improved profitability.
7.3.4 Summary: Business Intelligence for Management Processes
In this section, we have illustrated some of the typical ways that BI is used to improve key management processes. In addition to needing business information about the current status of the enterprise and/or its components, which typically comes from transactional IT systems, managers today need to understand the past so they can better influence performance in the future. This is particularly true of larger enterprises in which customers number in the millions, employees number in the tens or hundreds of thousands, multiple business units compete in different industries, and operations are multifaceted and multinational. Without BI, it is extremely difficult for managers to cope with the complexity of modern business. With BI, innovators in a variety of industries are shaping the future, establishing competitive advantage, and delivering strong profit growth.
7.4 Business Intelligence for Revenue-Generating Processes
Some of the earliest uses of BI were driven by the desire to improve revenue-generating processes. Simply put, companies wanted to understand their customers better, retain their best customers, and sell them more products or services. Achieving those goals can be relatively straightforward in some business-to-business contexts, for example, if a company has a couple dozen key customers that drive a large percentage of revenue. However, companies that have millions of customers and that annually process tens or hundreds of millions of business transactions with these customers often can’t see the forest for the trees. Many such companies can’t identify their most profitable customers, they don’t know when profitable customers are about to defect, and they can only guess at what direct marketing offers will be most attractive to which customers.
To address these gaps in understanding customers, companies in such retail-oriented industries as consumer product retailing, telecommunications, and financial services were early adapters in using BI to sift through the data about the millions of customer transactions to better understand what drives revenue. By building on the information presented in Figure 7-3, we see that BI is commonly used to improve revenue-generating processes such as market analysis, customer segmentation, campaign management, advertising, channel management, customer relationship management (CRM), sales force management, and pipeline management. To illustrate this point, we will provide high-level descriptions and/or brief examples of some common ways BI is used to improve revenue-generating processes. Some of those ways are
For companies with millions of customers, perhaps thousands of points of sale, and perhaps multiple channels, such analyses clearly depend on access to relevant business information and appropriate analytical tools, that is, on access to BI. With a well-architected BI environment, marketing analysis can be done in near real-time to see current and long-term revenue trends and to understand the underlying drivers of revenue growth. With appropriate tools, data about hundreds of millions of individual transactions can be mined to answer the fundamental marketing questions posed above. Armed with better information, companies can be more effective in attracting new customers, retaining profitable customers, and achieving a sustainable revenue portfolio. Furthermore, they can understand the relationship between channels and profitability and introduce incentives for customers to use the more profitable channels. In general, experience in a range of industries has shown that one of the most profitable uses of BI is in better understanding the relationship among customers, products or services, and revenue generation.
Beginning in the late 1970s, psychographic segmentation sought to group customers by such potentially common characteristics as personality, leisure activities, and values. It became common to associate zip codes with psychographic profiles, with groups often labeled with catchy phrases as “pools and patios” or “shotguns and pickups.” With all of these a priori bases of segmentation, the connection between association with the group and actual purchasing behavior was not clear. To overcome this gap, marketers began to investigate differences in customer behavior as the basis for segmentation, initially with focus groups and market pilots and, in the past decade, by using BI tools and techniques. Specifically, by mining data about millions of individual customer transactions and marrying such information with traditional demographic, geographic, and psychographic information, companies have been able to group customers by purchasing behavior and to understand the relationships, if any, between purchasing behavior and, for example, demographic variables and product characteristics. These BI tools do not replace traditional segmentation and market research tools: they simply provide powerful new tools that work well with existing tools to help companies define narrower customer segments, understand the needs and values of those segments, create products and services that better respond to those needs and values, and develop more selective and effective ways to reach and acquire new customers and/or expand business with current profitable customers.
Except for enterprises that are completely vertically integrated, a rarity in most industries these days, companies face strategic decisions about what channels to use and which partners to use within a given channel. They also face the task of evaluating channel and/or channel partner effectiveness over time. All of these channel management tasks can be made more effective through adoption of BI. For example, we talked earlier about using BI for marketing analysis, from which we gain insight into how much revenue comes from which channels; through which channels volume is increasing, decreasing, or holding steady; and how different products fare in different channels. If we can integrate that information with appropriate channel cost information, we can determine which channels are most cost-effective for us as a means to margin optimization. By use of BI, we can also assess channel partner performance. For example, suppose a company uses different distributors in different parts of the country. With appropriate BI tools and techniques, we can assess their relative performance in terms of revenue growth and customer service. All of these BI opportunities, and others not detailed here, can enable more effective channel selection and management, which supports more effective revenue generation and growth.
Tip
A key strength of using a business-centric BI approach is that it explicitly connects the information BI delivers with the revenue-generating processes that pay back your BI investment. Because of that explicit connection, you get a clear picture of what kind of ROI your BI efforts generate.
7.4.1 Summary: Business Intelligence for Revenue-Generating Processes
In this section, we have illustrated some of the typical ways that BI is used to improve key revenue generation processes. Fundamentally, these BI opportunities are about using detailed and specific business information about customers’ past purchasing behavior to better understand their needs and preferences and, thereby, to become more effective at growing revenue and retaining profitable customers. Having such information is especially valuable for companies with millions of customers. It enables application of marketing concepts such as customer lifetime value analysis, needs-based segmentation, and collaborative filtering. Using BI to improve revenue generation processes is also important in business-to-business contexts because it allows companies to evaluate product sales trends in the aggregate, customer purchasing patterns in particular, product mix with specific customers, product sales by relevant dimensions such as geography and customer demographics, and customer profitability. In some distribution industries, having BI about product sales to end customers has enabled the distributors to offer BI to upstream and downstream supply chain partners as a value-added service that has resulted in competitive advantage and increased revenues. All in all, using BI to improve revenue-generating processes is one of the most effective ways BI can be employed to drive profits.
7.5 Business Intelligence for Operating Processes
If we look at today’s operations management challenges, we see that the fundamental economic relationships among costs, time, service, quality, asset levels, outputs, and backlogs are still at the heart of what operations and supply chain managers must be concerned with if they are to optimize profits. The need for relevant business information about operating performance is even greater when one considers the trend toward extended enterprises and competition based on the performance of constellations of organizations up and down the entire value chain. We observed this need when we were engaged by a $2 billion food ingredients manufacturer for a supply chain collaboration and optimization project with an international fast food chain. In that engagement, the goal was to quantify and model the relationships among demand, inventory levels, service levels, costs, cycle time, warehouse locations, and operating policies so that the supply chain links from the manufacturer to the retail level could be optimized and periodically rebalanced as conditions changed. We found that we could get some of the information needed through ad hoc studies. In other cases, however, the information simply wasn’t available, either from the manufacturer’s systems or from the third-party systems distributors who were the link to the retail level of the supply chain. Yet this is exactly the type of information today’s managers need to optimize operations and operating profits among the companies in the extended enterprise.
7.5.1 Common Ways Business Intelligence Is Used to Improve Operating Processes
In our earlier discussion in Section 7.3.3, we illustrated how BI tools and techniques can deliver business information and analytical capabilities to help companies optimize operating performance in support of their business designs. By bringing together multidimensional information about all aspects of operations, BI provides the tools needed to improve asset utilization, reduce cycle times, improve quality, improve service, and reduce costs, all of which contribute to improved profits. To illustrate this point, we will provide high-level descriptions and/or brief examples of some common ways BI is used to improve operating processes.
To frame the discussion, we are concerned here with the highlighted operating processes (darker boxes) shown in the simple value chain representation shown as Figure 7-6. The fundamental operations management challenge is to optimize the highlighted processes to support the business design and thereby optimize operating margins, a key determinant of profit. Here are some common ways you can use BI to improve operating processes:

FIGURE 7-6 Operating processes in the value chain.
For example, many companies pay a lot of attention to the so-called order-to-cash cycle time: the total elapsed time between when a customer’s order was received and when payment was received for the order. That entire elapsed time is a function of the elapsed time for all the steps in the end-to-end process. By using the kind of detailed transaction data that is often available from ERP and other operational systems, we can determine where most of the time is taken. By using analytical techniques from the operations research field, we can then identify improvement strategies and make operating changes. Furthermore, we can use the BI environment to gauge the effectiveness of the changes by examining post-change transactional information to see if cycle time has been reduced.
For example, a very popular BI application in the credit card business is fraud detection, whereby a customer’s previous card transactions are examined by using data mining techniques to detect his or her purchasing patterns. This information is used to create a profile so that future transactions that appear to be out of the norm for an individual can be flagged and disapproved, thus reducing fraudulent transactions under circumstances as credit card theft. As another example, a major automobile manufacturer tracks warranty repairs by make, model, part, mileage, and so forth as a means of identifying the costs of quality problems. Armed with such information, the manufacturer can initiate value engineering changes to parts that show a higher propensity to cause warranty repairs. In general, by sifting through detailed transactional history, companies in a variety of industries have identified and quantified risks and then systematically reduced them, thereby reducing costs and increasing profits.
For example, in one business-to-business context in which we have worked, manufacturing scheduling was done on a first-in, first-out basis until it was determined that numerous small orders from infrequent customers would sometimes result in large orders for key customers being delayed. By using BI to identify its most profitable customers, this company was able to define business rules that could automatically be implemented by its manufacturing scheduling system, thus avoiding the costs of expediting large orders.
7.5.2 Summary: Business Intelligence for Operating Processes
Although early adopters of BI tended to live in the marketing and sales arena, more and more BI success stories are coming from the operations arena. As more companies seek further cost reductions in response to profit pressures, the power of BI for pinpointing costs, cycle times, asset utilization, service levels, risks, and quality levels at specific and detailed operating process levels has become apparent. Armed with better business information and analytical tools for improving operating processes, companies have succeeded in improving profits.
7.6 Summary: Important Ways Business Intelligence Can Drive Profit Improvement
We have seen in this chapter that the way specific companies compete in their industries drives how BI can be used to improve their profits. We have also seen that there are many different possibilities for using BI, which creates some opportunity for innovation and competitive advantage. That said, we can use BI opportunity analysis to identify the best BI opportunities for a given company.
To stimulate your thinking about opportunities that may be relevant to your company, we have provided a wide range of examples of how BI is being used today in companies around the world. Whether your company wishes to innovate with its use of BI or simply keep pace, the BI opportunities described in this chapter are a good place to start. The bar has been set high in many cases, but not so high that BI cannot deliver competitive advantage and/or increased profits to companies that leverage what has been learned to date by successful BI innovators and apply appropriate methods for BI design and development.