
Chapter 2 Identifying and Prioritizing Business Intelligence -Driven Opportunities for Your Organization
“… not many executives are information-literate. They know how to get data. But most still have to learn how to use data. Few executives yet know how to ask: What information do I need to do my job? When do I need it? In what form? And from whom should I be getting it? Fewer still ask: What new tasks can I tackle now that I get all these data? Which old tasks should I abandon? Which tasks should I do differently? Practically no one asks ‘What information do I owe? To whom? When? In what form?’”
—Peter F. Drucker, from “Be Data-Literate: Know What to Know”
In Chapter 1, we defined business intelligence (BI) and illustrated how it can be used to improve profits and business performance. The focus of this chapter is how you can use BI in your own organization. And as Peter Drucker has suggested above, you might have an uphill battle in getting busy business executives to focus on the business value of information. Helping you get their attention is one of the reasons for this book.
Our own experience confirms Drucker’s observations from over a decade ago. Although BI has made a lot of progress, much more work needs to be done before we can say that BI has come into its own as a competitive weapon, profit improvement strategy, and performance management tool. We further believe that the use of BI will be suboptimal until all levels of executives, managers, analysts, and knowledge workers in a given company have a common, internally and externally consistent perspective about how to use BI in their company. In short, BI needs to become ingrained in company cultures.
This implies that business needs a systematic way of addressing the challenge Drucker articulated—a challenge we hear echoed with great frequency by BI business sponsors, project managers, and architects from major companies in a wide range of industries. When we are instructors at conferences sponsored by The Data Warehousing Institute (TDWI), the premier industry association of information technology (IT) professionals involved with BI and data warehousing (DW), we always hear about the challenges of getting executives and managers to see the potential of BI and engage with the BI team to identify specific BI-driven profit opportunities for their companies. Empirical evidence dovetails with our own experience: companies that use IT most effectively have much higher levels of executive and management engagement than companies that don’t (Kempis and Ringbeck, 1998).
In response to these challenges, we have developed a business-driven BI opportunity analysis framework that systematically identifies BI opportunities and prioritizes those opportunities based on business impact and risk. The BI opportunity analysis—which we have successfully applied at the enterprise, division, and functional or departmental levels—takes a structured approach to answering the following key questions about potential BI opportunities:
Once you have identified the key BI-driven profit opportunities for your company, you can then apply BI portfolio management techniques to assess business and technical tradeoffs and establish priorities. Our clients have used the BI opportunity analysis framework not only to begin new BI initiatives but also to redirect and re-energize ongoing BI initiatives that haven’t delivered the goods.
2.1 Business Intelligence Opportunity Analysis Overview
The principal methods of BI opportunity analysis are to identify and prioritize opportunities to use business information, business analyses, and structured decisions. The principal objectives are to increase revenues and/or reduce costs, thereby increasing profits and creating business value. To accomplish those objectives, a structured approach that aligns two key factors with each other is needed:
Figure 2-1 shows an overview of the BI opportunity analysis approach.
As indicated by the arrows cascading down the left side of Figure 2-1, BI opportunity analysis is a top-down, sequential analysis of the key business factors that you must understand before you can identify opportunities to use BI to create business value. The right side of Figure 2-1 shows that the following need to be understood: (1) the business context in which a company operates, (2) how the company competes, and (3) how the company could use BI to compete more effectively and thereby create business value. The main flow of the opportunity analysis is from strategic to operational. It’s based on the value creation fundamentals explored in Chapter 1—that is, on the idea that to earn a return on investment (ROI) in BI, you must use BI to make a difference in one or more core processes that affect profit and performance. A bottom-up variant of this model can be used to determine how the information and associated BI applications that have been proposed by business users can be used to further organizational performance. The case study below demonstrates the BI opportunity analysis approach.

FIGURE 2-1 Overview of the business intelligence opportunity analysis approach.
Tip
You need a structured approach to defining BI opportunities. The BI Pathway provides one such approach.
2.2 Case Study: McCormick Opportunity Analysis
McCormick is a $2 billion manufacturer of commonly known food and beverage ingredients. Based solely on publicly available information, this section shows you step by step how McCormick might analyze its BI opportunities and applied that analysis to improve its profits and operating effectiveness.
McCormick sells ingredients to food and beverage processors, which in turn sell them to food and beverage retailers. The food industry is a mature, fragmented, international industry that is undergoing substantial structural changes typical of industry evolution. Changes in the food and beverage retailing industry affect the food and beverage processing industry (McCormick’s customers), and the resulting changes to the food and beverage processing industry affect McCormick’s business. From a BI strategy perspective, we are most interested in changes that affect McCormick’s customers and how they make money. The nature and extent of those changes may create opportunities for McCormick to use BI to its strategic and competitive advantage.
2.2.1 Evolution of McCormick’s Relevant Industries
Three key industries were relevant to McCormick’s BI planning: the food and beverage retail industry, the food and beverage processing industry, and the food and beverage ingredients industry.
The food and beverage retail industry has historically been fragmented and regional. By 1999, however, it had become increasingly concentrated and global. In the United States, the top 10 supermarket players generated 33% of industry sales in 1995, but by 1999 that figure stood at 45%, not counting Wal-Mart’s 12% market share. By 2004, the industry structure had the top 10 players holding between 55% and 70% of the market. Overall, the industry is a mature, consolidating, slow-growth industry with intense competition based on price, which means food and beverage processors receive pressure from the retailers to reduce prices, improve supply chain effectiveness, and differentiate themselves on more than just brand image. It is typical that mature industries spawn more aggressive competition based on cost and service, and that is certainly the model that Wal-Mart has used effectively in the consumer packaged goods industry. It is also typical that profits in the mature industry often fall, sometimes permanently.
The food and beverage processing industry is affected by trends at the retail level. The McCormick company’s primary interest is in identifying the major trends and their likely impact on the bases of competition in its ingredients businesses. This will suggest potential areas where McCormick can leverage BI.
The balance of power between food retailers and food processors shifted from 1995 to 2005 in favor of the retailers, which continues to put pressure on pricing and profits. The food processing companies most threatened by retailer consolidation are those with lower-ranking brands. In addition, slow domestic economic growth has intensified competition, motivated global expansion, and driven business process reengineering projects seeking improved margins. Many industry leaders spent the mid-90s engaged in cost-cutting initiatives and backward integration into the ingredients industry, and such initiatives have returned as much benefit as they are likely to in the short term. Thus, the food and beverage processing industry is consolidating, which increases buyer power in relation to McCormick and its competitors. Looking forward, McCormick can continue to expect pricing pressures and demands for increased efficiency as its customers seek to maintain their own profitability in the face of slow growth and retailer consolidation.
The food and beverage ingredients industry is similar in structure to that of the related downstream industries: mature, slow growth, fragmented, and increasingly global. Faced with increasing customer power owing to concentration and supplier consolidation programs, price pressures due to customer industry dynamics, and the threat of backward integration, ingredients industry firms are themselves merging in an attempt to maintain some balance of power. Although the overall growth rate of the ingredient industry is low, opportunities for growth in excess of the industry average are present. Industry players segment the market into what might be called macro-categories, for example, beverages, baked goods, dairy, candy/confection, and snack foods. These macro-categories have different growth rates, different leading brands, and different rates of new product development, all of which contribute to different opportunity profiles and growth potential.
Consistent with this overall environment, McCormick has successfully executed a strategy that is at once focused, differentiated, and based on cost leadership. McCormick is focused because it is only in the ingredients business. It is differentiated because its customer-based product development paradigm was at one time a singular position in the industry, and because it offers a broader product line than its competitors. The McCormick strategy is also based on cost leadership because it consistently focuses on margin improvement, global sourcing, and supply chain management (SCM) as means to achieve low-cost producer status.
Tip
When you’re planning for BI, pay careful attention to the strategic business drivers in your industry and to how your organization competes in the marketplace. These insights will provide vital guidance in helping you identify high-value BI opportunities.
2.2.2 Summary of Food Industry Drivers and Trends
Given the multiple levels of consolidation in the industry, each customer relationship takes on increased importance. At the same time, it’s also imperative to improve costs, pricing, customer selection, and customer revenue management. This suggests that growth and profitability could be enhanced by effective use of BI that supports those objectives. It also suggests that customer-focused business strategies and operating policies will be at least as important as, and probably more important than, they have traditionally been. Accordingly, BI capabilities that promote top-caliber customer service and make it easy to do business with McCormick are also important. A summary of the food industry drivers and trends is shown in Figure 2-2.
2.2.3 Application of the Business Intelligence Opportunity Analysis Framework at McCormick
Working with the publicly available facts described above, the BI opportunity analysis framework can be applied to systematically identify specific opportunities to use BI to improve profits at McCormick. Both top-down and bottom-up BI opportunity analysis techniques can be used. Although top-down techniques begin with a strategic view and work down into an operational view, many business users are more comfortable discussing operational priorities. In this case, bottom-up techniques are used to discuss BI in relation to business processes, and determine how it can be used to support business strategies and the achievement organizational goals and objectives. The analytical results, abbreviated for sake of illustration, might look like this:

FIGURE 2-2 A summary of food industry drivers and trends relevant to business intelligence.
Business Drivers
McCormick Business Strategies, Goals, and Objectives
Tip
To assess the potential business value of a BI opportunity, it is important to understand how it contributes to supporting one or more business goals.
• Improve profits by utilizing customer segmentation approaches to identify the most profitable customers and retain these customers by providing high-quality, differentiated service and support
McCormick Business Design Value Disciplines
Tip
Understanding how your business is designed and how it competes in the marketplace will provide additional insights as to where BI opportunities that provide potential bottom-line impact exist.
Core Business Processes
McCormick Business-Driven Business Intelligence Value Creation Opportunities
Based on McCormick’s industry environment, business drivers, strategies, goals, and business design, the following BI opportunities can be idenitified. Each would help McCormick improve profit and performance.
Tip
Use both top-down and bottom-up techniques for identifying BI opportunities. The top-down techniques let you start with the strategic picture, and the bottom-up techniques can yield valuable input from business users who are more concerned with operational priorities and specific business processes.
By systematically working through the BI opportunity analysis framework, we have identified specific BI opportunities for McCormick. By investing in one or more of these BI opportunities, McCormick would have better business information and analytical tools to inform key business decisions that drive increased profits. For example, industry consolidation puts pressure on profit margins. McCormick has chosen to respond to this challenge by adopting a strategy of supply chain collaboration, which seeks to drive costs down by using IT and business process improvements to improve operational efficiency. Toward that end, having SCM BI and customer service BI would allow McCormick manage the key variables and processes that determine supply chain costs, time, asset utilization, service, and quality—all of which contribute to the ability to maintain or improve gross margins in the face of margin pressures.
The McCormick BI opportunity analysis case study illustrates how your company could go about identifying actionable BI opportunities. The process does not stop there, however, as you then need to prioritize those opportunities based on business impact, risk, and project interdependencies. The next part of this BI opportunity analysis overview describes a straightforward method for prioritizing your BI opportunities.
Figure 2-3 shows the continuation of the BI opportunity analysis from the point of having identified opportunities of business-driven BI value creation to the point of having used a portfolio of BI opportunities to create a BI opportunity map. The BI opportunity map is a conceptual framework aimed at prioritizing BI opportunities based on what amounts to a risk-reward tradeoff. The opportunity map should not be thought of as a deterministic model, although opportunities are present to use multi-factor quantitative and/or qualitative analyses to support project placement on the business impact scale and/or the risk scale. Rather, the BI opportunity map serves as a basis for risk-reward tradeoff discussions between the business and IT leaders and managers who collectively have to sponsor, execute, and leverage the contemplated BI investments so that business value is created. To illustrate the use of the BI opportunity map, let’s continue our analysis of the McCormick case.
Tip
The BI opportunity map is an important communications vehicle. Representing your opportunities and challenges visually can stimulate your creative thinking and suggest approaches that you might not otherwise have considered.
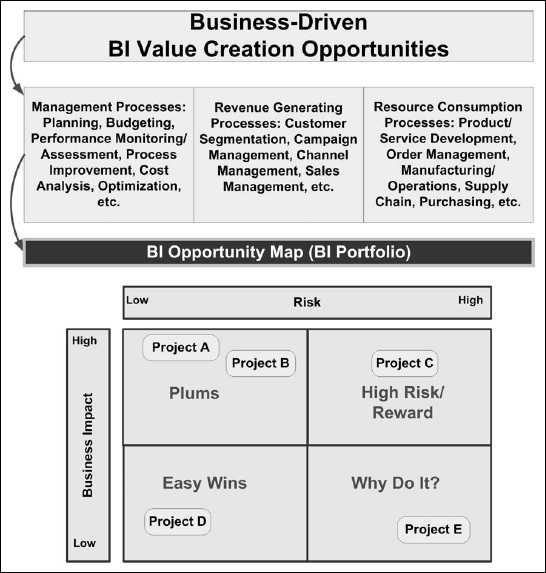
FIGURE 2-3 Structure of a business intelligence opportunity map.
For sake of illustration, to represent BI projects we will use the five categories of BI that we identified for McCormick. In actual practice, there might well be more than five projects, but for our purposes five will suffice. There are several ways to go about creating the BI opportunity map, one of which is to have one person array the projects within the opportunity map quadrants as the starting point for discussions with knowledgeable business and IT leaders and managers. If this approach is used, the initial BI opportunity map for McCormick might look like Figure 2-4.
The logic for the project placements is as follows:

FIGURE 2-4 Filling in the business intelligence opportunity map.
Tip
Your BI opportunities will yield the most value for the least cost if you prioritize them carefully. Prioritization requires understanding both the potential business impact and the technical and organizational risks that exist. If you haven’t prioritized your opportunities, then you might try low-value, high-difficulty opportunities first and miss out on the “plums” that would deliver high value for very little effort.
Business and IT leaders and managers can use the initial BI opportunity map as the starting point for discussions addressing the underlying assumptions of the initial project placements, and then they can potentially adjust those placements, as illustrated by Figure 2-5.

FIGURE 2-5 Revising the business intelligence opportunity map.
In the example above, the discussion of risk-reward tradeoffs resulted in a group consensus that
Based on these discussions and the relative placement of the projects within the BI opportunity map, McCormick might then prioritize its BI opportunities as follows:
These priorities would then establish the order in which the specific BI development projects would be undertaken.
2.2.4 Business Intelligence Opportunity Analysis Summary
The first part of this chapter has introduced a business-driven BI opportunity analysis framework that you can use to identify and prioritize the BI-driven profit opportunities for your company. We used the McCormick case study to illustrate the practical application of this approach in a specific industry, although we have used the approach in a wide variety of industries. In the McCormick case, we applied the BI opportunity analysis at an enterprise level; in other, real-world contexts, we have applied it at the strategic business unit level and functional/departmental level. As with any analytical framework or method, it is important to note that the method is only a way to organize the analysis. The quality of the outcome depends on the quality of analysis, thinking, and discussion about the specific BI opportunities, their business impacts, and the risks and rewards of investing in the specific BI opportunities. In that vein, the next part of this chapter will discuss some practical considerations for successfully using BI opportunity analysis to set the stage for using BI to improve profits and performance.
2.3 Business Intelligence Opportunity Analysis: Practical Considerations
The BI opportunity analysis framework encompasses a mix of analyses and processes: some are relatively straightforward, and others are more art than science. There are also differences among the contexts in which the opportunity analysis might be conducted. In one case, you might do an enterprise BI opportunity analysis for a company that is just getting started with BI. In another case, you might do a BI opportunity analysis for a division or function that has experience with BI but has not achieved the ROI it sought. Also, different companies and different divisions within companies have varying appetites for structured analytical approaches such as opportunity analysis. Some will embrace the approach fully, bringing their best thinkers to the task, whereas others will circumscribe the analysis and simply use it to validate their gut feelings. Because of these practical differences, and because of the potential impact on ROI, it is important to identify some key practical considerations that affect the cost and quality of the BI opportunity analysis.
Tip
Although there are definite advantages in doing BI opportunity analysis at the enterprise level, you can do it at lower levels (division, unit, function, etc.) based on the scope of the BI initiative. It is still important, however, to analyze and understand business drivers, value disciplines, and core processes to provide the business context needed to find the highest value opportunities.
2.3.1 Art Versus Science in Business Intelligence Opportunity Analysis
If we review the top-down analytical flow that makes up the BI opportunity analysis, we see that three of the factors we seek to understand are: (1) business drivers; (2) business strategy, goals, and objectives, and (3) business design, which includes value disciplines and core business processes. Our experience has been that developing a suitable understanding of these factors is straightforward, particularly for public companies but also for large private companies. In addition to the wide range of industry and company information that is in the public domain and often available via the Internet, a few hours of discussion with company leaders and managers will generally allow the BI opportunity analysis team to capture sufficient information about business drivers, strategies, value drivers, and core processes to serve as inputs for the process of identifying business-driven BI value creation opportunities. However, the process of identifying how BI can be used within core processes to impact profit is where art comes into play.
The process of identifying business-driven BI value creation opportunities requires knowledge of a company’s core business processes and knowledge of how BI has been used in different contexts to improve profits. Sometimes both knowledge sets exist in a given company. If your company is not in that position, then using an outside facilitator with broad knowledge of business and BI may be in order. Under either scenario, the central task is to imagine how the core business processes could be improved by leveraging business information, business analyses, and potentially structured business decisions.
One way to stimulate business thinking about the possibilities is to read BI case studies. Such case studies are available from TDWI (www.tdwi.org) and other sources. Another way to stimulate the imagination is to use generic analytical frameworks. For example, in their seminal article “How Information Gives You Competitive Advantage,” Michael Porter and Victor Millar (1985) apply the value chain construct at the single-company level to examine points at which information can be used as a source of competitive advantage. Figure 2-6 below illustrates the value chain for a single firm.

FIGURE 2-6 The value chain for a single firm.
Many companies have applied transactional IT—such as packaged enterprise requirements planning (ERP), customer relationship management (CRM), and SCM applications—at points in the value chain as a means of gaining transactional efficiency. The same value chain approach can be used to organize thinking about BI opportunities. For example, you could brainstorm about how to use business information and associated business analyses to improve the cost-effectiveness of inbound and outbound logistics.
Another generic framework for thinking about ways that BI could drive increased profits is provided by Thomas Davenport and James Short (1990) in their book The New Industrial Engineering: Information Technology and Business Process Redesign. Their framework describes various IT capabilities and how they can benefit an organization. We have adapted the framework to our purposes here, adding columns to describe how BI can be used to capture the generic business benefit and to provide relevant BI examples. The adapted framework is shown in Table 2-1.
In seeking to identify BI-driven profit opportunities, the framework provided by Table 2-1 can be used to structure a brainstorming session with business executives, managers, and front-line knowledge workers.
Tip
Whatever framework you use, it should help your organization develop a structured way of thinking about your business and BI opportunities.
Depending on the scope of the BI opportunity analysis, a number of other generic frameworks can be used to stimulate thinking about how BI could improve your profits. In the SCM world, there is the supply chain operations reference (SCOR) model (available at www.supply-chain.org), which details planning and operational “best practices” and associated performance metrics. At the strategic level, the use of “balanced scorecards” has spread over the past five years. If your company uses a balanced scorecard, it can be a good stimulus for thinking about the use of BI—both to report results and to improve the underlying processes that drive results. In the business process improvement arena, a wide range of published process performance metrics can be used as a starting point for BI opportunity analysis.
In short, numerous generic frameworks can stimulate thinking about how BI can improve the results at your company. There are enterprise management frameworks, functional management frameworks, business process management frameworks, value chain frameworks, and so forth. The art, we believe, lies in picking suitable frameworks to fit the scope of the BI opportunity analysis and in bringing the right business and IT leaders and managers into the conversation.
2.3.2 Quality of Business Intelligence Opportunity Analysis
The BI opportunity analysis and the creation of the BI opportunity map set the stage for a sequence of investments in BI. The premise is that making the investments will generate incremental profit in excess of the amounts invested. Two general factors determine whether the premise holds true. One factor is whether the prerequisites for leveraging BI have been met: those prerequisites are the subject of Chapter 3. The other more immediate factor is whether the BI opportunity analysis has correctly identified BI investments that, if properly leveraged, will generate incremental profit in excess of the amounts invested. This speaks to the quality of the BI opportunity analysis, and there can be a lot at stake. For example,
Table 2-1
Information technology (IT) capabilities and their potential benefits for business and business intelligence (BI)

In our experience, the low end of BI annual investments by major companies in a variety of industries falls between $1 million and $5 million for departmental or functional BI investments. At the enterprise BI level, annual investments of $5 million or more are typical, as illustrated by the examples above. Given the magnitudes of these investments, it is critical that the BI opportunity analysis be conducted with appropriate quality and rigor. That means drilling down and closely examining each potential BI investment identified by the BI opportunity analysis. How, exactly, will BI be used to improve profits?
Pitfall
Many companies fail to do a careful BI opportunity analysis. As a result, they fail to identify their highest-value BI opportunities and end up wasting money on lower-priority efforts.
More and more attention has been paid recently to this question. Experience suggests that this is because not all BI projects have been successful from a business perspective. For every success story, dozens of companies had investments in BI that did not pay off. This track record suggests that basic methods need to evolve in order to better capture the business value of BI.
As noted in Chapter 1, DW—a key enabler of BI—has historically focused on the technical challenges, technical methods, and project management methods required to deploy data warehouses and BI. However, an important recent innovation is in the methods used fully to leverage the potential of BI. Business-centric BI methods (the subject of Chapter 4) extend the technical methods of BI pioneers such as Inmon, Kimball, and Imhoff by designing ROI into BI initiatives from the outset and by systematically driving the use of BI into the core business processes and decisions that determine business results. Business-centric methods go beyond traditional approaches by putting rigor into defining the business value capture mechanism for each BI project. This includes determining and specifying a priori how business processes and key decision processes must change in order to leverage BI investments.
A key element of business-centric BI methods is the BI opportunity analysis and the creation of the BI opportunity map. As discussed earlier, the BI opportunity analysis identifies potential opportunities for using BI to improve profits. Those opportunities are then arrayed within the four quadrants of the BI opportunity map according to their business impact and associated risk. To score potential BI opportunities effectively on the business impact scale, the BI opportunity analysis team must rigorously examine the business value capture mechanism for each identified opportunity.
Ideally, this entails developing “as-is” and “to-be” process models as a means of understanding how a given process works today, how it would work when the targeted BI is brought to bear, and how it would generate the incremental revenue and/or reduced costs from the BI-driven process change. In actual practice, we find that many very successful companies do not have readily available process metrics for the as-is state, for example, process costs, process cycle times, and process effectiveness measures. That said, we find that experienced business leaders and managers have a deep understanding of their businesses, and they can intuitively judge whether a given investment in BI would have a suitable business impact. Accordingly, when sufficient analytical rigor is used, a good understanding of the business value capture mechanism for a given potential BI investment is developed. The key, in our view, is effectively engaging business executives and managers so that the quality of the BI opportunity analysis and the BI opportunity map is good enough to justify multi-million dollar investment decisions.
2.3.3 Risk-Reward Tradeoffs and the Business Intelligence Opportunity Map
As we discussed earlier, the BI opportunity map is a tool for promoting informed discussion of the risks and rewards associated within given BI opportunities. The rewards side of the equation is expressed on the business impact scale of the BI opportunity map, and the anticipated rewards (business impact) should reflect a rigorous understanding the business value capture mechanism for each opportunity. The risk side of the equation is expressed on the risk scale of the BI opportunity map, and BI risk analysis is needed to effectively place any given BI opportunity on the risk scale. An effective BI risk analysis will go beyond technical risks, although they are certainly important to consider.
Many BI initiatives have been entirely successful from a technical perspective and yet were failures because they did not deliver the expected business value. Accordingly, the business risks and the technical risks associated with the proposed BI investments on the BI opportunity map must be evaluated. To address this requirement, we have developed a BI readiness assessment framework (available at www.decisionpath.com/readiness.htm), which can be used to gauge a company’s prerequisites to leverage BI successfully and thus create incremental profits. Lack of readiness means risk, and thus you can use the BI readiness assessment as a tool for identifying key BI risks of a given BI investment and/or a portfolio of BI investments. The critical prerequisites for successfully leveraging BI investments are as follows:
Pitfall
It’s not enough to focus on technical success. Unless you can integrate your BI efforts into the processes, culture, and IT infrastructure of your organization, BI won’t deliver the business value that it should. A structured BI readiness assessment is essential to make BI an all-around success.
Chapter 3 will discuss BI readiness in greater detail, so we offer only this summary of prerequisites—and potentially risks—at this point. By using this structured approach, you are better positioned to understand the risks of specific BI opportunities and thus to place them more accurately on the risk scale of the BI opportunity map. If you also have an accurate assessment of the business impact of the BI opportunities, you will be in an excellent position to make effective risk-reward tradeoffs and thereby to establish a realistic foundation for leveraging BI to increase profits.
2.3.4 Business Intelligence Opportunity Analysis: Summary
We started this chapter by posing a challenge to business leaders and managers. Quoting Peter Drucker, we in essence asked readers to consider whether they really know what information they need to do their jobs. Having had a variety of experiences with a variety of executives and managers, we have concluded that better, more structured approaches to determining BI opportunities are needed, and we developed the BI opportunity analysis framework systematically to identify BI opportunities and prioritize them based on business impact and risk. BI opportunity analysis is part of a broader business-centric BI method that seeks to ensure that BI investments deliver business value. To accomplish that goal, it explicitly considers the business value capture mechanism (business impact) of each BI project at the outset, it manages BI risks, and it manages the process changes required to deliver the promised business value. BI opportunity analysis establishes a solid foundation for successful BI investments.