Chapter 2 Key Concepts
He who loves practice without theory is like the sailor
who boards ship without a rudder and compass
and never knows where he may cast.
– Leonardo da Vinci
In This Chapter
The Framework for Information Quality
Data Governance and Data Stewardship
The Information and Data Quality Improvement Cycle
Introduction
This chapter discusses a number of concepts that are important to understand so that you can better implement The Ten Steps process. The Ten Steps provide practices for assessing, improving, implementing, and creating quality data. The concepts provide the background about information quality and the components necessary for it. These concepts are not unnecessary theory with no practical application to reality. Understanding them will help you decide which activities from The Ten Steps process you should implement. In many cases concepts from the steps can be used immediately to analyze and better understand your particular data quality situations.
Think of it this way: If you are going on a road trip to an unfamiliar area of the country, you look at a map. The map can be a paper copy you unfold and consult as you continue your journey, or you might enter coordinates into a GPS system. Either way, there are basics about the map or the GPS that you need to know in order to understand what they are telling you. A legend shows various symbols on the map and their descriptions; such things as types of roads, route symbols, sites of interest, hospitals, and scale help interpret what you see.
Similarly, the key concepts are broad ideas or guiding general principles that help you interpret and understand information quality. The specific activities in The Ten Steps process are based on the principles outlined in the key concepts. Just as you can better plan and carry out your trip if you understand the basic concepts of how to use a map, you will make better decisions about applying The Ten Steps if you understand the basic ideas presented in the key concepts.
![]() Key Concept
Key Concept
The Framework for Information Quality (FIQ) enables organized thinking so you can effectively plan and implement improvements.
The Framework for Information Quality
The Framework for Information Quality (FIQ) provides a logical structure for understanding the components that contribute to information quality. It helps you understand a complex environment that creates information quality problems. Most important, the FIQ enables organized thinking so that you can effectively plan and create quality data, and implement improvements as needed.
Think of this framework as you would the Food Pyramid,1 which was established to improve nutrition and provide dietary guidance (Figure 2.1). The Food Pyramid comprises guidelines and a visual of the components for healthy eating and physical activity. Upon first look its meaning may not be obvious, but after a quick tutorial it is clear that the illustration provides a wealth of information that can be referenced in one glance, and additional instructions are available to describe and apply its concepts.
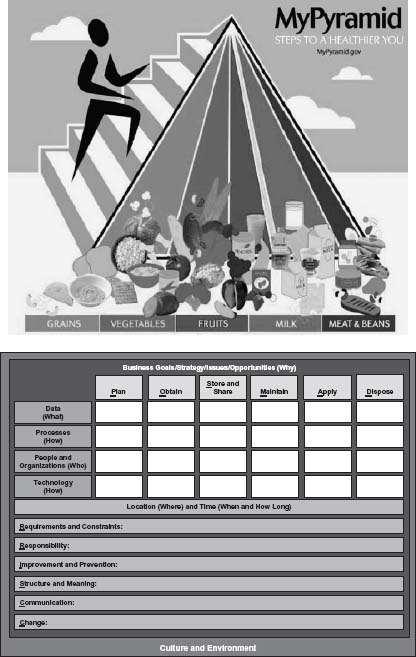
Figure 2.1 • Visualizing a plan for help: the Food Pyramid and the Framework for Information Quality.
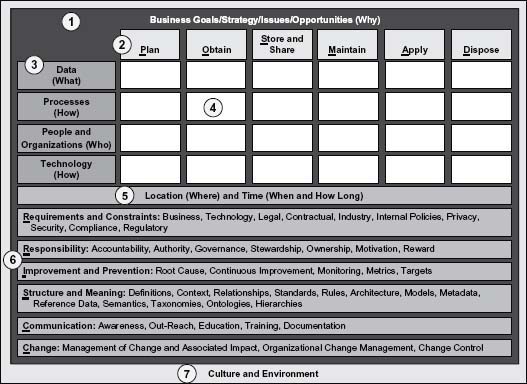
Figure 2.2 • The Framework for Information Quality.
Source: Copyright © 2005–2008 Danette McGilvray, Granite Falls Consulting, Inc.
The Food Pyramid is not one size fits all, but the basics are the same. You use what you have learned about it to make it work for you. The Food Pyramid continues to provide a useful reminder about health, nutrition, and activity.
Likewise, the FIQ (Figure 2.2) provides a visual of the components necessary for healthy information. There are seven main sections, which are described in the following section. Remember: The framework shows the components necessary for information quality. Later in the book you will learn about The Ten Steps, which are the process for implementing the FIQ concepts. You will use what you have learned from it to make The Ten Steps process work for you.
Once you understand the FIQ, it provides a helpful quick reference and you can use it as a tool for
- Diagnosis—Assess your practices and processes; realize where breakdowns are occurring and determine if all components necessary for information quality are present; identify which components are missing and use them as input to project priorities and initial root cause analysis.
- Planning—Design new processes and ensure that components impacting information quality have been addressed; determine where to invest time, money, and resources.
- Communication—Explain the components required for and impacting information quality.
Sections of the Framework Explained
The FIQ is easy to understand if you look at it section by section. Use the framework to provide the foundation for your use of The Ten Steps process. The framework’s seven sections are described next.
1—Business Goals/Strategy/Issues/Opportunities (Why)
Business goals and strategies should drive all actions and decisions. An issue is a situation that is currently suboptimal. An opportunity is something new to be used to your advantage. Information should always start with the question, “Why is this important to the business?” This section is indicated as a sheet behind the other sections because anything done with information should support the business in meeting its goals.
2—The Information Life Cycle
To manage any resource, it is important to understand the idea of a life cycle, which refers to the process of change and development throughout the useful life of something. Any resource should be properly managed throughout its life cycle in order to get the full use and benefit from it. Use the acronym POSMAD to remember the six phases in the Information Life Cycle.
Plan—Identify objectives, plan information architecture, and develop standards and definitions; model, design, and develop applications, databases, processes, organizations, and the like. Anything done prior to a project going into production is part of the Plan stage. Of course, throughout design and development all phases of the life cycle should be accounted for so the information will be properly managed once in production.
Obtain—Data or information is acquired in some way, for example, by creating records, purchasing data, or loading external files.
Store and Share—Data are stored and made available for use. They may be stored electronically such as in databases or files; they may also be stored in hardcopy such as a paper application form that is kept in a file cabinet. Data are shared through such means as networks or email.
Maintain—Update, change, and manipulate data; cleanse and transform data; match and merge records; and so forth.
Apply—Retrieve data; use information. This includes all information usage such as completing a transaction, writing a report, making a management decision from a report, and running automated processes.
Dispose—Archive information or delete data or records.
A solid understanding of the Information Life Cycle is required for information improvement, and it will be referenced throughout The Ten Steps process. See details in the Information Life Cycle section later in this chapter.
3—Key Components
Four key components affect information throughout its life cycle. These components need to be accounted for in all of the phases in the POSMAD life cycle.
Data (What)—Known facts or other items of interest to the business.
Processes (How)—Functions, activities, actions, tasks, or procedures that touch the data or information (business processes, data management processes, processes external to the company, etc.). “Process” is the general term used here to capture activities from high-level functions describing what is to be accomplished (such as “order management” or “territory assignments”), to more detailed actions describing how it is to be accomplished (such as “create purchase order” or “close purchase order”) along with inputs, outputs, and timing.
People and Organizations (Who)—Organizations, teams, roles, responsibilities, or individuals that affect or use the data or are involved with the processes. They include those who manage and support the data and those who use (apply) it. Those who use the information can be referred to as knowledge workers, information customers, or information consumers.
Technology (How)—Forms, applications, databases, files, programs, code, or media that store, share, or manipulate the data are involved with the processes, or are used by people and organizations. Technology is both high-tech such as databases and low-tech such as paper copies.
4—The Interaction Matrix
The interaction matrix shows the interaction between the Information Life Cycle phases and the key components of data, process, people and organizations, and technology. Through it you can understand what needs to be known for each component throughout the Information Life Cycle. See Figure 2.3 for sample questions in each cell of the matrix indicating the interaction between the life cycle phases and the key components. The questions in the interaction matrix can be used to help you understand an existing situation or to help you plan a new process or application. Use them to prompt your thinking to develop additional questions relevant to your circumstances.
5—Location (Where) and Time (When and How Long)
Always account for location and time—where events are happening, when the information will be available, and how long it needs to be available. For example, where are the knowledge workers and those who maintain the information located? In which time zones are they? Does this impact their ability to access the data? Are adjustments to processes needed to account for location or time? Is there a required time period for which the data must be managed before they are archived or deleted?
Note that the top half of the FIQ, along with the first bar, answers the interrogatives of who, what, how, why, where, when, and how long.2
6—Broad-Impact Components
Broad-impact components are additional factors that affect information quality. They are indicated as bars that span the upper sections of the interaction matrix because they should be considered throughout the information’s life cycle. Lower your risk by ensuring that components have been discussed and addressed. If they are not addressed, you are still at risk as far as information quality is concerned. The acronym RRISCC will help you remember the categories and associated topics that describe the broad-impact components.
Requirements and Constraints—Obligations the company must meet and the information needed to support the ability of the company to meet them. These include: business, technology, legal, contractual, industry, internal policies, privacy, security, compliance, regulatory requirements.
Responsibility—Accountability, authority, governance, stewardship, ownership, motivation, reward.
Improvement and Prevention—Root cause, continuous improvement, monitoring, metrics, targets.
Structure and Meaning—Definitions, context, relationships, standards, rules, architecture, models, metadata, reference data, semantics, taxonomies, ontologies, hierarchies. Structure and Meaning provide context for the data, so we know what the data mean and therefore how best to use them.
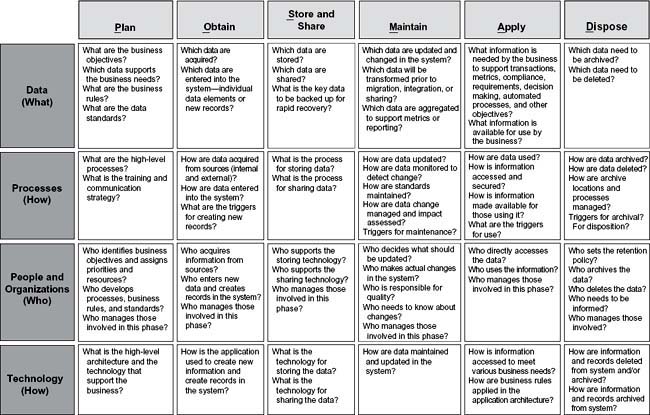
Figure 2.3 • POSMAD interaction matrix detail—sample questions.
Source: Copyright © 2005–2008 Danette McGilvray, Granite Falls Consulting, Inc.
Communication—Awareness, outreach, education, training, documentation.
Change—Management of change and associated impact, organizational change management, change control.
7—Culture and Environment
Culture and Environment are shown as a background to all sections and all components of the FIQ. They have an impact on all aspects of your information quality work, but are often not consciously considered.
Culture—A company’s attitudes, values, customs, practices, and social behavior. It includes both written (official policies, handbooks, etc.) and unwritten “ways of doing things,” “how things get done,” “how decisions get made,” and so forth.
Environment—Conditions that surround people in your company and affect the way they work and act. Examples are financial services versus pharmaceutical; government agencies versus publicly traded companies.
This is not to say that you cannot be creative in how you approach some of your information quality work. However, you will better accomplish your goals if you understand and can work effectively within the culture and environment of your company. For example, a company that is highly regulated and is already used to following documented standard operating procedures will most likely have less difficulty accepting standardized processes to ensure information quality than will a company where everyone operates independently. Even within a company you may find differences. For example, discussing information quality with a sales team may take on a different look and feel than discussing it with an IT team.
Quick-Assessment Parameters
The FIQ concepts will be used in detail throughout The Ten Steps process. In addition, the framework can be used at a high level to quickly ascertain a situation. The FIQ provides a logical structure for understanding the components that contribute to information quality. By understanding these components (along with the details in the POSMAD interaction matrix), you can better analyze a situation or complex environment where you are having information quality problems.
Suppose someone has contacted you regarding a data quality issue. You can immediately start asking yourself (and others) questions such as:
- What is the business issue associated with this situation?
- Which phase of the information life cycle are we in and what is happening in that phase?
- Which data, specifically, are involved?
- Which processes are involved?
- Which people organizations are involved?
- Which technology is involved?
- What happened to the data in the earlier phases of the life cycle?
- How will data in the later phases of the life cycle be impacted?
- Which broad-impact components have been addressed? Which areas need further attention?
Answers to these questions will help you understand the initial business impact, determine the scope of the issue and who needs to be engaged in solving it, and uncover linkage points to other business areas and systems. You may also highlight potential root causes.
You can also use the FIQ to help when analyzing existing processes or developing new processes to ensure that you have accounted for the components that will impact data quality. Imagine how much more stable your processes would be (and how much better the resulting quality) if you could account for what was happening to your data, processes, people, and technology throughout the Information Life Cycle.
Determine the phase(s) of the Information Life Cycle that are within scope of your project. Realize that quality is affected by all phases but that real work must have manageable and specific boundaries. Of course, you cannot address everything at once and will need to prioritize your efforts. For example, one project team realized they had spent a lot of time in the Obtain phase of the framework but had not spent any time managing the Maintain phase. So they decided that their next project would focus on how they were updating and maintaining their information. Knowing the larger picture can help you put together an approach to addressing what is most important now.
The Information Life Cycle
Because the Information Life Cycle is so important to managing information quality, we will expand on the idea of the life cycle introduced earlier.
Information is a resource and is essential to performing business processes and achieving business objectives, just as money, inventory, facilities, and people are resources. Any resource should be properly managed throughout its life cycle in order to get the full use and benefit from it. In reality, you will have to make choices about which information life cycle phases you have the time and resources to address at any given time. Understanding the concept of a life cycle will help you make better choices about priority.
![]() Key Concept
Key Concept
Information is a resource that should be properly managed throughout its life cycle in order to get the full use and benefit from it.
The Life Cycle of Any Resource
In his 1999 book, Larry English talks about a universal resource life cycle that consists of processes required to manage any resource—people, money, facilities and equipment, materials and products, and information.3 I refer to these processes as phases. The high-level phases in the Information Life Cycle as I have applied them are described as follows4:
- Plan—You prepare for the resource.
- Obtain—You acquire the resource.
- Store and Share—You hold information about the resource electronically or in hardcopy and share it through some type of distribution method.
- Maintain—You ensure that the resource continues to work properly.
- Apply—You use the resource to accomplish your goals.
- Dispose—You discard the resource when it is no longer of use.
For financial resources you plan for capital, forecasting, and budgeting; you obtain financial resources by borrowing through a loan or selling stock; you maintain financial resources by paying interest and dividends; you apply financial resources by purchasing other resources; and you dispose of the financial resources when you pay off the loan or buy back the stock.
For human resources you plan for staffing, skills, recruiting, and the like; you obtain human resources by hiring; you maintain human resources by providing compensation (wages and benefits) and developing skills through training; you apply human resources by assigning roles and responsibilities and putting skills to use; and you dispose of human resources through retirement or “downsizing” or through employees leaving of their own accord. Even financial and human resources have activities in the Store and Share phase, as information supporting those resources must be stored and shared in some manner.
Phases of the Information Life Cycle
The acronym POSMAD is used to help remember the six phases in the Information Life Cycle. Table 2.1 describes the phases and provides examples of activities within each phase of the life cycle as it applies to information.
Table 2.1 • POSMAD Information Life Cycle Phases and Activities

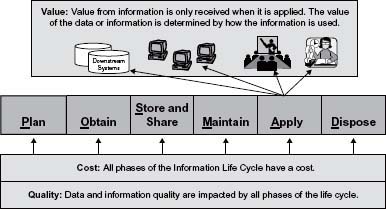
Value, Cost, and Quality and the Information Life Cycle
It is important to understand value, cost, and quality in relation to the Information Life Cycle (see Figure 2.4). Following are some key points:
- All phases of the Information Life Cycle have a cost.
- It is only when the resource is applied that the company receives value from it. If the information is what the knowledge worker expected, and is useful when applied, then it is helpful and has value to the company. If the quality is not what the knowledge worker needs, then that information has a negative impact on the business.
- Data quality is affected by activities in all of the phases in the life cycle.
- By viewing information as a resource, you can determine its costs and its value to the business.
While the business really only cares about the information when it wants to use it, resources should be devoted to every phase in the life cycle in order to produce the quality information needed. In reality, you cannot do everything at once. It may not be practical or feasible to address all phases of the life cycle at the same time. However, you should know enough about what happens in each phase and carefully consider how the information is being managed (and needs to be managed) in every phase so you can make informed decisions about investing in your information resource.
![]() Key Concept
Key Concept
There is an economic formula for enterprise profitability and survival. The economic formula is simple. Economic Value occurs when the benefit derived from a resource’s application is greater than the costs incurred from its planning, acquisition, maintenance, and disposition.
– Larry English (1999, p. 2)
Information Is a Reusable Resource
A major difference between information as a resource and other resources is that information is reusable. It is not consumed when used. Once a product on the shelf is purchased by a customer, it is no longer available for the next customer to buy. Once materials are used to build that product, they are not available to be used in the next manufacturing cycle. What happens with information? Just because Sam runs a report on the first of the month, does the information disappear when Maria runs her report on the tenth, or when Patel accesses the information to help a customer? Of course not! When information is used it is not depleted. The implications of this difference are important:
Quality is critical—If the information is wrong, it will be used again and again—with negative results. And each time, that poor-quality information causes more cost to the company or may result in lost revenue. (More about this later.)
The value of the information increases the more it is used—Many of the costs in planning, obtaining, storing, sharing, and maintaining the information have been expended. Often with little or no incremental cost, it can be used in additional ways to help the company.
The Information Life Cycle—Not a Linear Process
We have talked about the life cycle as if in the real world these activities happen in a very clear, recognizable order. This is not the case. Figure 2.5 illustrates the phases in the Information Life Cycle. Note that the life cycle is NOT a linear process and is very iterative.
There can be multiple ways that any piece of data or set of information is obtained, maintained, applied, and disposed of. In actuality the same information can also be stored in more than one place. It is because activities in the real world are complicated and messy that knowing the Information Life Cycle is so helpful.

Figure 2.5 • The Information Life Cycle is not a linear process.
Source: Adapted from a figure in Larry P. English’s Improving Data Warehouse and Business Information Quality (John Wiley & Sons, 1999), p. 203. Used with permission.
For example, suppose you purchase information from an external source. The data are received by your company and stored—maybe initially in a temporary staging area. The data are then filtered and checked before being loaded into the internal database. Once in the database the data are available for others to apply—some are retrieved through an application interface, or some may be shared through a mechanism called an enterprise service bus and loaded into another database where others in the company access and use them through yet another application. Data can also be maintained in various ways—by updating individual fields and records through an application interface or by receiving updates from a subsequent file sent from an external data provider.
It is easy to see how the information path quickly becomes very complicated. Applying your knowledge of the Information Life Cycle helps bring clarity to a complex situation.5
Life Cycle Thinking
Using the Information Life Cycle helps you analyze and segment activities in such a way that you can look at what is happening and identify in which phase of the life cycle those activities are taking place. This knowledge helps you make decisions about what is working, what is not working, and what needs to be changed. I advocate the idea of “life cycle thinking,” which can be applied in many ways. Using life cycle thinking helps you immediately start to understand (or start asking the right questions to discover) what is happening to your data from any view in your company. Let’s look at a few examples.
Life Cycle Thinking at a High Level
Assume you are responsible for the customer information that supports the Sales and Marketing functions in your company. Maybe all you know right now is what your organization looks like. The head of Sales and Marketing for Europe in one global company was concerned about the quality of the customer data that supported his organization. He described his organization to me, and I drew a high-level chart on the board. The Call Center, Marketing, and Field Sales were the three main teams under the manager’s geographical organization (in this case Europe Sales and Marketing). We chose to look further at the organizational structure under Marketing, which consisted of four teams—Business Intelligence, Customer Information Management, Marketing Communications, and Business Segments.
After a very brief tutorial on the Information Life Cycle, I asked which teams impacted the customer information in each of the life cycle phases: Which have input into the planning process for their customer information? Which obtain the data? Who uses or applies the customer information? Who maintains the data? Who can dispose of the data? Figure 2.6 shows the result of that 30-minute conversation. Examine it and see what you can learn about information quality—just with this amount of information and at this high level of detail.

As shown in the figure, four teams have input to the planning phase of their customer information (Business Intelligence, Marketing Communications, Business Segments, and Field Sales). The Call Center, Customer Information Management, Marketing Communications, and Field Sales all obtain this information in various ways, but only three of these teams maintain or update it. This makes sense, as often the data obtained from Marketing Communications come from field events and this team sees each customer signing in as a new one. Therefore, we can already see that to avoid duplicate customer records there needs to be a process for identifying already existing records in the customer database when adding new customer records obtained through Marketing Communications.
A potential data quality problem can be seen when asking the question, “Do all teams that obtain the data receive the same data entry training and do they have the same set of data entry standards (whether manual or automated)?” If the answer is no, you can be sure you have a data quality problem—you just don’t know yet how big it is or which pieces of data are most affected. You can also see that the Call Center obtains, maintains, applies, and disposes of the customer information, yet is not involved in the planning phase. Thus, important requirements could be missed and could impact data quality. There is more you can learn from this illustration, but it shows how you can start seeing potential impacts to data quality even at this point.
Now let’s look at the life cycle from another view—that of points where the company has interaction with its customers. Figure 2.7 starts with the customer and shows multiple communication methods between the company and the customer, the storage of the customer data in the database, and the various uses of customer information. Some uses of the information include recontacting the customer. Once again, the various phases of the Information Life Cycle are indicated. Note that this time we choose not to include the Plan phase, but do include the Store and Share phase.
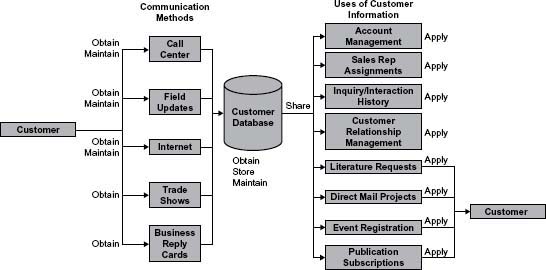
What can you learn from the Figure 2.7 illustration? One key lesson for the team during this exercise was seeing the list of ways their customer information was being used. If you were to ask, most would know that Account Management uses customer information and Sales Rep Assignments also rely on it. But somehow just seeing this simple list of the important ways customer information was used by Sales and Marketing almost built the business case for the data quality project.
Life Cycle Thinking at a Detailed Level
You have seen how to apply life cycle thinking at a high level. Let’s go to a different level of detail. It is still life cycle thinking but from yet another view of the company—that of roles. Figure 2.8 lists roles down the first column and several business terms associated with customer information across the remaining columns. The business terms could also be known as data subject areas or data groups. Note that only three of the life cycle phases are used (Obtain, Maintain, and Apply). The team looked at each role and noted if that role obtained, maintained, and/or applied the corresponding customer information.
Analyze each row and each column in Figure 2.8. The rows show the breadth of the data being impacted by each role. The columns show all the roles that impact a specific data group.
A question can be raised similar to the one asked when looking at POSMAD at the organizational level: “Do all roles that obtain the data receive the same training and have the same set of data entry standards?” If not, once again, there’s a data quality problem, but you don’t know its size or which data are most affected.
One project team knew that many departments could apply or use the same data, but they thought only one department could create or update them. Through this application of life cycle thinking they found that people in other departments actually had the ability to create and update data. The impact to data quality could immediately be seen: No consistent training or standards for entering data across the teams means poor-quality data. This information gives you the knowledge to make some educated statements about your information quality and where you want to focus your efforts.
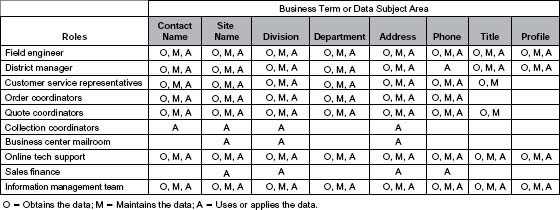
In Figure 2.8, you can also see three roles that only apply the information; they do not collect or maintain it. What often happens in that situation is that the needs of those knowledge workers are not taken into consideration when obtaining the data. For example, pharmacists at one drug store chain needed to track information about customers when there was no place to enter it on their screen. So to the end of the customer’s name they added codes such as “WC” (to show the customer had Workers’ Compensation) and a variety of other strange symbols that indicated things like alternate insurance, suspected of shoplifting, and whether the patient had another record under a different name. Later the mailroom created labels for an offer that was sent to customers. Complaints started coming in from those who received letters with names on the mailing label that looked like “John Smith WC!* check Rx comments to see alternate name.”
The life cycle of information is an essential component of the FIQ and will be used throughout The Ten Steps process. Use life cycle thinking—at many levels of detail—to help you manage information as a resource and improve data quality.
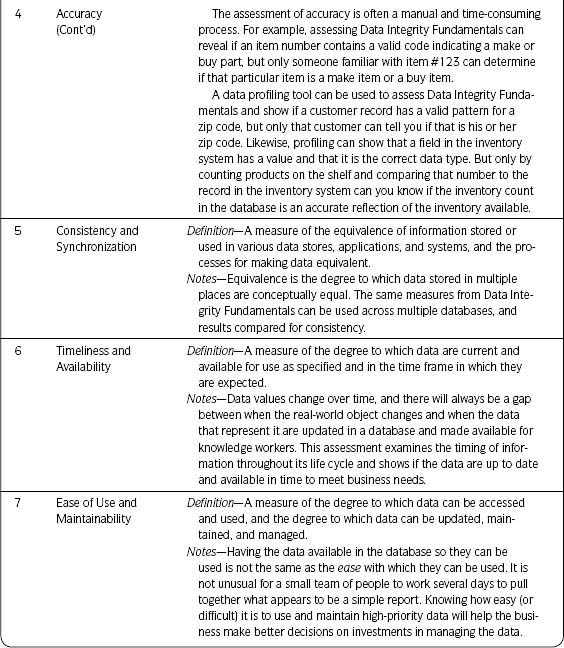
Data Quality Dimensions
Data quality dimensions are aspects or features of quality. They provide a way to measure and manage the quality of data and information. This section introduces you to the data quality dimensions and explains why they are important. Detailed instructions for assessing each dimension are found in Chapter 3 as part of The Ten Steps process in Step 3—Assess Data Quality. Each data quality assessment aligns with a dimension of quality (e.g., Data Integrity Fundamentals, Duplication, or Accuracy).
![]() Definition
Definition
A data quality dimension provides a way to measure and manage the quality of data and information.
![]() Key Concept
Key Concept
During a data quality project, you will choose to measure the data quality dimensions that best address your business needs.
Reasons for Data Quality Dimensions
Each data quality dimension requires different tools, techniques, and processes to measure it. This results in varying levels of time, money, and human resources to complete the assessments. You can better scope your project by understanding the effort required to assess each of the dimensions and choosing the ones that fit your needs. Initial assessment of the data quality dimensions results in setting a baseline. Additional assessments can be built into your operational processes as part of ongoing monitoring and information improvement.
Differentiating the dimensions of quality will help you
- Match dimensions against a business need and prioritize which assessments to complete first.
- Understand what you will (and will not) get from assessing each dimension.
- Better define and manage the sequence of activities in your project plan within time and resource constraints.
Data Quality Dimensions Defined
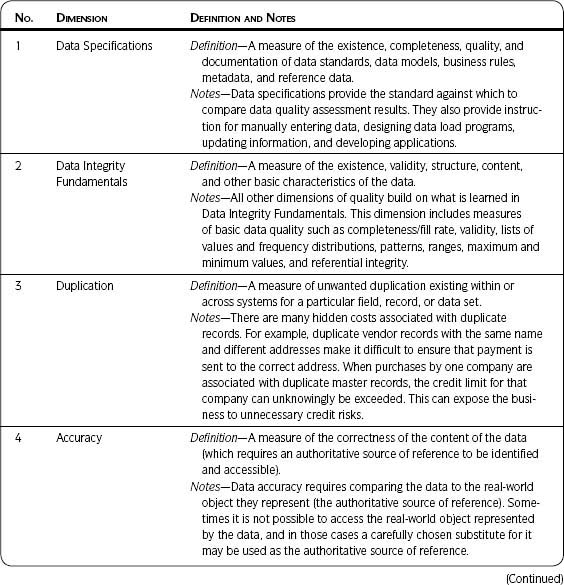
Each of the data quality dimensions is defined in Table 2.2.
Table 2.2 • Data Quality Dimensions

Data Quality Dimensions Work Together
You should choose the dimensions most meaningful to your situation, but it is often hard to know how to begin. Following are a few recommendations to get you started.
If you are not sure where to start your data quality efforts, the dimension of Perception, Relevance, and Trust can provide insight into issues by surveying the knowledge workers (the information customers) and getting their point of view. Use those results to articulate the business problem and prioritize your data quality efforts.
If you already have some idea of your data quality issues, you can use any prioritization technique with which you are familiar to agree on your business needs. Once the business needs and high-priority issues have been determined, assess the data based on the recommendations outlined next.
Data Specifications are important because they provide the standard against which to compare the results of the other data quality dimensions. Collect, update, and/or document the applicable Data Specifications (data standards, data models, business rules, metadata, and reference data) as early as possible. If you don’t have the Data Specifications at first, at some point in time you will have to get them.
Once you are clear on your business issues and the related data, I strongly recommend Data Integrity Fundamentals as one of the first dimensions to assess. If you don’t know anything else about your data, you need to know what you learn from that dimension because it provides a snapshot of data validity, structure, and content. This assessment provides facts about data and lets you see where the problems are and the magnitude of those problems.
All other dimensions of quality build on what is learned from the Data Integrity Fundamentals. It is tempting to skip this dimension because others may seem more important. For example, if your major concern about data quality is duplicate records, you may want to jump to the Duplication dimension and skip Data Integrity Fundamentals. However, the algorithms developed in Duplication, which determine the uniqueness of a record, are based on combinations of data elements. If the input is incorrect—if those data elements do not actually contain data (e.g., have a low fill rate) or do not contain the data expected (e.g., a Social Security Number in a phone number field)—or if the quality of the data is poor (e.g., incorrect values in a state field), then the output of your de-duplication process will be incorrect. It is through Data Integrity Fundamentals that you can see the actual content of those data elements.
I learned this lesson years ago. The business was concerned about duplicates, so we went straight to determining what combination of data elements indicated a unique record. That information was critical in configuring the algorithms and thresholds for the software used to identify duplicates. We could not get valid results when trying to find duplicate records, so we went back and assessed Data Integrity Fundamentals and found that one of the fields we “knew” was essential for indicating uniqueness only had a 20 percent fill rate. That is, only 20 percent of the records had a value in that field. No wonder we could not get good results in identifying duplicates!
Once you have completed Data Integrity Fundamentals (at the appropriate level of detail for your project), choose from the other dimensions based on your business need. For example, Consistency and Synchronization can use the same techniques used in Data Integrity Fundamentals—just use them on multiple data sets and compare results. Timeliness and Availability link closely to Consistency and Synchronization, by adding the time element to the assessment. To determine decay rates in Data Decay, you may be able to do some additional calculations on create dates and update dates after you complete the Data Integrity Fundamentals or an assessment of Accuracy. You may look at Coverage and determine that some of the issues there are the result of problems with Ease of Use and Maintainability. You may look at Presentation Quality as an aspect that relates to most of the other dimensions.
Key Considerations for Choosing Data Quality Dimensions
Here are the key considerations for choosing the data quality dimensions to assess:
Should I assess the data?
– Only spend time testing when you expect the results to give you actionable information related to your business needs.
Can I assess the data?
– Is it possible or practical to look at this quality dimension?
– Sometimes you cannot assess/test the data, or the cost to do so is prohibitive.
- Only assess the dimensions if you can say YES to both questions.
- Once a data quality dimension has been assessed, the assessment results should drive improvement activities.
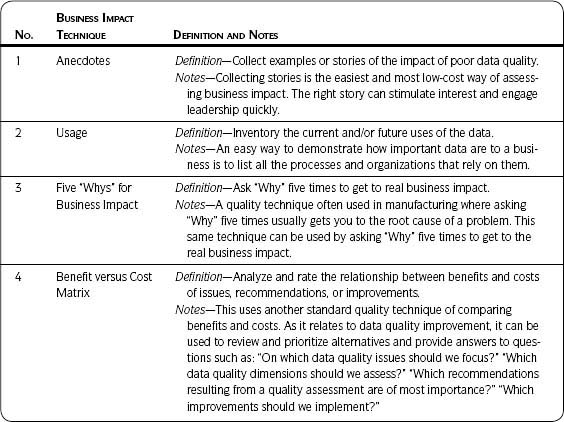
Business Impact Techniques
Business impact techniques are used to determine the effects of data quality on the business.
They include both qualitative and quantitative measures and also methods for prioritizing.
Whenever a data quality problem is found, the first two words usually spoken by management are “So what?” Management wants to know, “What impact does this have on the business?” and “Why does it matter?” Another way of saying it is, “What is the value of having information quality?” These are important questions. After all, no one has the money to spend on something that is not worthwhile. The business impact techniques help answer those questions and are the basis for making informed investment decisions for your information resource.
Business impact focuses on how the information is used—such as completing transactions, creating reports, making decisions, running automated processes, or providing an ongoing source of data for another downstream application such as a data warehouse. Information uses are part of the Apply phase of the Information Life Cycle POSMAD. (See The Information Life Cycle section on page 23.)
Details of the various business impact techniques are described as part of The Ten Steps process in Step 4—Assess Business Impact. Each business impact assessment aligns with a business impact technique (e.g., anecdotes, usage, or process impact).
![]() Definition
Definition
Business impact techniques use qualitative and quantitative measures for determining the effects of data quality on the business.
![]() Key Concept
Key Concept
Data governance expert Tom Carlock has a nice way of expressing why knowing value is important: Value Assures Love and Understanding from Executives.
Reasons for Business Impact Techniques
Results from the business impact techniques help make the usually intangible aspects of data tangible and meaningful to those who have to make tough investment decisions. Business impact is another way of expressing the idea that there is value in having quality information. It is only by showing business impact that management can understand the value of information quality. Use results from assessing business impact to
- Establish the business case for information quality.
- Gain support for investing in information quality.
- Determine the optimal level of investment.
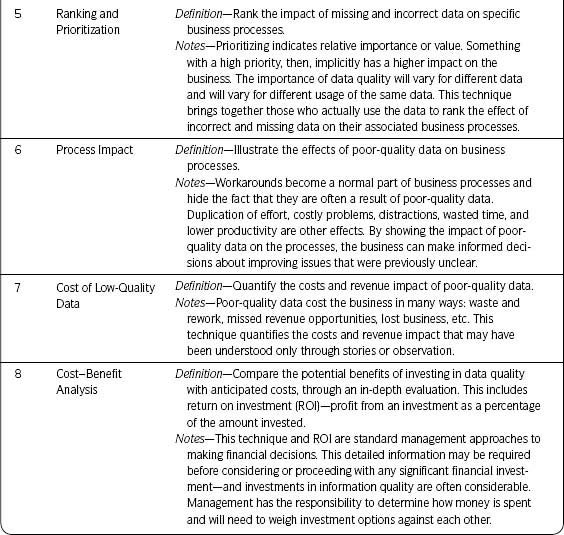
Table 2.3 defines each of the business impact techniques.
Table 2.3 • Business Impact Techniques Defined
Business Impact Techniques Work Together
Figure 2.9 shows a continuum with the relative time and effort to determine business impact for each technique, from generally less complex and taking less time (Technique 1 from Table 2.3) to more complex and taking more time (Technique 8 from Table 2.3).
The importance of being able to show business impact cannot be stressed enough. It is essential to getting any kind of support—be it time, resources, money, expertise, or anything else. What I want you to understand is that you can show business impact in a variety of ways. It does not always have to take the form of a comprehensive and time-consuming cost-benefit analysis or ROI (Technique 8). Much can be learned through other techniques that require less effort but can still provide enough information to make good decisions.
The techniques don’t stand alone. You can easily combine ideas from the various techniques to show business impact. For example, an anecdote can be effective even without quantitative data (Step 4.1—Anecdotes), but you can expand on some aspect of your anecdote and bring in quantitative information as your time permits. As you assess impact using other techniques, learn how to quickly tell a story using the facts and figures you have collected.
You may complete a list of the various business processes, people, and/or applications that use data (Step 4.2—Usage) and then employ Step 4.6—Process Impact to visualize the impact of poor-quality data for one or two specific business processes. Further, you may employ the techniques in Step 4.7—Cost of Low-Quality Data to quantify the costs associated with those few business processes. Once you have a list of how the data are used, you can draw on Step 4.4—Benefit versus Cost Matrix or Step 4.5—Ranking and Prioritization to determine where to focus your data quality efforts.
Once you have been able to describe business impact through Step 4.3—Five “Whys” for Business Impact you can use other techniques to focus on that area to further quantify or visualize impact.
Sometimes a full cost–benefit analysis is required (Step 4.8—Cost–Benefit Analysis). It is relatively easy to gather costs (training, software, human resources, etc.). The difficult piece as it applies to data is showing the benefit. You can draw on all of the previous techniques to help you do this. For example, even though in Step 4.7 we express the output as cost of poor-quality data, it can also be phrased as the benefit from having high-quality data. Use applicable results as input to the benefit portion of your cost-benefit analysis.
Key Considerations for Choosing Business Impact Techniques
Use the business impact techniques that best fit your situation, time, and available resources to complete the assessment. Consider the following suggestions when choosing techniques.
Remember, the continuum shows relative effort, not relative results—Less complex does not mean less useful results, nor does more complex mean more useful results. The reverse is also true—less complex does not necessarily mean more useful results, nor does more complex necessarily mean less useful results.
That said, it is usually a good practice to start easy and move to the more complex as needed—Almost everyone has some story to tell—they experienced it themselves or heard it from others. Something prompted you to start dealing with data quality, and that something is usually found in a situation that can be summarized and retold as an anecdote. Continue to quantify as you are able.
Determine who needs to see the business impact and for what purpose—If you are describing business impact to a business analyst or subject matter expert for the purpose of gaining their willing participation on a data quality project, then a full cost–benefit analysis is overkill. If you are just in the stage of raising awareness about data quality, anecdotes or usage may be enough. If you have progressed to the point of getting budget approval, your financial approval process may require the more time-consuming quantification techniques. But even at this stage, don’t ignore the power of the other techniques.
Ask yourself if it is possible or practical to assess business impact using a particular technique with the time and resources you have available—It may be better to employ a technique against a focused scope such as a few processes or a single data set rather than to do nothing at all.
You need to show enough business impact (within a reasonable time period, using available resources) to take action and make good investment decisions—that requires some experience and experimenting to get the right balance. So use your best judgment to focus your efforts with the time and resources at hand, start moving, and adjust your approach if needed later.
Data Categories
Data categories are groupings of data with common characteristics or features. They are useful for managing the data because certain data may be treated differently based on their classification. Understanding the relationship and dependency between the different categories can help direct data quality efforts. For example, a project focused on improving master data quality may find that one of the root causes of quality problems actually comes from faulty reference data that were included in the master data record. By being aware of the data categories, a project can save time by including key reference data as part of its initial data quality assessments. From a data governance and stewardship viewpoint (see section on this topic, pages 52–54), those responsible for creating or updating data may be very different from one data category to another.
Data Categories Example
Your company, Smith Corp., sells widgets to state and federal government agencies, commercial accounts, and educational institutions. ABC Inc. wants to purchase four Blue Widgets from you. ABC Inc. is one of your commercial customers (identified as Customer Type 03) and has been issued a customer identifier number of 9876. The Blue Widget has a product number of 90-123 and its unit price depends on customer type. ABC Inc. purchases four Blue Widgets at a unit price of $100 each (the price for a commercial customer) for a total price of $400. Figure 2.10 illustrates that transaction.
When the agent from ABC Inc. calls Smith Corp. to place an order, the Smith Corp. customer representative enters ABC Inc.’s customer number in the sales order transaction. ABC Inc.’s company name, customer type, and address are pulled into the sales order screen from its customer master record. The master data mentioned are essential to the transaction. When the product number is entered, the product description of “Blue Widget” is pulled into the sales order along with a unit price that has been derived based on the customer type. Therefore, the total price for four Blue Widgets is $400.
Let’s look at the data categories included in this example. We have already mentioned that the basic customer information for ABC Inc. is contained in the customer master record. Some of the data in the master record are pulled from controlled lists of reference data. An example is customer type. Smith Corp. sells to four customer types, and the four types with associated codes are stored as a separate reference list. Other reference data associated with this customer’s master record (but not shown in the figure) are the list of valid U.S. state codes, which is used when creating the address for ABC Inc. An example of reference data needed for the transaction but not pulled in through the master data are the list of shipping options available (also not shown in the figure).
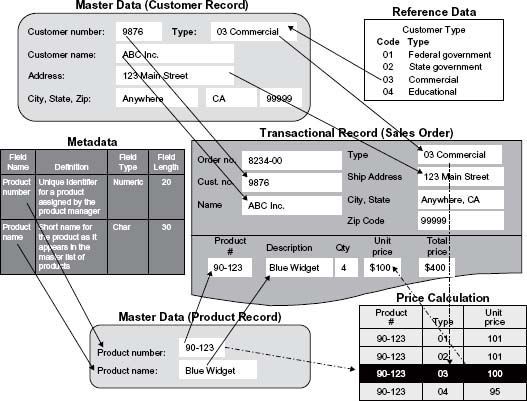
Figure 2.10 • An example of data categories.
Note: Thanks to Bruce Burton for the original inspiration behind this figure. Copyright © 2005–2008 Danette McGilvray, Granite Falls Consulting, Inc.
Reference data are sets of values or classification schemas that are referred to by systems, applications, data stores, processes, and reports, as well as by transactional and master records. Reference data may be unique to your company (such as customer type), but can also be used by many other companies. Examples are standardized sets of codes such as currencies defined and maintained by ISO (International Standards Organization). In our example, the price calculations further emphasize the importance of high-quality reference data. If the code list is wrong, or the associated unit price is wrong, then the incorrect price will be used for that customer.
Why have the customer record and product record been classified as master data? Master data describe the people, places, and things that are involved in an organization’s business. Examples include customers, products, employees, suppliers, and locations. Gwen Thomas created a ditty sung to the tune of “Yankee Doodle” that highlights master data:
Master data’s all around
Embedded in transactions.
Master data are the nouns
Upon which we take action.6
In our example, Smith Corp. has a finite list of customers and a finite list of products that are unique to and important to it—no other company will be likely to have the very same lists. While ABC Inc. is a customer of other companies, how its data are formatted and used by Smith Corp. is unique to Smith Corp. For example, if Smith Corp. only sells to companies within the United States, it may not include address data (such as country) needed by other companies that sell outside of the United States and that also sell to ABC Inc. Addresses would be formatted differently within those companies to take international addresses into account. Likewise, Smith Corp.’s product list is unique to it, and the product master record may be structured differently from other companies’ product masters.
The sales order in the example is considered transactional data. Transactional data describe an internal or external event or transaction that takes place as an organization conducts its business. Examples include sales order, invoice, purchase order, shipping document, and passport application. Transactional data are typically grouped into transactional records that include associated master and reference data. In the example, you can see that the sales order pulls data from two different master data records. It is also possible that reference data specific to the transaction are used—so not all reference data have to come through the master record.
Figure 2.10 also illustrates metadata, which literally means “data about data.” Metadata label, describe, or characterize other data and make it easier to retrieve, interpret, or use information. The figure shows documentation defining the fields in the product master record along with the field type and field length. Several kinds of metadata are described in Table 2.4.
Metadata are critical to avoiding misunderstandings that can create data quality problems. In Figure 2.10, you can see in the master record that the field containing “Blue Widget” is called “Product Name,” but the same data are labeled “Description” in the transactional record screen. In an ideal world, the data would be labeled the same wherever they are used. Unfortunately, inconsistencies such as the one in the figure are common and often lead to misuse and misunderstanding. Having clear documentation of metadata showing the fields (and their names) that are actually using the same data is important to managing those data and to understanding the impact if those fields are changed, or if the data are moved and used by other business functions and applications.
Data Categories Defined
Table 2.4 includes definitions and examples for each of the data categories discussed previously. These definitions were jointly created by the author of this book and Gwen Thomas, president of the Data Governance Institute.
Table 2.4 • Definitions of Data Categories
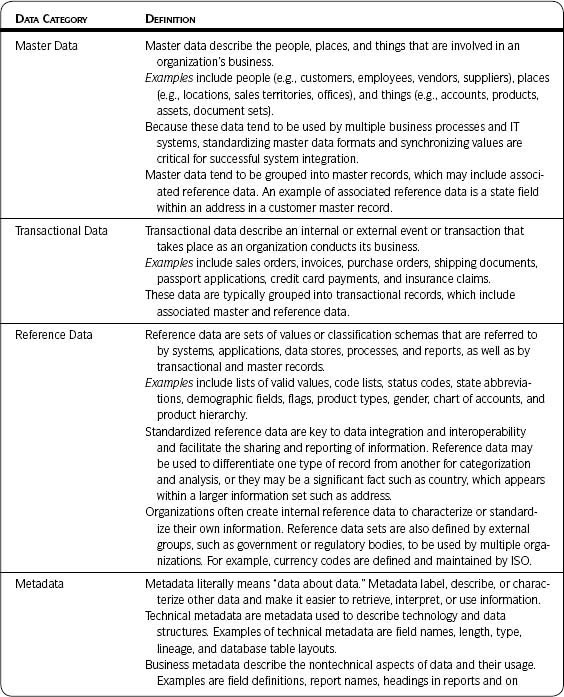

Your data may be categorized different from what the table describes. For example, some companies combine reference data and master data categories and call them master reference data (MRD). Sometimes it is difficult to decide whether a data set, such as a list of valid values, is only reference data or is also metadata. It has been said that one person’s metadata is another person’s data. No matter how data are categorized, the important point is that you are clear on what you are (and are not) addressing in data quality activities. You may find that such data quality activities should include data categories not considered previously.
Relationships between Data Categories
Figure 2.11 shows the associations between the various data categories. Note that some reference data are required to create a master data record and that master data are required to create a transactional record. Sometimes reference data specific to transactional data (and not pulled in through the master records) are needed to create a transactional record. Metadata are required to better use and understand all other data categories. From an historical data point of view, corresponding reference data may need to be maintained along with the master and transactional records; if not, important context and the meaning of the data may be lost. Auditors will want to know who updated the data and when—for all categories of data. That is why audit trail data are a part of metadata.

Data Categories—Why We Care
It is easy to see from the examples just given that the care given to your reference data strongly impacts the quality of your master and transactional data. Reference data are key to interoperability. The more you manage and standardize them, the more you increase your ability to share data across and outside of your company. The significance of an error in reference data has a multiplying effect as the data continue to be passed on and used by other data.
The quality of master data impacts transactional data, and the quality of metadata impacts all categories. For example, documenting definitions (metadata) improves quality because it transforms undocumented assumptions into documented and agreed-on meanings so the data can be used consistently and correctly.
As mentioned previously, your company’s data are unique (master product, vendor, customer data, etc., reference data, metadata). No other organization will be likely to have the very same data list. If correct and managed conscientiously, your data provide a competitive advantage because they are tuned for your company needs. Imagine the cost savings and revenue potential for the company that has accurate data, can find information when needed, and trusts the information found. Quality must be managed for all data categories in order to gain that competitive advantage. Of course, you will have to prioritize your efforts, but consider all the data categories when selecting your data quality activities.
![]() Definition
Definition
The term data specifications is used in this book to include data standards, data models, business rules, metadata, and reference data.
Data Specifications
Specifications provide the information needed to make, build, or produce something. The term “data specifications” is used in this book to include data standards, data models, business rules, metadata, and reference data. Data specifications can be used when building applications to ensure data quality from the beginning and to provide conditions against which to determine the level of data quality in existing applications. They provide important guidance in the same way that an architect’s drawings, electrical diagrams, and other plans specify how to build a house or what should be included in it. An introduction to each of the five data specification types (data standards, data models, business rules, metadata, and reference data) follows. There are several books available on any of these types for those who would like more in-depth information.
![]() Definition
Definition
Data standards are rules and guidelines that govern how to name data, how to define it, how to establish valid values, and how to specify business rules.
Data Standards
The preceding box contains a definition provided by Larry English from the glossary on the IAIDQ website (http://www.iaidq.org/main/glossary.shtml). Examples of standards include:
Naming Conventions for Tables and Fields—An example of a naming convention is: if the data in the field contain names, the column name should include the standard abbreviation “NM” along with a descriptive word for the name type—for example, “NM_Last” or “NM_First.”
Data Definitions and Conventions for Writing Business Rules—You may have a standards document that describes the minimum set of information to be defined for each field—for example, each field must be documented in the data dictionary; documentation must include the field name, description, example of data content, whether the field is mandatory or optional, and a default value (if one exists).
Establishing, Documenting, and Updating Lists of Valid Values—It is important to agree on the values that are valid for any given field. Sometimes the valid value list is developed internally, and sometimes you may use an external standard list. In any case, there should be a process that outlines how changes are made to the list and who is involved in those decisions.
Commonly Accepted Reference Values for Classification and Categorization—For example, NAICS, the North American Industry Classification System, was developed by the United States in cooperation with Canada and Mexico as the standard for use by federal statistical agencies in classifying business establishments. Use of the standard allows for a high level of comparability in business statistics among the three countries. NAICS was adopted in 1997 to replace the old SIC (Standard Industrial Classification system).7
This example illustrates the impact of standards on data quality: If your company was using the SIC system, did it change to NAICS? What is the standard being used now? If NAICS is being used, were all data in the company updated from SIC to NAICS? How were existing SIC codes mapped and changed to NAICS? The NAICS codes can also be used as an example of reference data. The code list comprises the valid sets of values (reference data), but it is also the standard by which business establishments are classified.
Choice of Notation and Modeling Method for Data Modeling—Each data modeling method has a different emphasis and the methods are approximately interchangeable—but not quite. The modeling notation used should be based on your objective.
Data Models
A data model is a way of visually representing the structure of an organization’s data. It is also a specification of how data is to be represented in a database—which data will be held and how they will be organized. As Simsion and Witt note in Data Model Essentials: “No database was ever built without at least an implicit model, just as no house was ever built without a plan” (2005, p. xxiii).
![]() Definition
Definition
A data model is a way of visually representing the structure of an organization’s data. It is also a specification of how data are to be represented in a database.
The data model graphically reflects the way data are organized—and the more explicit the model the better as far as data quality is concerned. In managing data quality, it is important to understand the database that contains the data and the programs that capture, store, maintain, manipulate, transform, delete, and share them.
The terms entity and attribute are central concepts in data modeling. An entity is a person, place, event, thing, or concept that is of interest to the business. An entity class, also called an entity type, is a set of those things whose instances are uniquely identifiable. (Entity classes are often loosely referred to as entities.) An attribute is the definition of a characteristic, quality, or property of an entity class.8 For example, “Person” and “Organization” are examples of an entity class; “John Doe” and “Smith Corp.” are examples of an entity; and “First Name” and “Last Name” are attributes of “Person.”
There are multiple notations for data models, but they all use a rectangular box with rounded or square corners to represent an entity class, and a line to represent a relationship between two entity classes. Notations differ in how they represent a relationship’s
- “Cardinality”—how many instances of one entity class can be related to an instance of another entity class: zero, one, or many; for example, a company can have one or many Addresses.
- “Optionality”—whether an instance of one entity class exists, or whether it is necessary for there to be an instance of a related entity class; for example, “A Company must have at least one Address.”
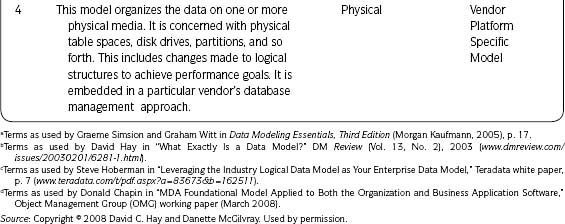
As stated before, a data model is a way of visually representing the structure of an organization’s data. The view may be from various approaches. The terms most commonly used are “conceptual,” “logical,” and “physical” and there are multiple definitions for each. Table 2.5 (see pages 48–49) compares and describes those terms as used by three of the several different approaches.
In the first approach, the term conceptual model refers to a comprehensive view of the organization in detail. The term logical model is specific to a data management technology (such as a relational database or XML), and the term physical model describes the technology in detail (in terms of such things as table spaces, and partitions).
The second approach uses conceptual model to describe a high-level overview and logical model to describe the business. The third approach, sponsored by the Object Management Group (OMG), simply distinguishes between models that are independent of the technologies that are used to implement them and those that are specific to such technologies.
People disagree on the terminology used in Table 2.5 for the various levels of data models. It is not the purpose of this book to discuss the merits of the three approaches. It is only important to know that differences exist so when you are discussing data models and the terms are used, you can ask about and understand the definitions that apply in your environment.
Whichever terms are used, it is important to distinguish between (1) the viewing of data structures in casual terms, (2) the viewing of the fundamental structure of your data (and through that the fundamental structure of your business), and (3) the viewing of data structures that are based on technological constraints. The latter will change frequently. It is only by maintaining a solid understanding of the nature of the data you use that you will be able to rise above such changes and respond instead to changes in your business.
Among other things, a data model can serve as a platform for discussing—and ultimately determining—a system’s scope. Separately, processes can be documented to show where they can or cannot be supported because the data do or do not exist. For the most part, business rules cannot be documented on a data model; however, they should be documented in conjunction with one.
A good data model combined with documentation of constraints at every project life cycle level of execution—database design, application interaction, and accessibility—will help produce high-quality, reusable data and prevent many postproduction data quality problems, such as redundancy, conflicting data definitions, and difficulty in sharing data across applications.
Business Rules
Ron Ross, known as the “father of business rules,” describes business rules thus: “Rules serve as guides for conduct or action. Rules provide criteria for making decisions.”9
![]() Definition
Definition
A business rule is an authoritative principle or guideline that describes business interactions and establishes rules for actions and resulting data behavior and integrity.
Table 2.5 • Data Model Comparison

For data quality, you must understand business rules and their implications for the constraints on the data. Therefore, my definition of a business rule as it applies to data quality is this: “A business rule is an authoritative principle or guideline that describes business interactions and establishes rules for actions and resulting data behavior and integrity.” (An authoritative principle means the rule is mandatory; a guideline means the rule is optional.)
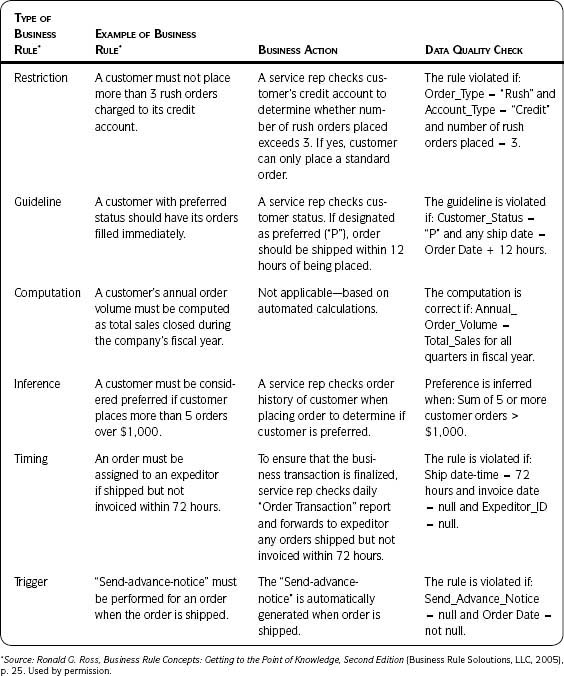
In his 2005 book Business Rule Concepts, Ron Ross presents samples of business rules and informally categorizes each one according to the kind of guidance it provides. The first two columns in Table 2.6 are from Ron’s book. The last two have been added to illustrate the business action that should take place and to provide an example of an associated data quality check.
The data are the output of a business process, and violations of data quality checks can mean that the process is not working properly or that the rule has been incorrectly captured. Collect business rules to provide input for creating necessary data quality checks and analyzing the results of the assessments. The lack of well-documented business rules often plays a part in data quality problems.
Table 2.6 • Business Rules and Data Quality Checks
Metadata
Metadata are often referred to as “data about the data”—an accurate but not particularly useful definition on its own. Metadata label, describe, or characterize other data and make it easier to retrieve, interpret, or use information. Metadata were discussed in the section Data Categories earlier in this chapter and are included here because they also specify data. Examples include descriptive information about the name given to a data field, definition, lineage, domain values, context, quality, condition, characteristics, constraints, methods of change, and rules.
![]() Definition
Definition
Metadata literally means “data about data.” Metadata label, describe, or characterize other data and make it easier to retrieve, interpret, or use information.
The two examples that follow help explain metadata:
Example 1—Suppose you want to buy a book from an online bookstore or find a book on the shelf in a brick-and-mortar store, but you can’t remember the complete title. You can look it up by entering the author’s name or the subject. Books matching the criteria will be listed on the screen. You are able to find the book you are interested in because of metadata.
Example 2—Suppose you go into the grocery store and all the cans on the shelf have an empty label. How do you know what is in them? The name of the product, the picture on the label, the distributor, the number of calories and the nutrition chart—all are metadata that describe the food in the cans. Imagine how difficult it would be to do your shopping without those metadata.10
Metadata are important because they
- Provide context for and aid in understanding the meaning of data.
- Facilitate discovery of relevant information.
- Organize electronic resources.
- Facilitate interoperability between systems.
- Facilitate information integration.
- Support archiving and preservation of data and information.
Refer to Table 2.4 for descriptions and examples of technical metadata, business metadata, and audit trail metadata.
Metadata can be found in physical data (contained in software and other media such as hardcopy documentation) and in the knowledge of people (such as employees, vendors, contractors, consultants, or others familiar with the company).
Reference Data
Reference data are sets of values or classification schemas that are referred to by systems, applications, data stores, processes, and reports, as well as by transactional and master records. An example of reference data is a list of valid values (often a code or abbreviation) that can be used in a particular field. Analyzing the list of values appearing in a data field, determining the frequency and validity of those values, and comparing them to associated reference data (usually stored in a separate table) are some of the most common data quality checks. (These checks come under the data quality dimension of Data Integrity Fundamentals. See Table 3.15 in Step 3.2 on page 123 for more information on this dimension.)
![]() Definition
Definition
Reference data are sets of values or classification schemas that are referred to by systems, applications, data stores, processes, and reports, as well as by transactional and master records.
For example, a list of valid values for gender could be M, F, or U, where M = Male, F = Female, U = Unknown.11 Domain values that are defined and enforced ensure a level of data quality that would not be possible if any value was allowed in a field. The NAICS codes previously discussed are also an example of reference data. For more information on reference data, see the Data Categories section earlier in this chapter.
Data Specifications—Why We Care
You cannot ensure information or data quality unless you also manage and understand the data specifications that are needed to make, build, use, manage, or provide your information. Use data specifications when building new applications (to help ensure data quality at the beginning) and to understand what constitutes data quality for assessment purposes in existing systems. Problems with data specifications are often the cause of poor data quality. In fact, the same techniques and processes presented in this book—most often applied to master and transactional data—should also be applied to reference data and metadata. For example, a metadata repository is just another data store that can be assessed for quality, and metadata have their own information life cycle, which needs to be managed to ensure quality.
Data Governance and Data Stewardship
You live in a typical neighborhood. You know most of the people who live there. Every household maintains its home according to its own preferences—some people mow the lawn once a week; others work in their yards on a daily basis. Now imagine that everyone on the street is packing their bags and leaving their homes. All the occupants of all the houses are moving in together!
![]() Definition
Definition
Data governance is the organization and implementation of policies, procedures, structure, roles, and responsibilities that outline and enforce rules of engagement, decision rights, and accountabilities for the effective management of information assets.
–John Ladley, Danette McGilvray, Anne-Marie Smith, Gwen Thomas
Each household brings its own ways of living, preferences, and attitudes. We can immediately see the potential for conflict. Certainly a different level of coordination and cooperation is required to live together productively and peacefully in the same house than was needed to live as neighbors in separate dwellings.
Any time your company integrates information, such as in an Enterprise Resource Planning (ERP) application or a data warehouse, it is as though all of the source systems—with their associated people, business processes, and data—are packing up and moving in together. Companies are living in a world that is much more integrated than it was in the past.
How are decisions to be made in this integrated world? In my house example, each family has its own room in one large home. Occupants of a particular room have the right to put down new flooring and decorate the way they want. However, none of them can change the plumbing or redecorate the living room (a common area for all) without the agreement of the others who live in the building. In some cases, the occupants can bestow authority on someone to make the plumbing and common-area decisions. They trust that person to make decisions for the benefit of everyone who lives in the building, and they expect to be informed of changes and to be able to raise any issues that need attention. There need to be roles, responsibilities, rules, and processes in place for managing the house. In other words, governance is required.
Data governance has been getting much attention lately. So has data stewardship. But what is governance? What is stewardship? And what do they have to do with data quality? It is outside the scope of this book to outline “how to do data governance.” But its importance to data quality requires at least a short discussion.
Data Governance versus Data Stewardship
Data governance ensures that the appropriate people representing business processes, data, and technology are involved in the decisions that affect them. Data governance provides venues for interaction and communication paths to
- Ensure appropriate representation.
- Make decisions.
- Identify and resolve issues.
- Escalate issues when necessary.
- Implement changes.
- Communicate actions.
![]() Definition
Definition
Data stewardship is an approach to data governance that formalizes accountability for managing information resources on behalf of others and for the best interests of the organization.
As noted in the previous box, data stewardship is an approach to data governance that formalizes accountability for managing information resources. I promote governance and the idea of stewardship as it relates to data and information, but I do not promote the use of “ownership.” Why?
A steward is someone who manages something on behalf of someone else. Owner has two different meanings according to the Encarta Dictionary: English (North America): (1) possession, emphasizing that somebody or something belongs to a particular person or thing and not to somebody or something else; (2) responsibility for, acknowledging full personal responsibility for something. Too often people act as if they “own” the data as in the first definition, which is counterproductive to the well-being of the organization. I do promote the use of “ownership” when it comes to business processes. Why?
Because it is usually used as in the second definition (i.e., to acknowledge full personal responsibility for something), and those with the authority do “own” the processes in that sense. But even though the business may “own” a process, anyone who touches the data in carrying out that process is their “steward.” That is, they have to manage the data not just to meet their own immediate needs but on behalf of others in the company who also use the data or information.
So stewardship is a concept and a way of acting. A data steward, on the other hand, can be the name of a particular role. There is no agreed-on set of responsibilities for a data steward and there can be different types of data stewards. Some assign that title to someone who is a subject matter expert or who fixes data at the application level. Others consider the data steward to be the person who is responsible for data names, definitions, and standards. Still others assign it a strategic role with responsibility for a data subject area across business processes and applications.
As mentioned before, it is outside the scope of this book to discuss “how to implement” data governance and stewardship. (Governance and stewardship are included in the FIQ as part of “Responsibility”—the second R in the RRISCC broad-impact components. See the section on the FIQ earlier in this chapter.) Therefore, what is important is that you do implement some level of data governance and stewardship; whatever roles, responsibilities, and titles are used, ensure they are meaningful and agreed on by those within the organization.
Data Governance and Data Quality
Data quality is often seen as a one-time project—”Fix the data and we’re done.” Even if there is awareness that data quality requires ongoing attention, the lack of formal accountability for the data is a critical component that causes many data quality initiatives to dwindle over time or fail completely. It is also the reason that many application development projects, once in production, cannot uphold the quality of data required by the business. Data governance is the missing link that provides the structure and process for making decisions about a company’s data. It ensures that the appropriate people are engaged to manage information throughout its life cycle. Implementing data governance and stewardship is important for the sustainability of data quality.
The Information and Data Quality Improvement Cycle
The Information and Data Quality Improvement Cycle, shown in Figure 2.12, provides an easy way to discuss and start thinking about improvement through three high-level steps: assessment, awareness, and action. It is a modification of the familiar “Plan-Do-Check-Act” approach,12 which allows organizations to identify and act on those issues or opportunities with the most impact on the business. The improvement cycle provides a structured approach to improvement that can be used by an individual or a team.
Assessment (looking at your actual environment and data and comparing them to requirements and expectations)
is key to
Awareness (understanding the true state of your data and information, impact on the business, and root causes)
which leads to
Action (prevention of future information and data quality problems in addition to correction of current data errors)
which is verified by
Periodic assessments. And so the cycle continues.
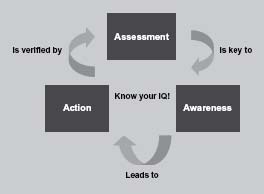
Figure 2.12 • The Information and Data Quality Improvement Cycle.
Source: Copyright © 2005–2008 Danette McGilvray, Granite Falls Consulting, Inc.
An Example of the Information and Data Quality Improvement Cycle
One company profiled the data that supported order management. Everyone “knew” there should be no open sales orders older than six months, but the data quality assessment showed open sales orders dating back several years—some older than the company itself. Financial exposure was potentially in the millions of dollars.
Because of that assessment, an investigation was launched. Some of the orders older than the company were explained as leftovers from the parent company, which the current company had left. It was found that report parameters in the Business Center were not set to catch old orders—there was no visibility to open orders older than six months, and reports used by customer service reps in the Business Center and by management contained conflicting information. In addition, they found root causes of the old orders—for example, various order management applications “talked” to each other, and during this “conversation” of sending data back and forth, flags could be missed, data could become corrupted, and so forth.
Based on this awareness, the action taken included manually closing orders in the order management system and moving to the order management history database, correcting report parameters to ensure visibility of open orders older than six months, and consolidating reports to make certain that the same information was sent to both managers and customer service reps.
So why was tracking older open sales orders so important? There was a financial impact to the company because the cost of manufacturing and selling the product or service had been incurred but the company had not been paid. And all this important work and resulting value to the company was triggered from a simple data quality assessment!
The Information and Data Quality Improvement Cycle and The Ten Steps Process
The Information and Data Quality Improvement Cycle is the basis for The Ten Steps process (see Figure 2.13). The Ten Steps process (for which an overview is provided in the next section) describes a set of methods for the continuous assessment, maintenance, and improvement of critical business information. Included are processes for
- Describing and analyzing the information environment.
- Assessing data quality.
- Determining the business impact of poor data quality.
- Identifying the root causes of data quality problems and their affect on the business.
- Correcting and preventing data defects through needed modifications to processes, people and organizational issues, and technology.
The Ten Steps are a concrete articulation of the Information and Data Quality Improvement Cycle. Like the cycle, they are iterative—when one improvement cycle is completed, start again to expand on the results.13 (See the next figure for an illustration of this relationship.)
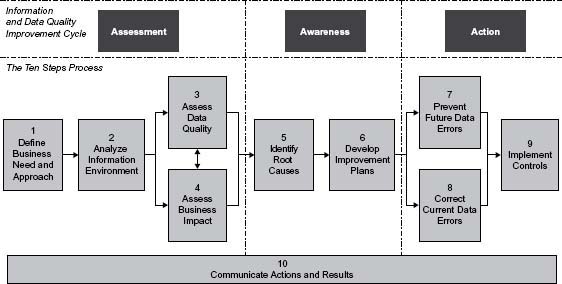
The Ten Steps Process
The Ten Steps process is an approach for assessing, improving, and creating information and data quality. The steps are illustrated in Figure 2.14 and described in the sidebar on the next page. Detailed processes and techniques for each of the steps can be found in Chapter 3.
The Ten Steps are concrete instructions for planning and implementing information and data quality improvement projects. Each step contains general principles, directions, advice, and examples. Steps 1 to 4 contain the essential techniques for defining the business need and assessing the current state of the data and information, as well as for communicating the importance of the current state to stakeholders. Step 5—Identify Root Causes is where the action begins—addressing the root cause and correcting errors, leading to improvement in both the data and the processes that produce them.
While the Ten Steps are represented by a linear progression from step to step, the process of information and data improvement is iterative—project teams can return to previous steps to enrich their work, they can choose those steps that meet the business need, and they can repeat the entire Ten Steps to support continuous information improvement. Communication is represented as a bar that runs under all of the steps and is critical for success and ongoing support throughout any project.
The Ten Steps were designed as a pick-and-choose approach where the applicable steps, activities, and techniques from the methodology can be applied at the appropriate level of detail to meet your needs.
For Information Quality–Focused Projects—such as a data quality assessment of a particular database and/or assessment of the business impact of an issue resulting from poor data quality. For the most sustained results, the goal should be to identify root causes and implement improvements. Your project may be looking at internally and/or externally acquired data.
The Ten Steps Process—Assessing, Improving, and Creating Information and Data Quality
- Define Business Need and Approach—Define and agree on the issue, the opportunity, or the goal to guide all work done throughout the project. Refer to this step throughout the other steps in order to keep the goal at the forefront of all activities.
- Analyze Information Environment—Gather, compile, and analyze information about the current situation and the information environment. Document and verify the information life cycle, which provides a basis for future steps, ensures that relevant data are being assessed, and helps discover root causes. Design the data capture and assessment plan.
- Assess Data Quality—Evaluate data quality for the data quality dimensions applicable to the issue. The assessment results provide a basis for future steps, such as identifying root causes and needed improvements and data corrections.
- Assess Business Impact—Using a variety of techniques, determine the impact of poor-quality data on the business. This step provides input to establish the business case for improvement, to gain support for information quality, and to determine appropriate investments in your information resource.
- Identify Root Causes—Identify and prioritize the true causes of the data quality problems and develop specific recommendations for addressing them.
- Develop Improvement Plans—Finalize specific recommendations for action. Develop and execute improvement plans based on recommendations.
- Prevent Future Data Errors—Implement solutions that address the root causes of the data quality problems.
- Correct Current Data Errors—Implement steps to make appropriate data corrections.
- Implement Controls—Monitor and verify the improvements that were implemented. Maintain improved results by standardizing, documenting, and continuously monitoring successful improvements.
- Communicate Actions and Results—Document and communicate the results of quality tests, improvements made, and results of those improvements. Communication is so important that it is part of every step.
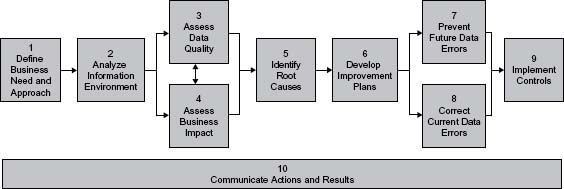
Figure 2.14 • The Ten Steps process.
Source: Copyright © 2005–2008 Danette McGilvray, Granite Falls Consulting, Inc.
For Integration into Other Projects and Methodologies—for example, any ERP migration, data warehouse, or other application development project will yield better results if data quality is addressed early in the project and built into the technology, processes, and roles/responsibilities that will be part of the system once in production. Steps within the methodology can also form a foundation to create your own improvement methodology, to integrate data quality activities into your company’s project life cycle, or to develop a standard process for managing externally acquired data.
For Use in Your Daily Work—where you are responsible for managing data quality or the work you do impacts data quality.
Best Practices and Guidelines
While the process flow for The Ten Steps shows a natural progression from step to step, realize that successfully applying the methodology takes an iterative approach. For example, project teams who are new to the quality improvement process often discover that the root causes of their issues found in Step 5—Identify Root Causes result in problems that are much more widespread than they had originally believed. Suddenly the scope of the problem broadens, and the original data quality dimension assessments seem inadequate. In this case, they can return to Step 3—Assess Data Quality and redo the assessment with a larger data set or choose another dimension to assess. Likewise, if the scope has broadened, they may have more information to use in a business impact technique (Step 4—Assess Business Impact) so that they can present the business issue and solicit more resource allocation.
The Ten Steps themselves are iterative—if a project team has made use of the applicable steps in one project, they can identify another business issue and start the improvement process again. Information quality improvement takes rework and rework—it requires a true continuous-improvement mindset to institute long-term change.
Another common scenario: It is not unusual for one project team to assess data quality and business impact, identify root causes, and develop specific recommendations for improvement. Yet it is a different team who can actually effect change and implement the improvements. A different project may be implemented that focuses just on the correction and prevention of data errors. Yet another team may be focused on implementing controls such as metrics and scorecards based on what was learned from the first team’s work.
The following are additional guidelines for best results when applying The Ten Steps process.
Use This Book—This guideline is so important that it is mentioned first. While you may not read the book cover to cover or apply it all at once, understand what is included so you can reference it when needed. Expect to cross-reference the various sections regularly and use the concepts when applying the Ten Steps. Become familiar with the Framework for Information Quality and the Information Life Cycle. Reference the sections on data quality dimensions, business impact techniques, and other key concepts in this chapter, and other tools and techniques in Chapter 5, as they are integral parts of the methodology.
Project Management—Executing The Ten Steps process successfully requires use of sound project management practices. A project is defined as any use of the methodology to address a defined business issue related to information—whether by a single person or a team, as a standalone data quality improvement project, or as data quality tasks integrated into another project or methodology (e.g., as a data migration project using a third-party methodology). Even if you are an individual, you can apply good project management practices in a much more abbreviated fashion than a project manager and team would need to.
Good Judgment and Your Knowledge—The Ten Steps process is not designed as a cookbook approach with exact directions that must be applied the same way each time in order to ensure success. Its best use requires good judgment, knowledge of your business, and creativity.
Pick and Choose—The Ten Steps process is designed to be flexible. Take a pick-and-choose approach to its use and execute only those steps applicable to your project. While you should thoughtfully consider each of the Ten Steps, use your judgment to choose which of the steps and activities apply to your situation.
Level of Detail—The level of detail required for each step will vary depending on the needs of the business. Look to the business issue or opportunity to determine what is relevant and focus there. Start at a high level and work to lower levels of detail only if useful. Use the following questions to help guide your decisions about the appropriate level of detail: (1) Will the detail have a significant and demonstrable bearing on the business issue? (2) Will the detail provide evidence to prove or disprove a hypothesis about the quality or business impact of the data?
Apply Appropriately—Most of the steps can be used in some way if the project is focused on data quality improvement (assuming you stay at the appropriate level of detail). Activities from the various steps can be used in conjunction with other projects, such as integrating data in a data warehouse or migrating data to an ERP. This allows appropriate integration of data quality tasks into existing project plans or other methodologies. Many activities can also be used by an individual responsible for data quality.
Iterative Approach—As additional information is uncovered throughout the process, earlier assumptions may need to be revisited and revised. For example, it may be found that more detail is required from a previous step. Return to those activities to gather the necessary information.
Scalability—The Ten Steps process can be used for everything from a one-person, few-week project to a several-month project with a multiperson team. The issue to be addressed, the steps chosen, and the level of detail needed greatly affect the length of time and the resources required. For example, a specific step could take one person two hours to complete while the same step used in a different project could take a project team two weeks.
Reuse (80/20 Rule)—Many times the process requires information already available within your company. It may be formally documented or simply known by those who work there. Supplement existing materials with original research only as needed. For example, expect that 80 percent of what is asked for in Step 2—Analyze the Information Environment already exists somewhere. The value of this step is in bringing together existing knowledge in such a way that you can understand it better than you did before and make better decisions because of it. Also, ensure that your discoveries, documentation, or updates are made available for reuse by other projects and teams.
Use Examples as a Starting Point—Be aware that the actual output of the steps may take a different form than the examples shown. For instance, the Sample Output and Templates in Step 2.4—Understand Relevant Processes show two different matrices as a way of relating the processes to the data. However, the output of the step is not a matrix; it is knowledge about the processes and related data, how they interact, and how that can impact data quality. Your output may take the physical form of a matrix, a diagram, or a textual explanation. The format used should enhance understanding, in this case, of the relationship and impact of the processes and data. It is the learning that comes out of completing the steps that is important. This applies to all steps.
Flexibility—Successful projects require the ability to deal with continuous change and to remain open to input from many stakeholders (both within and outside the project team.)
Focus on Processes—Focus on why the problems exist, not on who is making them. “Blame the process, not the people.”
Practice Makes Perfect—As with anything new, as you gain experience with the methodology (both concepts and process steps), subsequent uses of it will be easier and faster.
Tool Independent—The Ten Steps process does not require any particular vendor tool. However, there are tools on the market that can make your data quality job easier. For example, there are tools available to help with profiling, matching, parsing, standardization, enhancement, and cleansing of your data. Applying The Ten Steps process can help you more effectively make use of these tools.
Improvement Activities—Some of the improvement activities (root cause, prevention, and clean-up) can be implemented within the timeline and scope of your project. Others may generate additional activities or even separate projects.
Analyze and Document—Throughout the project be sure to capture in a central area the results of your analysis, suspected causes of issues you are finding, and suspected impact on the business. As you go through the project, you will learn more to prove or disprove your early assumptions.
Broad Data Management Perspective—Documenting your plans and results is an excellent way to enable you to retrace your steps and learn more about what worked during your improvement project. However, many information and data quality improvement projects happen in concert with company-wide improvements that may also involve change-management documentation. Keep informed by contacting other project leaders so that you can produce and share documentation with each other that you can all use to inform your projects.
1The Food Pyramid was developed by the Center for Nutrition Policy and Promotion, an organization within the U.S. Department of Agriculture (http://www.mypyramid.gov/).
2The Framework for Information Quality was developed independently of the Zachman Framework for Enterprise Architecture, but both address the same interrogatives.
3 Larry English, Improving Data Warehouse and Business Information Quality (John Wiley & Sons, 1999), pp. 200-209.
4 Many thanks to Larry English for teaching me about the universal resource life cycle (Plan, Acquire, Maintain, Dispose, Apply). I modified the names of the life cycle phases slightly from his original, added the “Store and Share” phase, and developed the acronym POSMAD as a reminder of the Information Life Cycle phases. He provided the examples for activities within each of the phases for financial, human, and information resources.
5Use of the POSMAD interaction matrix (see Figure 2.3, page 21) is another way of providing clarity.
6For entertainment and education, see www.datagovernance.com for other ideas that Gwen Thomas has set to familiar tunes.
7Source: NAICS Association, Questions and Answers (http://www.naics.com/faq.htm#q1).
8My thanks to David Hay for these definitions.
9From Ronald G. Ross, Business Rule Concepts: Getting to the Point of Knowledge, Second Edition (Business Rule Solutions, LLC, 2005), p. 76.
10From R. Todd Stephens, Ph.D. Used by permission.
11Some would point out that a list of gender values could also include such codes as M-F, meaning previously male, now female, or FM, meaning previously female, now male—with these values needing some type of associated date field for when the new gender took effect. In a medical setting this is critical information, but for the sake of simplicity and explanation only three codes have been included in the example. Still, this illustrates the fact that the values need to be discussed and agreed on, and must meet the needs of those using them.
12Plan-Do-Check-Act, or PDCA, is a basic technique for improving processes that was created by Walter Shewhart. It is also known as the Shewhart cycle or the Deming cycle (because W. Edwards Deming adopted it and introduced it in Japan).
13For those familiar with Six Sigma, The Ten Steps can also be understood using DMAIC. See the section The Ten Steps and Six Sigma in Chapter 5.