Integrated approaches
Abstract
Responses to climate changes caused by greenhouse gas emissions are discussed: rapid phasing out of fossil fuels, adaptation to a different climate, and moving toward ecological sustainability.
Keywords
Greenhouse warming mitigation; Sustainability; Renewable energy enhanced introduction
In preceding chapters, this book gives the background for renewable energy sources and describes their occurrence, devices for using them, and the role of renewable energy in current and future energy systems, depending on social values and the economic rules used to judge the viability of competing solutions. This concluding chapter discusses the status of renewable energy development in the context of current political focus, and generally gives the author’s personal evaluation of further development requirements, technically as well as institutionally.
8.1 Greenhouse warming mitigation
Climate impacts caused by human enterprise in general and human energy systems in particular are touched upon in several of the preceding chapters. The excess greenhouse warming caused by anthropogenic emissions related to fossil-fuel use has finally started to get political attention, after 50 years of scientific warnings (cf. sections 2.3 and 7.3). It was hoped that political intervention would be forthcoming before the damage became excessive, as in the case of ozone depletion by CFC-related gases, but this has not happened (presumably because energy provision has a much more influential role in society than spray-cans did, spanning from powerful financial interests to corporate enterprises of the energy industry). Depending on one’s political outlook, one may attribute the delay to politicians’ being marionettes in the hands of influential business interests or to politicians’ not daring to make significant changes in a sector of the economy that has decisive importance for the well-being of nations and their inhabitants.
8.1.1 Proposed fossil-fuel phase-out route
Recognizing that some countries refuse to set targets for limiting greenhouse gas emissions, and many other countries embrace this resistance by stating that they will not make reductions unless everyone follows suit, international climate negotiations are currently at an impasse, despite the minimal aims expressed at a recent COP21 Paris summit (finalized December 2015 with 180 country signatures; by May 2016, 22 of the required 55 countries had ratified the treaty; UN 2016; the United States and China in September agreed to ratify the agreement). However, there are no binding commitments for the 2°C warming limit and no implementation plan. Some years ago, I proposed a different approach that may be more appealing: to introduce a scheme based on automatically calculated reductions on a per capita basis. This would not require negotiated targets for each country or region and would not hinder the several populous countries that are embarking, or hope to embark, on a rapid route to industrialization, without compromising on reaching the stabilization goal before the end of the 21st century (Sørensen, 2008a). (The advantages of a per capita approach have been aired in connection with previous climate summits, but no political action has been pursued.) The approach is to calculate emission pathways for given levels of temperature stabilization by use of a simple model that is consistent with the circulation models and data sets surveyed by the Intergovernmental Panel on Climate Change. The allowable emissions would be detailed on a regional level and on individual country level.
The alternative to the per capita approach is individually decided, country-by-country CO2-emission targets, such as those recently suggested by the EU, which are bound to create problems, as concerns agreement, extendibility to the rest of the world, and probability of actually being carried through. Individual targets are based on factors like current economic situation and growth, and, to some extent, current use of renewable or nuclear energy. When noncompliance becomes evident, offenders will most likely offer excuses like “our economic growth was higher (or lower) than assumed in setting the targets” or “our targets were set too high in comparison with those of Romania.”
In contrast, the approach I propose is both simple and easy to understand, and therefore has a chance of working in the real world. It consists of introducing a common ceiling on per capita greenhouse gas emissions, along with optimal pathways allowing each country to reach the ceiling before a specified date. First, I select a model that allows calculation of the implications of various policies, with sufficient accuracy but without the long computing time of the general circulation models described in section 2.3.
The climate models reviewed by IPCC try to establish a connection between stabilization of the global temperature average (and other climate impacts) at a given level, the corresponding equilibrium concentration of greenhouse gases in the atmosphere, and allowable CO2 emissions and other climate-altering human activities that policies have to ensure in order to reach stabilization at the desired level. The general circulation models used in climate science proceed from given emissions to calculated atmospheric concentrations, from which temperature changes are determined. Thus, one would have to look at many calculations with specific emission assumptions in order to find those for which the average temperature reaches say 1.5°C above the year-2000 average temperature level (which translates to some 2.1°C above the pre-industrial level). They would require a stable 450 ppm level of CO2 in the atmosphere (≈500 ppm if other greenhouse gases are included), with the uncertainty induced mainly by model accuracy but also by the different residence time of different greenhouse gases and the changes in cooling associated with particulate emissions from industry or from volcanoes. It follows that anthropogenic emissions of greenhouse gases would have to be radically reduced (IPCC, 2007a-c). The reverse calculation from a given temperature stabilization to the implied allowable emissions profiles (emissions as function of time) is not unique but requires additional assumptions, such as mitigation costs and technology readiness, in order to allow the determination of an optimal path to stabilization.
Figure 8.1 shows global average stabilization routes calculated in terms of CO2 emission profiles of various policies for reaching a stable situation before year 2100, with average surface temperature increases in the range of 1.0°C to 2.5°C. These temperature rises are relative to year 2000, and the model assumes similar reduction in other greenhouse gases. The emissions in Fig. 8.1 are shown per capita, i.e., global emissions divided by global population for a given year. The historic data are those used by the IPCC, and the 21st-century values are calculated using the simple model called the Java Climate Model (Matthews, 2008). The model very well reproduces the results of earlier IPCC assessments and the results given in Fig. 8.1 are consistent with the simulations presented in Chapter 3 of IPCC (2007b). Detailed comparison with this or more recent IPCC reports is not possible because the IPCC reports only gives ranges of results for a selection of literature emission scenarios, whereas the present calculation determines the emissions leading to a particular level of warming dynamically by iterating the approach to stabilization.

The calculation uses a population development reaching 1010 by the end of the 21st century, as in the “B2” scenario from IPCC (2007b). The calculation behind Fig. 8.1 further assumes that per capita emissions converge toward a common value and reach it at, or shortly after, year 2100. The emission pathway to be followed by different regions of the world is depicted in Fig. 8.2, for the 1.5°C warming case of Fig. 8.1. The same pathway, presented on an individual country level year-by-year, can be downloaded from the Elsevier journal website in the Reference list in connection with Sørensen (2008a). The input data for the calculation take into account the varying ability of different economies to mitigate greenhouse gas emissions, and mitigation therefore starts a little earlier in the most technologically advanced regions.
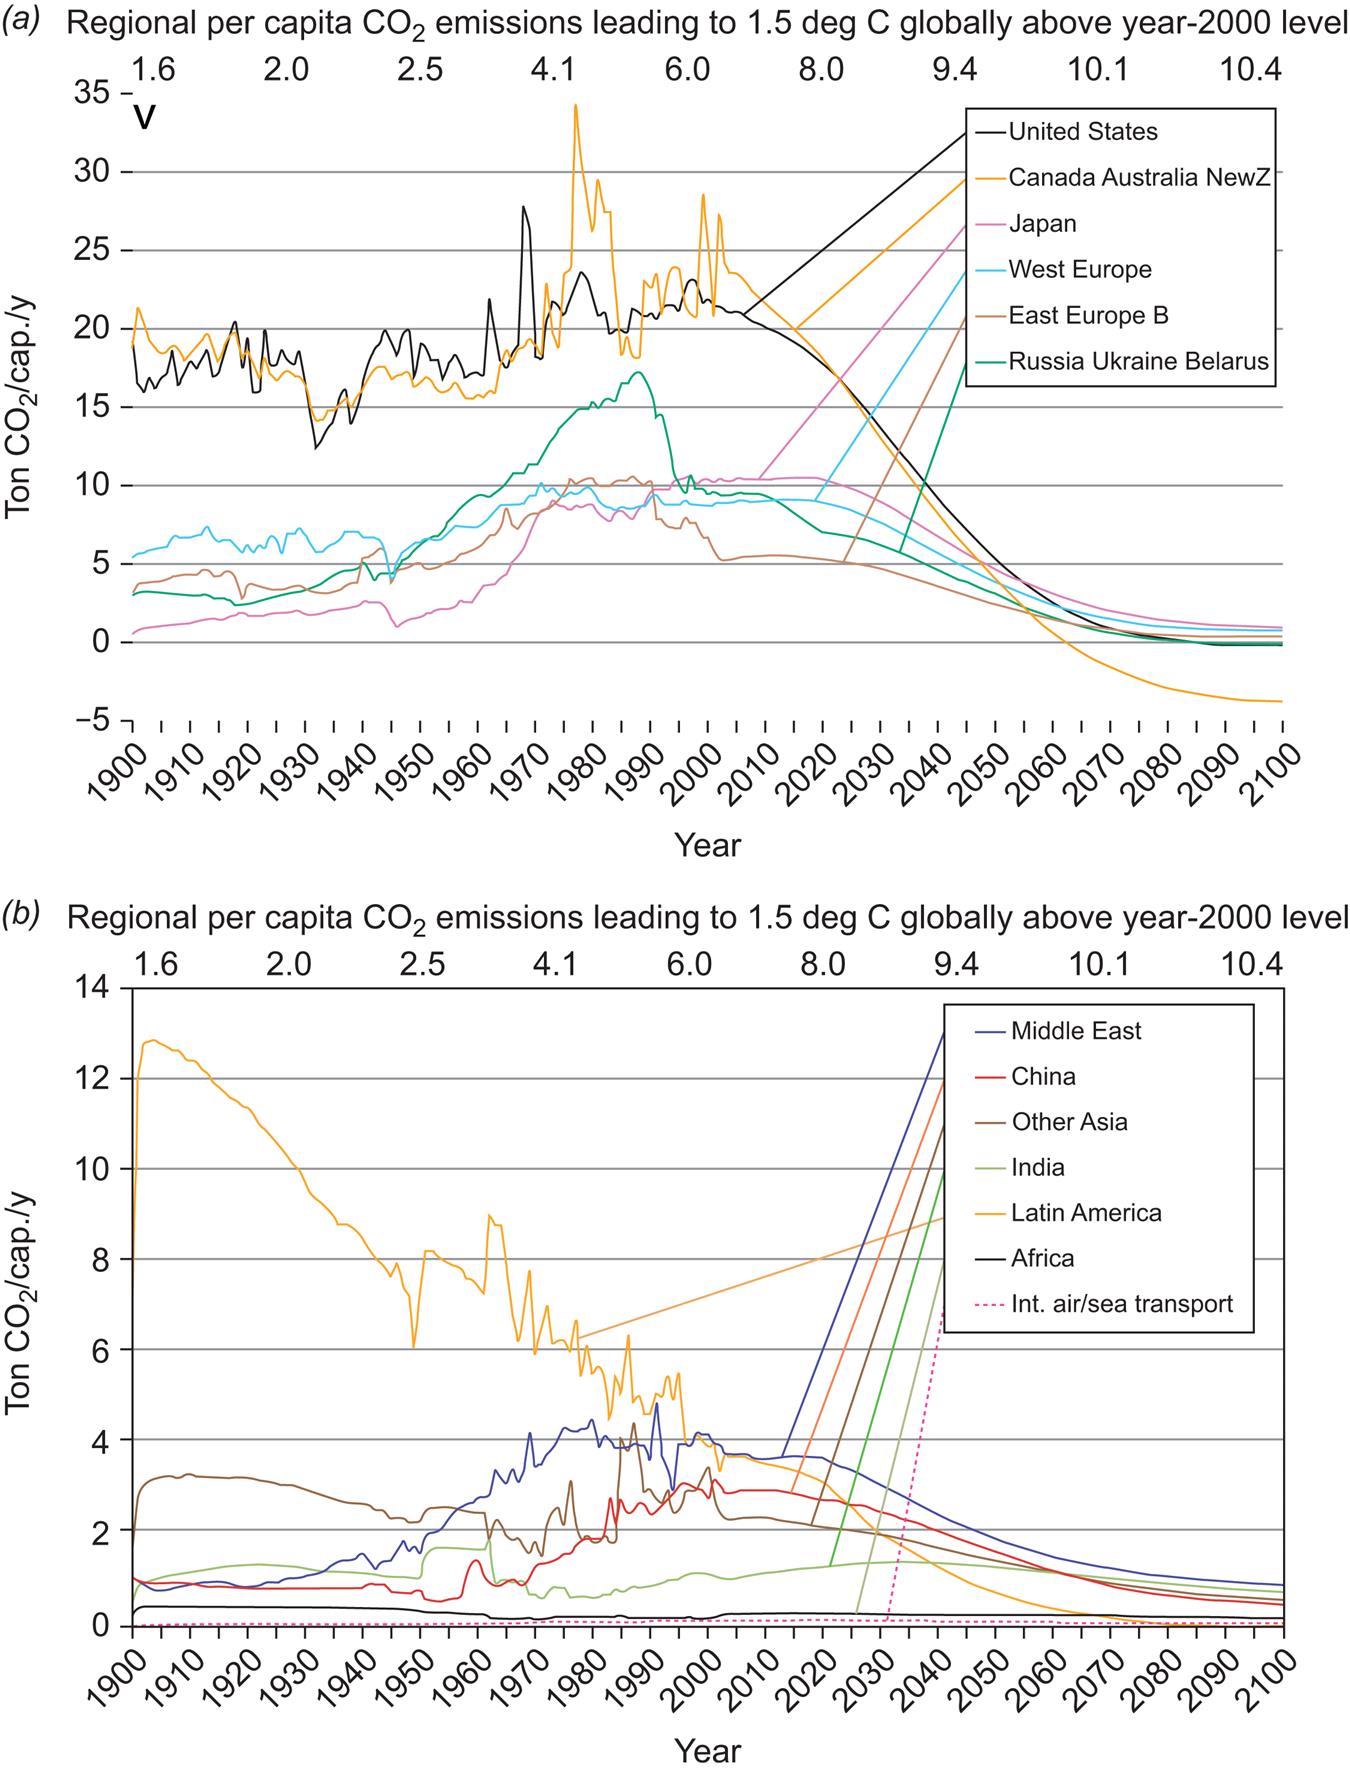
The stabilization corresponding to the 1.5°C case of Fig. 8.1 can thus be achieved by imposing the increasingly strict (as a function of time) per capita emission limits, as shown in Fig. 8.2 for each region of the world or for each country. The limits start at the current level of emissions and converge to the common goal value by the end of the 21st century. Legislation can be introduced in each country to impose the diminishing ceiling either individually or collectively. The time-integrated emissions on a regional basis are given in Table 8.1, but it would be wise to monitor compliance by requiring the sliding targets to be met by the end of each decade. If noncompliance is detected, a penalty (such as a trade embargo) could be implemented, provided that a penalty system has been agreed upon. The concurrent reduction of non-CO2 greenhouse gas emissions is shown in Fig. 8.3, for the 1.5°C case.
Table 8.1
Total allowable emissions for the entire 21st century and the number of years that the allowed CO2 emission of each region could continue at constant 2007 level, provided that it is reduced to zero after that time span (Sørensen, 2008a)
| Stabilization by 2100 at 1.5°C Above 2000 Level | Accumulated Emission Allowance 2000–2100 (Gt CO2) | Years to Zero CO2 Allowance at Constant 2007 Emissions |
| United States | 255 | 42 |
| Canada, Australia, New Zealand | 44 | 30 |
| Japan | 65 | 49 |
| Western Europe | 179 | 50 |
| Eastern Europe Ba | 34 | 49 |
| Russia, Ukraine, Belarus | 78 | 39 |
| Middle East | 161 | 79 |
| China | 250 | 64 |
| Other Asia | 155 | 76 |
| India | 183 | 144 |
| Latin America | 86 | 41 |
| Africa | 213 | 115 |
| International ship and air transportation | 80 | 95 |
| World | 1783 | 61 |
aFor countries included in “Eastern Europe B” see Matthews (2008).

Clearly, not only emissions from national activities (raw materials extraction, production, transport, and consumption) should be considered, but also emissions from international air and ship traffic. To include these emissions in the national emission budget of each country, which also includes the corresponding transport activity in its activity measure (such as GNP), is a straightforward extension of the current method of accounting in the international climate negotiations. It would substantially increase emission counts for countries with large shipping industries, such as Denmark, but would similarly show up as economic activity in GNP accounting. There are at least two other ways of allocating emissions: 1) to ascribe emissions to the financial owners of each activity, or 2) to ascribe the emissions to those using or benefiting from the product or service causing the emissions (along its life cycle). Providing data for these alternative accounting principles is more difficult than for the method currently in use, but not impossible, given the wealth of statistical data available (for option 1, emissions from enterprises would be distributed on shareholders according to country affiliation, while for 2, the emissions from production and transport would be distributed on the final consumers according to country or residence, as derived from trade statistics). Method 2 would increase emission allocations to countries outsourcing energy-intensive production to other parts of the world, and would decrease emissions for developing countries carrying out such energy-intensive production but exporting most of the products. The calculations presented here all use conventional accounting by country of performed activity.
8.1.1.1 Possible objections to the per capita approach
Looking at the historical part of the per capita emissions in Fig. 8.1, one notes that per capita emissions rose remarkably little during the 20th century, obviously due to the explosive growth of the world’s population and massive poverty in many parts of the world, with the associated smallness of per capita emissions. Population increase is a main reason for the lack of success in creating economic welfare for all the inhabitants of the world, and economic disparity has increased rather than decreased. Could rich countries use population growth to obtain a green light for continued high greenhouse gas emissions? The answer is that this does not seem to be possible even when the regional per capita emissions are used to regulate future emissions, as assumed in Fig. 8.2. Australia and countries in North America are already so high above their allocated emissions that they will have to use their technological skills to accomplish a rapid but realistic decrease in emissions, while less-developed countries initially have smaller per capita reductions prescribed for them. For these countries, there is also reason to use mitigating technology, because the current inefficient use of land and energy already leads to emissions above the target set for just a few years ahead.
Developing countries may complain that the scheme does not allow them to increase their emissions to American levels before doing something about the problem, but that is precisely the intent: they will move directly toward the stable situation without detours that may form bad habits clouding their future efforts. The proposed ceilings are proper and realistic because a country seeking high economic growth must invest in new equipment and processes anyway, and thus might as well choose the correct solution from the beginning. Furthermore, it is a mistake to think that the proper solutions are more expensive, because the expenses will have to be paid anyway and may be higher the longer one waits. It has also been suggested that long-industrialized countries should pay for the sins of the past (grandfathering, see section 7.3.3), but precise knowledge of the causes of global warming has been available for only about 40 years and the suggested scheme demands a very rapid mitigation from the rich nations anyway.
Would a scheme like the proposed one encourage developing nations to increase their population in order to get higher emission allowances? This is unlikely, because the greenhouse mitigation costs are small compared to the efforts needed to create economic welfare for more people. There is also no reason to compensate regions with lower than average population density, because it is usually a consequence of land areas’ being hard to populate (examples are Arctic or desert regions). In any case, avoiding overpopulation should be a primary target in any region of the world. Population stabilization must be a strong international priority, with efforts at least as serious as in the case of greenhouse gas emissions. The fact that, until now, food production growth has on average kept up with population increases (although not necessarily the distribution of food to all) does not mean that it will continue to be possible or environmentally sustainable (Friedlingstein, 2008). The emerging food crisis must be solved separately from greenhouse policy, and the solution includes increased emphasis on education that can lead to increased industrial wealth as well as better understanding of family planning. The per capita emission target does not make this more difficult.
The tradable emission permits envisaged by some current greenhouse abatement schemes would not be needed for the scheme suggested here. Tradable permits aim at having investments made in the order of increasing abatement cost and would typically move investments from the countries with large emissions to less developed nations, where the equipment installed may not be used properly and thus not achieve the proposed emission reductions. The time-scale on which greenhouse gas emissions have to be dramatically reduced is so short, that fiddling with the succession of investments is unimportant. Fossil-fuel resources must be phased out faster than dictated by depletion, which is particularly relevant for coal used without decarbonization. The high-emission countries have the skills and should reduce their own emissions as quickly as possible, which is exactly what the proposed scheme can accomplish. Tradable permits constitute an attempt to force the greenhouse problem into a framework of 19th-century liberal economic theory, assuming that the market will solve any and all problems. We know that this is not true, and the global warming damage is a perfect example of the need to base political action on more than antiquated economic dogmas.
8.2 Greenhouse warming adaptation
Several economists have addressed whether it is cheaper to let the impacts of global warming happen and then try to reduce the consequences (by adapting to the warmer world) than to avoid the impacts in the first place (by mitigation, such as replacing fossil fuels with renewable energy). This proposed “market trade-off” approach is flawed by the fact that changing the climate has very many types of impacts and it is far from certain that we have identified even the most important ones. Tol (2005) may be right that development aid could reduce the mortality rates for infectious diseases in Africa more than a few degrees’ warming will increase their death toll, but this disregards the uncertainty of what life conditions will prevail in a warmer climate with changed weather patterns, altered water balances, and thus the possibility of radically different conditions for agriculture. Similarly, damage caused by increases in ocean-water levels can be reduced by building higher dikes around low-lying areas (IPCC, 2007c), but the issues of dike failure and more frequent occurrence of extreme storm and tide combinations still have to be faced. Avoiding more greenhouse warming by introduction of efficient energy conversion systems and renewable energy is better than dealing with the consequences, because the latter may hold surprises that we have not yet been able to identify.
Arguments for the marginal cost advantage of adaptation as compared to abstract reference to mitigation appear even more suspect when one considers the energy efficiency measures not implemented. Several studies have shown that energy demands could be reduced by about a factor of four by efficiency measures fully available and costing less than the energy they displace, rendering exactly the same energy service to the user (cf. Chapter 6; Weizsäcker et al., 1997; Sørensen, 1982, 1992, 2008b). Reducing energy demand in this way without any cost increase has the same effect as a worldwide negotiated agreement to reduce greenhouse gas emissions by a factor of four. The cost of the first doubling of energy efficiency is far below what would have had to be paid for the energy saved, and only when demand is lowered 4- to 5-fold does the cost become comparable with that of providing the saved energy. In other words, governments should implement the regulation that will bring about improved energy efficiency. This can be done without any international agreement and has only positive effects on the national economy (reducing energy costs and at the same time supporting industry involved in the technical solutions for bringing about efficiency improvements), and the debate on mitigation versus adaptation is pushed some 50 years into the future.
8.3 Ecological sustainability
Ecological considerations are gaining an increased role in the manufacture of consumer products. Decades ago, ecological food and personal hygiene products (organic product. as they were called) were sold in specialty shops that charged a 100% or more premium for these exotic goods, which, moreover, were often produced by amateurs unable to ensure the products’ wholesomeness. Today, at least in Europe, ecological products go through a certification process that includes tests for the presence of pesticides and other unhealthy chemical compounds, and they are sold in any supermarket, at prices typically 10%–30% above those of their non-ecological counterparts. In several countries, ecologically grown food products have a market share of 20%–30%, and ecological health products (soap, skin creams, etc.), textiles, and furniture show a growing market penetration.
In the case of energy, utilities sell “green electricity” and gas stations offer biodiesel, but these are still surpassed in volume of energy by private installations of solar heat or power, shares in wind farms, biogas installations, and so on. Generally, this is a good start and signals an interest, but the enthusiasts willing to make such investments are still a minority, and for the majority, who would rather not think about energy, legislative measures that force nonpolluting energy sources into the general energy supply appear to be the best way to achieve penetrations approaching 100%. As mentioned in section 8.1, there will be opposition to such political intervention from vested interests wanting to maintain fossil-fuel and nuclear technologies as long as resource availability allows. In reality, there is no reason to make use of the last drop of oil when better solutions are available. It is appropriate here to make a few observations regarding whether the different renewable energy solutions are ready to take up a dominating place on the energy scene.
8.3.1 Status of renewable energy technologies
For hydropower, development is expected to be largely restricted to efforts to deal with its environmental and social impacts. This could lead to emphasis on smaller, cascading schemes, instead of the very large dam installations of the past. Still, the basic technology must be considered as fully developed, but because the cost of environmentally sound hydro schemes can be substantial, the global expansion rate of hydropower has slowed down. There are still possible new sites available, and if social acceptance can be regained after the disasters of the past (flooding the homes of hundreds of thousands people and destroying treasures of cultural heritage—as recently in Turkey and China), then environmentally integrated hydro could add a further substantial amount to the global renewable energy supply.
In the case of wind turbines, further development along current trends, particularly in materials, will allow somewhat larger horizontal-axis turbines to be built. Although other wind conversion techniques could become viable, the success of the horizontal axis is likely to keep it in a leading position. Adjustments in blade profile and regulation technology are likely to follow the widespread interest in offshore wind. Over the last few years, the design of different turbines for onshore and offshore installation has evolved. Still, there is the basic question of whether to optimize for maximum annual production, or to aim for more operating hours (but smaller annual total energy), typically because ways of handling intermittency (storage, power exchange; Sørensen, 2015) are considered too expensive to establish. But these concerns still involve only small adjustments to a technology already close to maturity. A main challenge for further increase in wind turbine size is improvement of materials, particularly for blades. Cost reduction of foundations, particularly relevant for offshore turbines, where foundation costs constitute a fairly large fraction of the total, are continuously being sought. Furthermore, as with any mature technology, continued small improvements in cost per produced kWh with time can be expected. In summary, current wind power technology is ready for the massive market expansion that is actually taking place in all the regions of the world identified as suitable (see Chapters 3, 4, and 6).
Of course, entirely new methods could be imagined for harvesting the still higher wind power levels found at open sea, i.e., winds much further offshore than those exploited by current machines standing on the sea floor. These could be combined wave- and wind-capturing devices, floating but kept within a restricted area by an advanced navigation system. The wind turbines could be shrouded or ducted constructions (section 4.3.3), while the wave energy part is likely to use dual air turbines. No developments in this direction have been successful so far. Wave energy devices for near-shore employment have not successfully struck a balance between the necessary strength and economic power production, and no large mid-ocean wave converters have reached interesting sizes for energy production (only niche devices, such as Masuda’s air pump for buoy light generators (Fig. 4.41), have shown acceptable performance).
A number of biomass conversion methods are close enough to direct economic viability for the inclusion of indirect economics in cost comparisons to make them acceptable. This is true of biogas plants, particularly on a communal scale and as part of general waste-management schemes. Various schemes for hydrogen or liquid biofuel production are promising viability in the short-term future, but their market penetration will at least initially depend on the valuation used for the externalities of current fuel-based energy systems. It is difficult to tell which of the biofuels and associated technologies (gasification routes, enzymatic routes, etc.) will first reach acceptable costs, but probably there will be room for more than one solution.
The entire bioenergy field may be in for radical restructuring if current trends toward valuing high food quality continue and spread to regions not currently concerned. This may alter agricultural practices, both for plant and for animal production, in the direction of pesticide-free ecological (“organic”) practice and lead to new concepts of integrated food and energy production based upon ecological principles, as distinct from the concept of dedicated energy crops.
Geothermal resources used sustainably can be a stable source of low-temperature heat, and costs already appear acceptable, with some consideration of externalities for the alternatives. Many existing district heating systems could benefit from this new source of heat. The market for geothermal solutions depends on the viability of district heating. If the full potential for making existing and new buildings highly energy efficient is realized, there will be very few locations in the world where new district heating schemes are economically attractive (probably only city centers with dense, high-rise buildings).
For solar energy, thermal applications are economically viable in lower-latitude regions, as judged in an assessment including externalities for conventional solutions. But this also depends on whether the building is energy efficient in the first place. A large heat requirement in winter is hardly compatible with solar coverage, but if the passive and active efficiency features of the building are optimal, the heat load may be dominated by hot water use, which is more amenable to solar supply. This is particularly so for niche markets, such as vacation areas (e.g., in the Mediterranean region or similar places), where there may be lots of building space being inhabited only during the summer season.
For solar electricity, the current cost of photovoltaic power systems is moving downward, even before considering indirect costs, but is still higher than that of wind power. However, technical development is rapid in this area, and novel solutions under current development for conventional solar cells would include combined power and heat systems (PVT, cf. section 4.4). A multitude of novel techniques for converting solar energy have seen the light in recent decades. While organic dyes, polymer cells, and other low-efficiency solutions do not seem practical (because neither structural support nor building integration is compatible with such low efficiencies, either due to cost or to mounting areas required), some of the thin-film technologies not using crystallized silicon semiconductors appear to have a chance in the long run. The perovskite techniques recently investigated (section 4.4) are actively discussed in scientific circles. In the laboratory, they have much better efficiencies than earlier dye-sensitized cells, but suffer from similar stability and lifetime problems. Some of them are environmentally dubious due to lead content.
Above all, as mentioned several times in this book, both direct and, even more, a life-cycle approach to economic valuation will make efficient use of energy more attractive in nearly all cases, and the implied lowering of energy demand per capita will generally improve the conditions for all renewable energy types of supply by making it possible to furnish all required energy from renewable sources with minimal strain on the Earth’s resources.
8.3.2 Energy storage and auxiliaries
The intermittency of several renewable energy flows makes it imperative to include features in systems relying on renewable energy inputs that can ensure supply–demand matching in time and place. For less than 100% renewable energy systems, the nonrenewable units can be used for back-up, but for purely renewable energy systems, storage or suitable exchange of energy is necessary. To some extent, storable biofuels can serve this purpose, but it is highly likely that additional components will be required.
This brings into focus bulk storage development, as well as means for transmission to and from power producing devices, and between load locations and supply locations, especially when the closest ones may be unavailable. Possible candidates for a flexible conversion between electric power (i.e., the output energy form of variable renewable sources like wind turbines or photovoltaic converters) and storable energy are (preferably reversible) fuel cells combined with hydrogen storage. However the efficiency of gas turbines are not much lower than that of the best fuel cells, so if regeneration of electricity by fuel cells turn out problematic, hydrogen storage can still be useful in combination with conventional combustion, which is largely pollution-free for hydrogen. In certain areas, pumped hydro (or managed operation of combined hydro and intermittent renewable energy systems) can be used. Other storage forms, such as flywheels and batteries, evidently are not suited for bulk or long-term storage. This leaves storage of hydrogen in pressure containers or, much more economically, in underground caverns and aquifers as a central candidate for a general solution to the supply–demand mismatch problem.
Considerable hopes have been placed on utility uses of advanced batteries, and after 40 years of development this could finally be about to happen. During the last two decades, advanced batteries have finally emerged, first on a small scale suited for consumer appliances (portable computers, cameras, mobile telephones, light sources, etc.), but increasingly moving in the direction (price, performance) of bulk applications, such as for hybrid vehicles.
A range of hydrogen storage techniques has been emerging as suitable for medium-term energy storage, e.g., in combination with fuel-cell conversion. These include underground storage of hydrogen (in aquifers or flushed-out salt domes). Small-scale compressed hydrogen storage in containers for use in the transportation sector may in the future be replaced by storage in media, such as metal hydrides, capable of easily incorporating and releasing hydrogen. Use of hydrogen as an energy carrier is linked to the development of dependable and affordable fuel-cell energy converters.
Fuel-cell technology has not yet fulfilled its promise (see, for example, Daimler-Chrysler-Ballard, 1998), but the substantial price reductions needed still appear possible. Fuel-cell technology has many similarities to battery technology, so one might expect similar disappointments and similar successes. Pure fuel-cell vehicles are less likely to make it than intelligent hybrids, starting with combustion-engine/fuel-cell hybrids and moving toward plug-in battery/fuel-cell hybrid vehicles. The requirement for substantial infrastructure changes in order to use hydrogen both in vehicles and for stationary uses is a further impediment to the development of economically viable supply systems, as is the current limited lifetime of fuel cells (Sørensen, 2012).
8.3.3 The global political dimension
The conditions for energy transitions away from fossil fuels are different in different parts of the world. In some countries, there is broad political consensus on not redistributing wealth through taxation. This implies a need to keep the price of basic goods, including energy, at such a low level that a large fraction of the population is not pushed below the poverty line. In other parts of the world, there is a tradition for significant income redistribution through taxes, and consumers have for many years been accustomed to energy prices far above the direct cost, made possible because the redistribution policy allows such prices to prevail without marginalizing large groups of society. In recent years, general taxation has increasingly been replaced by “fair taxation,” meaning that the governments levy taxes on energy according to estimated de fact. externality costs of pollution, climate impact, supply insecurity, etc. (having to cut through the large uncertainty of such estimates). Countries committed to keeping energy prices low are more likely to consider extreme measures, such as going to war, in order to secure access to cheap energy sources from politically unstable parts of the world. Similar remarks can be made in reference to the efforts to encourage more efficient use of energy, which are often seen as politically unglamorous, although the extra cost of efficiency improvements, as mentioned, is generally much lower than the cost of introducing new energy sources.
From this perspective, there is little reason to be optimistic based just on the spectacular results obtained by past modest investments in renewable energy technology. Technical feasibility, decent prices, and general public acceptance seem insufficient to persuade policy makers and the industrial lobby in many parts of the world. What additional arguments should be brought forward? Air pollution, greenhouse gas emissions, fossil resource exhaustion, nuclear accidents, and radioactive waste have all in some measure failed to affect actual political decisions, although few would disagree that these are problems “in the long run.” The impetus behind this behavior is probably political governance’s being increasingly motivated by short-term goals, likely in part due to the influence of the media that are no longer independent and unbiased in their analysis and criticism, but are owned by and serving special interests. So it is tempting to conclude that, although several renewable energy solutions are increasingly penetrating the market (albeit sometimes misstating the inclusion of externalities in the cost decisions as “subsidies”), the rules of the marketplace have to be more fundamentally changed to include long-term human interests if the market is to become a level playing field. Again, this calls for political action that is unlikely to be taken unless the rules of the political game are also modified to include long-term human interests.
Political election campaigns are in many countries conducted with little or no mention of the climate issue. There seems to exist a variety of politicians believing that climate change is just another discussion subject that may be considered only if they see votes in doing so. The seriousness of the matter can perhaps be made clear by pointing to the ice age regularity that have prevailed for some 600 000 years, with six regular cycles of glaciation and deglaciation (Chapter 2). The current few hundred years of relying on burning fossil fuels will, according to the scientific insights available, destroy this pattern forever, by creating a new climatic regime of no glaciation for the next 100 000 years or more. People living in parts of the world that has earlier experienced coverage with ice may welcome this change, but the real message is that it is so simple to manipulate the climate of our fragile planet that a short period of wrong political decisions now can change the world irreparably. To believe that we have enough knowledge to overview the many impacts of such a change is hubris. Even the best models of today contain basic simplifications and assumptions that may be invalid in the long run, and particularly as regards negative impacts, our past experience is that they always tend to be more serious than we previously thought. We ought to be humble about our level of insight, considering that we cannot even predict the weather next week and we only have a (fairly subjective) belief that our current climate models are adequate on average for long-term predictions. Figure 8.4 shows the history of ice cover for the Northern Hemisphere, along with simplistic model calculations for the future: Curve A, assuming an atmospheric CO2 content of 210 ppmv (parts per million by volume) and leading to a new ice age is out of the question, as the CO2 content is already over 370 ppmv; Curves B and C show the results for a CO2 content of 280 and 750 ppmv. In both cases, the onset of a new ice age is postponed by some 50 000 years. In the IPCC reports (IPCC, 2007a, 2013), the issue of interfering with basic ice age dynamics is totally absent and only short-term sea level changes are dealt with.

In closing, the greenhouse issue can be illustrated by taking the externality cost of 21st century greenhouse damage from the Table 7.4 entries with grandfathering, 0.38 € per kg of carbon-equivalent emissions, and multiply this cost with the kg of carbon-equivalent emissions from a typical gasoline-engine driven passenger car, per liter or gallon of fuel used, which can be taken from Table 6.7 in Sørensen (2012) and using the units and conversion factor from the front matter of this book to get, in 2015-prices, a damage cost of 0.26 € per liter of gasoline or 1.11 US$ per gallon of gasoline. These are the amounts of money that a liter or gallon of gasoline has to be taxed, in order to secure funds for paying for the global warming damages enumerated in Chapter 7. Paying this extra cost is certainly within reach of the economic ability of most present societies, so the problem presented by such a raise of current fossil fuel prices (in fact being just similar to the maximum fossil fuel costs during the peak a few years ago) can clearly be handled if we want to. However, it also means that we may be better off by speeding the transition to fossil-free energy up, and that we are cheating ourselves if we continue to keep the fossil fuel prices used to evaluate the viability of alternatives under half their real value.
Part III: Mini projects, discussion issues, and exercises
III.1
Discuss the possibility that solar electricity could play the roles considered for wind electricity in section 6.5.2.
What is the diurnal and seasonal match between variations in solar energy generation and electricity load? For example, construct power duration curves or power-minus-load curves and discuss the need for short- and long-term storage of energy, in comparison with the corresponding information for wind energy systems in geographic regions of good wind access.
Are there climatic regimes that, from a system structure point of view (as distinct from a purely economic point of view), would make solar electricity the preferable solution?
Does it make any difference to the answers to the above questions whether the solar system in mind is based on solar cells or on concentrating collectors followed by thermal conversion?
III.2
Referring to Fig. III.1, discuss the potential of wave power in the North Atlantic Ocean for electricity production. Figure III.2 is the annual power duration curve for one particular wave device (a Salter duck, Fig. 4.44) with the efficiency curve given in Fig. 4.45. The diameter of the device is 16 m, and it is assumed to be omnidirectional, in the absence of directional data (Mollison et al., 1976). The corresponding power duration curve for the waves themselves is given in Fig. 3.59.


Compare the availability of the average power level with that of the wind-power systems considered in section 6.5.2. Why does the wave power go right to the 100% time fraction in Fig. III.1, in contrast to the single wind turbine power duration curves (e.g., Fig. 6.69)?
III.3
Try to answer the same questions as in III.2 on the basis of Fig. III.2 rather than Fig. III.1. Figure III.2 is based on data from the North Sea, and the size of the Salter device (6 m) is chosen to give the maximum annual power production.
Consider the statement that “waves accumulate wind energy over time and over fetch distance, hence wave power is more stable and dependable than wind power.”
III.4
Wind energy converters might be placed on platforms at sea. What advantages could be expected from such an arrangement? The structures associated with wave-power devices might conceivably be able to support wind energy converters on top. Would there be advantages in such a combination?
III.5
What size solar collector would be able to provide power for a small automobile (requiring, say, 25 kW peak power)?
Such a collector is not for integration in the roof of the car, but consider a car with a suitable storage facility (e.g., flywheel) that could be charged by electricity from solar cells covering a garage rooftop, for example.
The (annual) average power requirement of the car is much lower than the peak power. Assume an average net power requirement of 300 W (roughly corresponding to 1300 W of fuel for the more efficient types of automobiles produced at present), and estimate the solar cell area that would be required in order to produce power at about this level for most of the year (depending on latitude).
Flywheel storage, which has also been considered for “peak shaving” in present generations of cars, has the advantage of being capable of delivering very high peak power levels for starting and acceleration (if this feature of petrol-driven car engines is worth preserving).
III.6
Try to build a renewable energy supply–demand scenario for your country or region, based on the maps and data given in this chapter and possibly supplemented by additional local data (considering that the geographical resolution of about 50×50 km may not be sufficient for the study of a particular region).
Based on this work, determine whether your region is likely to be an energy-importing or energy-exporting area.
III.7
Compare direct cost evaluations for a definite renewable energy system, such as wind turbines, in which the annual interest rate has been taken alternatively as 15%, 10%, 5%, and 0%.
III.8
Discuss differences and similarities between economic models based on dynamic simulation models (e.g., the simplified one presented by Forrester, 1971), models based on quasi-static assumptions (such as the one outlined in section 7.1.2) or on the textbook input–output models (e.g., Cockrane et al., 1974), and finally, models based on scenarios and life-cycle assessment, as described in section 7.3.
III.9
Consider a wind energy system with storage. Try to find a relation between the installed wind energy capacity (expressed as a fraction I.win. of the average load) and the size of storage most appropriate (this in particular implies deciding on the capacity credit factor I. to aim for, as a function of I.win. and coupled with expectations of future escalation of fuel prices). Once this is at hand, construct accumulated present-value curves as functions of installed wind capacity (that is, Iwin.).
III.10
Compare centralized and decentralized generation of electricity by means of solar cells. For the centralized system, one may assume support structures made of concrete or of steel frames. The projected cost for support structures and land acquisition is responsible for roughly half the total cost. Alternatively, consider decentralized units mounted on individual roofs of existing buildings. The cost of support structures and land would be saved. On the other hand, mounting and controls may be more expensive.
Try to collect costs for the relevant items that may be different for the two systems, and discuss the indirect economic factors relevant to the issue.
Extend the economic discussion to include the requirements for energy storage, based on data for variations in expected solar energy production at a location of your choice.
If wind converter production data for the same region are available, discuss the advantages that may be obtained by having the solar cells and wind energy converters feed into the same energy storage system.
III.11
Discuss the economy of central energy conversion followed by transmission, relative to decentralized conversion at the load areas, separately for heat and for electricity.
As an example, construct a small model including possible differences in costs of conversion equipment, depending on unit size, as well as possible differences in conversion efficiency. Add to this some assumptions regarding the cost of, and losses associated with, energy transmission of heat or of electricity.
Identify factors of indirect economy that may have particular relevance for the discussion of centralized and decentralized conversion (e.g., supply security in various cases of system failure).
III.12
Try to carry through a life-cycle analysis of some energy system of interest to your location (province, country). First make an inventory of the possible types of social and environmental impacts and the pieces of equipment responsible for these impacts, and then try to quantify each in physical terms, and, finally, discuss the possible monetization of impacts. Did the results become more accurate by monetizing, or less accurate?