3. The Data Mining Process
As has been the case in many other computational paradigms, extracting knowledge from large data repositories (i.e., data mining) started as trial-and-error experimental projects. Many practitioners have looked at the problem from the perspective of trying to characterize what works and what doesn’t. For quite some time, data mining projects were carried out as rather artistic experimental endeavors. However, in order to methodically conduct data mining analysis, a standardized process needed to be developed and followed. Based on best practices, data mining researchers and practitioners have proposed several processes—workflows in the form of simple step-by-step methodologies—to maximize the likelihood of success in conducting data mining projects. These efforts have led to several standardized processes, some of which are described in this chapter.
The Knowledge Discovery in Databases (KDD) Process
One of the earliest and perhaps the first data mining process was the name of knowledge discovery in databases (KDD) methodology, proposed by Fayyad et al. (1996). In the KDD methodology, data mining is a single step where the patterns are extracted from data. They proposed KDD as a comprehensive end-to-end process that encompasses many individual steps to convert data into knowledge. A pictorial representation of the KDD process is given in Figure 3.1. In the figure, the processing steps are shown as labeled directional arrows, and the result of each step is shown as a graphical image representing the artifact. As shown in Figure 3.1, the input to the KDD process is a collection of data coming from organizational databases and/or other external data sources. These data sources are often combined in a centralized data repository called a data warehouse. A data warehouse enables the KDD process to be implemented effectively and efficiently because it provides a single source for data to be mined. Once the data is consolidated in a unified data warehouse, the problem-specific data is extracted and prepared for further processing. Because the data is usually in a raw, incomplete, and dirty state, a through preprocessing needs to be conducted before the modeling can take place. Once the data is preprocessed and transformed into a form that’s ready for modeling, a variety of modeling techniques are applied to the data to convert it into patterns, correlations, and predictive models. The discovered patterns must be validated, and then they need to be interpreted and internalized so that they can be converted into actionable information (i.e., knowledge). One important part of this process is the feedback loop that allows the process flow to redirect backward, from any step to any other previous steps, for rework and readjustments.

Cross-Industry Standard Process for Data Mining (CRISP-DM)
Another standardized data mining processes—arguably the most popular one—is called Cross-Industry Standard Process for Data Mining (CRISP-DM), which was proposed in the mid- to late 1990s by a European consortium of companies. It was intended to serve as a nonproprietary standard methodology for data mining projects (CRISP-DM, 2014). Figure 3.2 illustrates this six-step standardized process, which starts with a good understanding of the business problem and the need for the data mining project (i.e., the application domain) and ends with the deployment of the solution that satisfies the specific business need that started the data mining project in the first place. Even though these steps are shown in sequential order in the graphical representation, there usually is a great deal of backtracking. Because the data mining is driven by experience and experimentation, depending on the problem situation and the skills, knowledge, and experience of the analyst, the whole process can be very iterative (i.e., it may require going back and forth through the steps quite a few times) and time-intensive. Because each step is built on the outcome of the immediate predecessor, it’s important to pay extra attention to the earlier steps in order to avoid putting an entire study on an incorrect path from the outset.

The following sections describe the steps of the CRISP-DM process in detail.
Step 1: Business Understanding
The key to success in any data mining project is to know what the study is for. Making this determination begins with gaining a thorough understanding of the managerial need for new knowledge and an explicit specification of the business objective regarding the study to be conducted. Specific goals such as “What are the common characteristics of the customers we have lost to our competitors recently?” or “What are typical profiles of our customers, and how much value does each of them provide to us?” are needed. Then a project plan for finding such knowledge is developed that specifies the people responsible for collecting the data, analyzing the data, and reporting the findings. At this early stage, a budget to support the study should also be established, at least at a high level and with rough numbers. For example, with a customer segmentation model developed for a retail catalog business, the identification of a business purpose meant identifying the type of customer that would be expected to yield a profitable return. A similar analysis would also be useful for credit card distributors. For business purposes, grocery stores often try to identify which items tend to be purchased together, so they can do better affinity positioning within the store or more intelligently guide promotional campaigns. Data mining has many useful business applications and can be applied to many business problems and opportunities. Intimately knowing the business purpose is critical to achieving success.
Step 2: Data Understanding
The second step in the CRISP-DM process is to make a perfect match between the business problem and the data being used to address it. That is, a data mining study is specific to a well-defined business task, and different business tasks require different sets of data. Therefore, it is important to identify the relevant data from many available data sources. Several key points must be considered in the data identification and selection process. First and foremost, an analyst should be clear and concise in describing the data mining task so that the most relevant data can be identified. For example, a retail data mining project might seek to identify spending behaviors of female shoppers who purchase seasonal clothes based on their demographics, credit card transactions, and socioeconomic attributes. Furthermore, the analyst should gain an intimate understanding of the data sources—for example, where the relevant data is stored and in what form, whether data collection is automated or happens manually, who collects the data, and how often the data are updated. The analyst should also understand variables by asking questions such as “What are the most relevant variables?” “Are there any synonymous and/or homonymous variables?” and “Are the variables independent of each other—that is, do they stand as a complete information source without overlapping or conflicting information?”
In order to better understand the data, the analyst often uses a variety of statistical and graphical techniques, such as simple statistical descriptors/summaries of each variable (e.g., for numeric variables, the average, minimum/maximum, median, and standard deviation are among the calculated measures, whereas for categorical variables the mode and frequency tables are calculated), correlation analysis, scatterplots, histograms, and box plots. Careful identification and selection of data sources and the most relevant variables can make it easier for data mining algorithms to quickly discover useful knowledge patterns.
Data sources for data selection can vary. Normally, data sources for business applications include demographic data (e.g., income, education, number of households, age), sociographic data (e.g., hobbies, club memberships, entertainment), and transactional data (e.g., sales record, credit card spending, issued checks), among others.
Data can be categorized as quantitative and qualitative. Quantitative data is measured using numeric values. It can be discrete (e.g., integers) or continuous (e.g., real numbers). Qualitative data, also known as categorical data, contains both nominal and ordinal data. Nominal data has finite non-ordered values. For example, gender data has two values: male and female. Ordinal data has finite ordered values. For example, customer credit ratings are considered ordinal data because the ratings can be excellent, fair, and bad. Quantitative data can be readily represented by some sort of probability distribution. A probability distribution describes how the data is dispersed and shaped. For instance, normally distributed data is symmetric and is commonly referred to as being a bell-shaped curve. Qualitative data may be coded to numbers and then described by frequency distributions. Once the relevant data is selected according to the data mining business objective, data preprocessing should be conducted. (For more details on data in data mining, see Chapter 4, “Data and Methods in Data Mining.”)
Step 3: Data Preparation
The purpose of data preparation (commonly called data preprocessing) is to prepare the data identified in the previous step for analysis using data mining methods. Compared to the other steps in CRISP-DM, data preprocessing consumes the most time and effort—roughly 80% of the total time spent on a data mining project. This step requires such enormous effort because real-world data is generally incomplete (lacking attribute values, lacking certain attributes of interest, or containing only aggregate data), noisy (containing errors or outliers), and inconsistent (containing discrepancies in codes or names).
Some parts of the data may have different formats because they are taken from different data sources. The selected data may be from flat files, voice message, images, and Web pages, and it needs to be converted to a consistent and unified format. In general, data cleaning means filtering, aggregating, and filling in missing values (a.k.a. imputation). By filtering the data, an analyst examines the selected variables for outliers and redundancies. Outliers differ greatly from the majority of data, or data that is clearly out of range of the selected data groups. For example, if the age of a customer included in the data is 190, this must be a data entry error and should be identified and fixed (perhaps taken out of a data mining project that examines the various aspects of customers, since age is perceived to be a critical customer characteristic). Outliers may occur for many reasons, such as human errors or technical errors, or may naturally occur in a data set due to extreme events. Suppose the age of a credit card holder is recorded as “12.” This is likely a data entry error, most likely made by a human. However, there might actually be an independently wealthy preteen with important purchasing habits. Arbitrarily deleting this outlier could dismiss valuable information.
Data may also be redundant, with the same information recorded in several different ways. Daily sales of a particular product are redundant to seasonal sales of the same product because an analyst can derive the sales from either daily data or seasonal data. Aggregating data reduces data dimensions. Note that although an aggregated data set has a small volume, the information remains. If a marketing promotion for furniture sales is considered in the next three or four years, the available daily sales data can be aggregated as annual sales data. The size of the sales data is then dramatically reduced. By smoothing data, missing values of the selected data are found and new or reasonable values are then added. These added values could be the average number of the variable (mean) or the mode. A missing value often causes no solution when a data mining algorithm is applied to discover the knowledge patterns.
Step 4: Model Building
In the fourth step of the CRISP-DM process, various modeling techniques are selected and applied to an already prepared data set in order to address the specific business need. The modeling step also encompasses the assessment and comparative analysis of the various types of models that can address the same type of data mining tasks (e.g., clustering, classification). Because there is not a universally known best method or algorithm for a specific data mining task, an analyst should use a variety of viable model types, along with a well-defined experimentation and assessment strategy, to identify the “best” method for a given data mining problem. Even for a single method or algorithm, a number of parameters need to be calibrated to obtain optimal results. Some methods may have specific requirements for the way the data is to be formatted; thus returning to the data preparation step is often necessary.
Depending on the business need, the data mining task can be a prediction (either classification or regression), an association, or a clustering/segmentation type. Each of these data mining tasks can use a variety of data mining methods and algorithms. For instance, classification-type data mining tasks can be accomplished by developing neural networks or by using decision trees, support vector machines, or logistic regression. These data mining methods and their respective algorithms are explained in Chapter 4 and Chapter 5, “Data Mining Algorithms.”
The standard procedure for modeling in data mining is to divide a large preprocessed data set into subsets for training and validation or testing. Then the analyst can use a portion of the data (the training set) to develop the models (no matter what modeling technique and/or algorithm is used) and use the other portion of the data (the test set) for testing the model that was just built. The principle is that if you build a model on a particular set of data, it will of course test quite well on the data on which it was built. By dividing the data and using part of it for model development and testing it on a separate set of data, an analyst can create convincing and reliable results for the accuracy and reliability of the model. The idea of splitting the data into components is often carried to additional levels, with multiple splits in the practice of data mining. For further details about data splitting and other evaluation methods, see Chapter 4.
Step 5: Testing and Evaluation
In the fifth step of the CRISP-DM process, the developed models are assessed and evaluated for accuracy and generality. This step assesses the degree to which the selected model (or models) meets the business objectives and whether more models need to be developed and assessed. Another option is to test the developed model(s) in a real-world scenario if time and budget constraints permit. Even though the outcome of the developed models is expected to relate to the original business objectives, other findings that are not necessarily related to the original business objectives but that might also unveil additional information or hints for future directions are often discovered.
Testing and evaluation is a critical and challenging step. No value is added by the data mining task until the business value obtained from discovered knowledge patterns is identified and recognized. Determining the business value from discovered knowledge patterns is somewhat similar to playing with puzzles. The extracted knowledge patterns are pieces of the puzzle that need to be put together in the context of the specific business purpose. The success of this identification operation depends on the interaction among data analysts, business analysts, and decision makers (e.g., business managers). Data analysts may fully understand the data mining objectives and what they mean to the business, and business analysts and decision makers may not have the technical knowledge to interpret the results of sophisticated mathematical solutions; therefore, interaction among them is necessary. In order to properly interpret knowledge patterns, it is often necessary to use a variety of tabulation and visualization techniques (e.g., pivot tables, cross-tabulation of findings, pie charts, histograms, box plots, scatterplots).
Step 6: Deployment
Development and assessment of models is not the end of a data mining project. Even if the purpose of a model is to do a simple exploration of the data, the knowledge gained from such exploration needs to be organized and presented in a way that the end user can understand and benefit from. Depending on the requirements, the deployment phase can be as simple as generating a report or as complex as implementing a repeatable data mining process across the enterprise. In many cases, it is the customer, not the data analyst, who carries out the deployment steps. However, even if an analyst will not carry out the deployment effort, it is important for the customer to understand up front what actions need to be carried out in order to actually make use of the created models.
The deployment step of the CRISP-DM process may also include maintenance activities for the deployed models. Because the business is constantly changing, the data that reflects the business activities is also changing. Over time, the models (and the patterns embedded within them) built on the old data may become obsolete, irrelevant, or misleading. Therefore, monitoring and maintaining the models are important if the data mining results are to become a part of the day-to-day business and its environment. Careful preparation of a maintenance strategy helps avoid unnecessarily long periods of incorrect use of data mining results. In order to monitor the deployment of the data mining result(s), a project needs a detailed plan for the monitoring process, which may not be trivial with complex data mining models.
The CRISP-DM process is the most complete and most popular data mining methodology practice in industry as well as in academia. Rather than use it as is, practitioners add their own insights to make it specific to their style of practice.
SEMMA
In order to be applied successfully, a data mining solution must be viewed as a process rather than as a set of tools or techniques. In addition to KDD and CRISP-DM, there is yet another well-known methodology, called SEMMA, developed by the SAS Institute. The acronym SEMMA stands for sample, explore, modify, model, assess. Beginning with a statistically representative sample of data, SEMMA intends to make it easy to apply exploratory statistical and visualization techniques, select and transform the most significant predictive variables, model the variables to predict outcomes, and confirm the model’s accuracy. A pictorial representation of SEMMA is given in Figure 3.3.
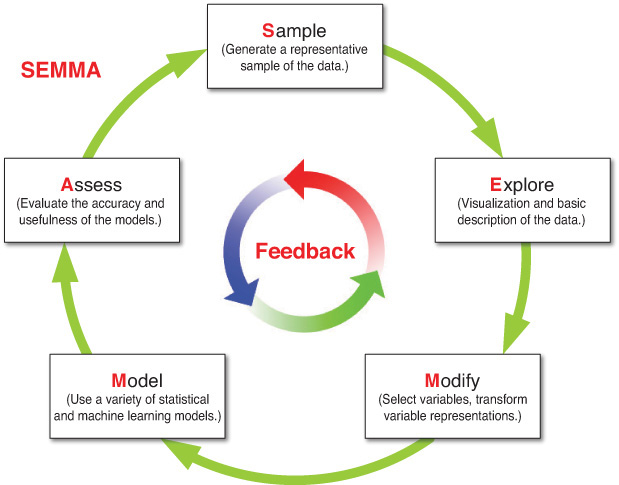
By assessing the outcome of each stage in the SEMMA process, an analyst can determine how to model new questions raised by the previous results and thus return to earlier steps for additional refinement of the data. Like CRISP-DM, SEMMA is also driven by a highly iterative experimentation cycle. The following sections describe the five steps of the SEMMA process.
Step 1: Sample
In the sample step, a portion of a large data set (big enough to contain significant information yet small enough to manipulate quickly) is extracted. For optimal cost and computational performance, some (including the SAS Institute) advocate using a sampling strategy that involves applying a reliable, statistically representative sample of the full-detail data. In the case of very large data sets, mining a representative sample instead of the whole volume may drastically reduce the processing time required to get crucial business information. If general patterns appear in the data as a whole, they will be traceable in a representative sample. If a niche (a rare pattern) is so tiny that it is not represented in a sample and yet so important that it influences the big picture, it should be discovered using exploratory data description methods. It is also a good idea to create partitioned data sets for better accuracy assessment.
The sample step of the SEMMA process involves three substeps:
• Training. Used for model fitting.
• Validation. Used for assessment and to prevent overfitting.
• Test. Used to obtain an honest assessment of how well a model generalizes.
For a more detailed discussion and relevant techniques for assessment and validation of data mining models, see Chapter 4.
Step 2: Explore
During the second step of the SEMMA process, the analyst searches for unanticipated trends and anomalies in order to gain a better understanding of the data set. The analyst explores the data visually or numerically for inherent trends or groupings. Exploration helps refine and redirect the discovery process. If visual exploration does not reveal clear trends, the analyst can explore the data by using statistical techniques, including factor analysis, correspondence analysis, and clustering. For example, in data mining for a direct mail campaign, clustering might reveal groups of customers with distinct ordering patterns. Limiting the discovery process to each of these distinct groups individually may increase the likelihood of exploring richer patterns that may not be strong enough to be detected if the whole data set is to be processed together.
Step 3: Modify
During the third step of the SEMMA process, the analyst creates, selects, and transforms the variables on which to focus the model construction process. Based on the discoveries in the exploration phase, the analyst may need to manipulate data to include information such as the grouping of customers and significant subgroups or to introduce new variables. It may also be necessary to look for outliers and reduce the number of variables in order to narrow them down to the most significant ones. The analyst may also need to modify data when data that is mined changes. Because data mining is a dynamic, iterative process, an analyst can update data mining methods or models when new information is available.
Step 4: Model
The fourth step of the SEMMA process is where the analyst searches for a variable combination that reliably predicts a desired outcome. The goal is to construct models that explain patterns in the data. Modeling techniques in data mining include artificial neural networks, decision trees, rough set analysis, support vector machines, logistic models, and other statistical models, such as time-series analysis, memory-based reasoning, and principal component analysis. Each type of model has particular strengths and is appropriate in specific data mining situations and for different types of data. For example, artificial neural networks are very good at fitting highly complex nonlinear relationships, while rough set analysis is known to produce reliable results with uncertain and imprecise problem situations.
Step 5: Assess
In the final step of the SEMMA process, the analyst evaluates the usefulness and reliability of the findings from the data mining process. This is basically an estimation of how well the model performs. A common way to assess a model is to apply it to a portion of a data set that was put aside during the sampling stage and not used during model building. If the model is valid, it should work for this reserved sample as well as for the sample used to construct the model. Similarly, it is possible to test the model against known data. For example, if you know which customers in a file had high retention rates and your model predicts retention, you can check to see whether the model selects those customers accurately. In addition, practical applications of the model, such as partial mailings in a direct mail campaign, help prove the validity of a model.
SEMMA Versus CRISP-DM
The SEMMA approach is quite compatible with the CRISP-DM approach. Both aim to streamline the knowledge discovery process. Both were created as broad frameworks that should be adapted to specific circumstances. In both, once models are obtained and tested, they can then be deployed to gain value with respect to business or research application. Even though they have the same goal and are similar, SEMMA and CRISP-DM have a few differences. Table 3.1 presents these differences.

Six Sigma for Data Mining
Six Sigma is a popular business management philosophy that focuses on reducing deviations (i.e., sigma) from perfection by rigorously and systematically using proven quality control principles and techniques. This hugely popular management philosophy was first introduced by Motorola in the 1980s in the context of manufacturing management. Since then it has been adopted by many companies and organizations in a wide verity of business contexts beyond manufacturing. Ideally, Six Sigma promotes zero defects and zero tolerance, which can roughly be translated in the business context as error-free perfect business execution. Six Sigma methodology has manifested itself in the business world with DMAIC, which involves five steps: Define, Measure, Analyze, Improve, and Control.
Because of its success in many other business problems and settings, DMAIC methodology is also applied to data mining projects. Figure 3.4 shows the DMAIC methodology as a simplified flow diagram. The following sections describe these steps.

Step 1: Define
The first step in the DMAIC process is about getting the project set up and started. It involves several steps: (1) gaining a thorough understanding of the business needs, (2) identifying the most pressing problem, (3) defining goals and objectives, (4) identifying and defining the data and other resources needed to investigate the business problem, and (5) developing a detailed project plan. As you may have noticed, there is a significant overlap between this step and the first step in the CRISP-DM process.
Step 2: Measure
The second step of the DMAIC process involves assessing the mapping between organizational data repositories and the business problem. Since data mining requires relevant, clean, and usable data, identification and creation of such resources is of critical importance to the success of a data mining project. In this step, the identified data sources are consolidated and transformed into a format that is amenable to machine processing.
Step 3: Analyze
The third step of the DMAIC process is to use a series of data mining techniques to develop models. There are many possible techniques, and most of them are machine learning techniques with many parameters to optimize. There is not a single best technique, so an analyst needs to apply several probable techniques and experiment with them to identify and develop the most appropriate model.
Step 4: Improve
The fourth step of the DMAIC process is to investigate the improvement possibilities. Improvements can be at the technique level or at the business problem level. For instance, if the model results are not satisfactory, other more sophisticated techniques (e.g., ensemble systems) can be used to boost the performance of the models. Also, if the modeling results are not clearly addressing the business problem, the analyst can loop back to previous steps to reexamine and improve the structure of the analysis. The analyst can also further investigate and restate the business problem.
Step 5: Control
The last step of the DMAIC process is to assess the project outcomes, and if they are found to be satisfactory, the models and result are disseminated to decision makers and/or integrated into the existing business intelligence systems for automation.
Six Sigma–based DMAIC methodology resembles the CRISP-DM process. There is no evidence to suggest that one was inspired by the other. However, because these two methodologies involve rather logical and straightforward steps in any business system analysis effort, they need not have to be inspired one another. The recumbence might simply be a coincidence. Users of DMAIC are rarely compared to CRISP-DM because these two methodologies are used to address different types of business applications. Many organizations around the world are using DMAIC and CRIPS-DM and their variants to conduct process improvement and data mining projects.
Which Methodology Is Best?
Even though some data mining processes are more elaborate than the others, there is no sure way to compare them. They all have pros and cons. Some are more problem focused, while others are more analysis driven. A business that does data mining adopts one of these methodologies and then is likely to slightly modify it to make it fit the business or the data. KDNuggets, a well-known and well-respected Web portal for data mining, conducted a survey in which it asked “Which one is the best?” Figure 3.5 shows the polling results of that survey (KDNuggets, 2007).

Source: Used with permission from kdnuggets.com
Figure 3.5 A Poll on Popular Data Mining Methodologies
As the survey results indicate, CRISP-DM dominates as the most popular data mining process. In addition, many of the ones that fall under “My own” are also customizations of CRISP-DM. Compared to the other methodologies, CRISP-DM is the most complete and most mature process for data mining.
An Exemplary Data Mining Case: Mining Cancer Data for New Knowledge
References
CRISP-DM. (2014). “Cross-Industry Standard Process for Data Mining (CRISP-DM).” www.the-modeling-agency.com/crisp-dm.pdf (accessed May 22, 2014).
Delen, D. (2009). “Analysis of Cancer Data: A Data Mining Approach,” Expert Systems, 26(1): 100–112.
Delen, D., & N. Patil. (2006, January). “Knowledge Extraction from Prostate Cancer Data,” Proceedings of the 39th Annual Hawaii International Conference on Systems Sciences, 5: 92b.
Delen, D., G. Walker, & A. Kadam. (2005). “Predicting Breast Cancer Survivability: A Comparison of Three Data Mining Methods,” Artificial Intelligence in Medicine, 34(2): 113–127.
Fayyad, U., G. Piatetsky-Shapiro, and P. Smyth. (1996). “From Knowledge Discovery in Databases.” AI Magazine, 17(3): 37–54.
KDNuggets. (2007). “Poll: What Main Methodology Are You Using for Data Mining?” www.kdnuggets.com/polls/2007/data_mining_methodology.htm (accessed September 2014).