
Chapter 8
Inflation-Indexed Bonds
John B. Brynjolfsson, CFA
Executive Vice President and Manager PIMCO Real Return Bond Fund
Historically, the greatest financial risk savers have faced has been inflation. During periods when too much money is chasing too few goods, savers’ financial needs inflate as the cost of living rises and their financial resources shrink as asset valuations are debased. In particular, rising inflation hits equities with a one-two punch, as higher input prices put downward pressure on earnings, and higher interest rates put downward pressure on price-to-earnings ratios. Meanwhile savers’ fixed income portfolios also suffer as rising market yields drive bond prices down, while accelerating inflation tends to make the inflation adjusted yield on cash instruments fall, or even become what turns out to be negative, when examined in retrospect.
There is good news however. Investors have a tool that mitigates the corrosive impact that inflation would otherwise have on their financial plans. That tool is Treasury Inflation Protection Securities (TIPS).1
TIPS are bonds that are contractually guaranteed to protect and grow purchasing power. The U.S. Treasury adjusts TIPS’ principal based upon changes in the consumer price index (CPI) daily so that upon maturity investors maintain their original purchasing power.2 In addition, the Treasury calculates the semiannual coupon payments based upon this indexed principal amount so that investors also maintain the purchasing power of the income their assets generate.
The Treasury launched the TIPS program in 1997, and through the end of 2001 has issued over $145 billion of the securities. According to Federal Reserve Bank statistics, on a typical day more than $2 billion dollars trade in the secondary market. Since the 1940s, more than 15 governments and numerous corporations have issued similarly structured securities. In the U.K., inflation-indexed securities account for more than 20% of government bonds outstanding.
TIPS are best known as a defensive hedge against the fear of inflation, but they offer tactical and strategic advantages as well. Tactically, investors are attracted to the opportunity TIPS afford to speculate on changes in inflation and real interest rates. Strategically, individual and institutional investors with long-term objectives are attracted to TIPS’ high real yield, their muted price volatility, and their low, or negative, correlation with other asset classes. They have found TIPS help them achieve their long-term investment goals, and reduce risk in the process.
The unique characteristics of TIPS qualify them as a fundamental asset class, as are equities, traditional bonds, and cash.
This chapter covers various aspects of TIPS, focusing on the U.S. Treasury TIPS but introducing substantive differences of other TIPS where appropriate. We begin with the mechanics of TIPS’ cash flows. We then explore real yield and real duration-two measures that are analogous to a nominal bonds’ yield to maturity and effective duration. The valuation and performance section presents a framework, and evaluates the TIPS market in the context of that framework.
MECHANICS AND MEASUREMENT
The merit of TIPS is that the principal and interest repaid to investors fluctuates based on the level of the CPI such that the purchasing power of each payment is fixed. As a consequence, the real yield of TIPS (the growth in purchasing power that a hold-to-maturity investor will earn) is fixed.
How TIPS Work
An illustration will be used to demonstrate how TIPS work. Exhibit 8.1 provides the data for the illustration. The following assumptions are made:
EXHIBIT 8.1 Stylized Cash Flow of TIPS
| Purchase | First Annual Coupon | Interim Annual Coupon | Last Annual Coupon | Principal | Return (per annum) | |
| Date | 1/15/02 | 1/15/03 | 1/15/07 | 1/15/12 | 1/15/12 | 1/15/12 |
| Real $ Cash Flow | (1,000) | 30.00 | 30.00 | 30.00 | 1,000 | 3.00 |
| CPI (Base = 200) | 200.0 | 204.0 | 220.8 | 243.8 | 243.8 | 2.00 |
| Indexed Principal | 1,000 | 1,020 | 1,104 | 1,219 | 1,219 | (na) |
| Nominal $ Cash Flow | (1,000) | 30.60 | 33.12 | 36.57 | 1,218.99 | 5.06% |
Source: Pacific Investment Management Company
- issuance date of 1/15/02
- issuance price of $100.00 per $100.00 of face3
- 10-year maturity
- 3% real coupon paid annually
- 2% annualized inflation rate
- original principal amount of $1,000
If the CPI for the TIPS issuance date is 200.00 and the CPI for a coupon date one year later is 204.00, year-over-year inflation would be reported as 2.00%. Then the TIPS’ adjusted principal would be 1.02 times its original value, or $1,020 per $1,000 of face. This ratio of CPI for a given date to the CPI for a TIPS issue date is termed the “index ratio.” It forms the basis for TIPS’ indexation.
In particular, this indexed principal is used to calculate the coupon paid; and the Treasury calculates the amount of each coupon payment, after the principal has been adjusted for inflation.4 Exhibit 8.1 shows that the compounding effect of a 3% real coupon with a 2% inflation rate results in a nominal cash flow annualized return of 5.06%.
The calculations of actual Treasury TIPS cash flows and returns are only somewhat more complicated. TIPS pay interest semiannually at one-half their stated annual coupon rate. The inflation-indexed principal is accrued daily, based on an interpolation between the two monthly CPI figures reported immediately prior to the settlement month. And lastly, the U.S. Treasury uses an intricate rounding and truncating procedure for interim and final calculations (included in Bloomberg analytics). (See Exhibit 8.2.)
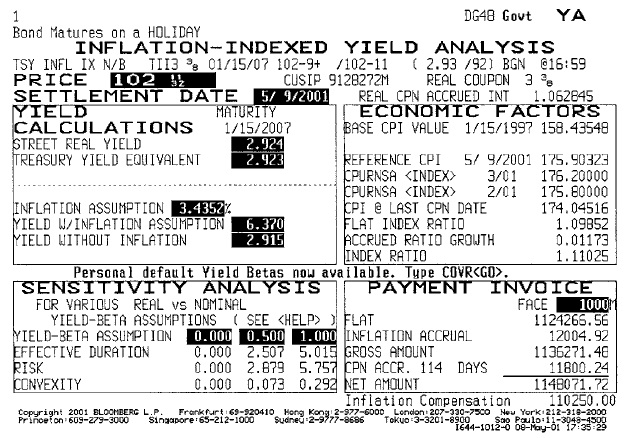
EXHIBIT 8.2 Bloomberg Screen Illustrating Actual Settlement Calculations
Source: Bloomberg Financial Markets
The Consumer Price Index
The specific consumer price index (CPI) series used for TIPS indexation is the “Non-Seasonally Adjusted, All-Urban Consumer Price Index” (NSA CPI-U). It is reported monthly. Unlike the seasonally-adjusted series, the NSA CPI-U is not subject to revision. One consequence of utilizing the NSA CPI-U is that the series includes predictable seasonal fluctuations in inflation. For example, in December of most years inflation is muted by year-end price-cutting and inventory liquidations. As a result the Non-Seasonally Adjusted CPI-U index tends to fall slightly below its trend. In certain other months it tends to rise slightly above the underlying trend.
The CPI report that surveys the price level in a given month and is therefore named for that month, for example May, is typically reported on or near the 15th of the following month, in this example June. There is then an additional two-week delay between this reporting date, and the subsequent first of the month, upon which TIPS literally begin accruing the reported inflation. This two-week accrual cushion allows for potential delays in the official release date of CPI or other disruptions, and eliminates the need to calculate day-counts across month-ends. The last daily accrual of the May CPI report then occurs on July 31, about 7 weeks after the CPI figure is first reported; and therefore, the May CPI is fully incorporated into the August 1 TIPS principal.
This relatively quick two-week turnaround of CPI reports into TIPS’ indexation is described as a 3-month lag because the May (month 5) CPI is fully incorporated into all TIPS by August 1 (month 8). Indexation for dates other than the first are calculated by linear interpolation.
So, to calculate the TIPS principal for any settlement date, for example August 10, the procedure is as follows:
- Find the TIPS principal that applies to August 1: this is based on the May NSA CPI-U report (month 8 minus 3 = month 5).
- Find the TIPS principal that applies to September 1: this is based on the June NSA CPI-U report (month 9 minus 3 = month 6).
- Divide 9, the number of days of accrual (the 10th day of the month minus the 1st day of the month) by 31 (the number of days in that month).
- Linearly interpolate by adding 9/31 of the difference between the August 1 and September 1 TIPS principal values to the August 1 value.
Real Yield and Nominal Yield
The real yield of a TIPS bond represents the annualized growth rate of purchasing power earned when holding the security to maturity. TIPS’ real yield can easily be calculated on a standard bond calculator by entering the TIPS quoted market price, coupon rate, and maturity date. The calculator does not know the bond is a TIPS, or that the quoted price and coupon rate are real. So it is therefore user’s responsibility to interpret the numerical result as the “real yield.”5
The real yield of a nominal bond is more difficult to calculate, as it can only be precisely determined with the benefit of hindsight. In practice, when analysts speak of a nominal bond’s “real yield” they may be:
- Referring to its “current” real yield (approximated by subtracting the current year-over-year inflation rate from the bond’s nominal yield),
- Forecasting the nominal bond’s future real yield based on their expectation, or other forecasts, of future inflation, or
- Speaking of historical realized real returns on bonds that have matured.
Put another way, TIPS’ real yields are easy to calculate and well defined, whereas nominal bonds’ real yields are not.
The opposite situation occurs with nominal yields. While the nominal yield of a conventional bond is easily determined, the nominal yield of TIPS is more difficult to pin down. The nominal yield realized by holding TIPS to maturity depends upon the average level and trajectory of inflation over the bond’s lifetime. The realized nominal yield of a TIPS can be approximated as:
TIPS realized nominal yield = (1 + real yield) × (1 + inflation) − 1
Break-Even Inflation Rate
The break-even inflation rate is the rate that results in the hold-to-maturity investor in TIPS “breaking even” with the hold-to-maturity investor in a comparable maturity nominal bond. Using the above equation, the nominal yield of the TIPS can be set to equal the nominal yield of the conventional bond. Solving the equation for the break-even inflation rate:

If the conventional bond’s nominal yield is 5% and the TIPS real yield is 3% (both expressed in simple annualized terms), the break-even inflation rate is 1.94%. For most purposes approximating the above equation as the simple difference between the two bonds’ yields (2.00%) is appropriate-and general industry practice.
Exhibit 8.3 plots nominal yields, real yields, and their differences over a period including the fall of 1998. This period was notably marked by a significant deflationary scare. An astute investor might have construed the dramatic decline of the break-even inflation rate to below 1% as unduly pessimistic, and therefore a trading opportunity.
Although the break-even inflation rate may be useful to assess market inflation expectations or to gauge break-even requirements for narrowly constrained fixed-income investors, it generally overstates the risk-adjusted break-even inflation rate appropriate for long-term investors. In particular, the riskier nominal bonds embody inflation risk premiums. Researchers have estimated the embedded inflation risk premium in nominal bonds to be between 0.50% and 1.0%.6

EXHIBIT 8.3 Bloomberg Screen Showing Break-Even Inflation Rates
Source: Bloomberg Financial Markets
Because TIPS are indexed to CPI, exhibit low volatility, and have a low correlation to other assets, an inflation risk premium should not be embodied in TIPS yields. Therefore, the risk-adjusted break-even inflation rate for TIPS equals the calculated break-even inflation rate MINUS the inflation risk premium. This means an investor can advantageously use TIPS even when his expected inflation rate equals the break-even inflation rate naively calculated by simply substituting TIPS yields from nominal bonds’ yield. Such an investor will gain by lowering overall portfolio risk, or from reallocating the risk capacity created.
DURATION
Duration is the measure of a bond’s market value sensitivity to changes in specified yields-real or nominal. The earlier discussion of real and nominal yields is pivotal to any discussion of duration.
Real Duration
By definition, the real duration of TIPS is the percentage change in its market value associated with a 100-basis-point change in its real yield. For example, if the market value of TIPS is $1,000 and the market values associated with a 50-basis-point decrease and a 50-basis-point increase in the TIPS real yield are $1,051 and $951 respectively, the TIPS real duration is 10. In order to center the calculation at current yield levels, the 100-basis-point change in the definition is applied equally, as a 50-basis-point decrease and a 50-basis-point increase in yield.
Algebraically, the formula for TIPS real duration is:

where MV = market value.
Not surprisingly, the TIPS real duration formula is identical to the formula for a nominal bond’s nominal duration. It follows that TIPS real duration can be calculated using a standard bond calculator that reports duration based on the user keying in details including the bond’s coupon and maturity. As with the calculation for real yield, it is the user’s responsibility to remember that the result is the TIPS’ real duration.
Real duration is highly relevant to TIPS portfolio managers. It is an unambiguous metric that allows a managed portfolio of TIPS to be compared to a benchmark portfolio of TIPS. However its application is limited, as real duration dramatically overstates the exposure of TIPS to changes in nominal yields, and does not quantify the risk impact of adding TIPS to a portfolio of nominal bonds. There are a number of reasons for this. First, real yields tend to be significantly less volatile than nominal yields-so a portfolio of all TIPS with a given real duration typically will be less volatile than a portfolio of all nominal bonds with a numerically identical nominal duration. Second, the correlation of real yields with nominal yields tends to be quite low-so even adjusting real durations for the lower real yield price volatility would tend to overstate duration. In particular, when TIPS with substantial real durations are introduced to replace a fraction of bond portfolios with comparable volatility, much of the substituted risk is diversified away, and overall portfolio volatility falls rather than remaining unchanged.
Effective Duration
To explore the risk impact of tactically adding TIPS to a conventional portfolio, a manager needs a measure of TIPS’ sensitivity to changes in nominal interest rates. This measure is known as effective duration. The limitation is that since one must infer a change in real yield from the given change in nominal yield, the measure is conjectural rather than deterministic.
Initially this dilemma caused more than a few managers to conclude that the risk exposure of TIPS could not be managed within the context of a conventional fixed-income portfolio.7 Although crude, the best metric we have found for converting TIPS real yield into “effective duration” is to apply a 20% to 50% multiplicative factor to TIPS real durations. This factor is often described as a “yield beta”—a reference to the second coefficient (beta) of a linear regression of change in real yield against a change in nominal yield. TIPS effective duration should only be used as a loose metric for nominal interest rate exposure because substantial risk (basis risk) remains.
Occasionally, nominal yields fall and TIPS real yields rise, meaning that retrospectively TIPS experience negative effective durations. Conversely, occasionally nominal yields rise, and real yields rise even more, meaning TIPS experience capital losses larger than ex ante effective durations predict. It is incumbent that managers who use TIPS manage the basis risk that TIPS embody beyond their modest effective duration.
Exhibit 8.4 plots the weekly change in TIPS 2007 real yield on the vertical axis as a scatter, with the corresponding weekly change in nominal yield on the horizontal axis. The slope of the “best-fit” regression line shows that historically the “yield beta” over that period, at 17%, has been somewhat lower than the 20% to 50% that we use. The regression result will vary (as a function of the time period chosen to calculate the individual change), the time period included in the study, the securities chosen, and perhaps most importantly, the economic environment.
TIPS real duration measures risk as it relates to change in real yield and TIPS effective duration measures risk as it relates to changes in nominal yield. Another measure of TIPS risk is volatility. Volatility is simply the standard deviation of TIPS prices (or returns). It varies over time and across maturities as a function of the calculation period and measurement interval. Exhibit 8.5 graphs the historical price volatility of the first Treasury 10-year TIPS issued.
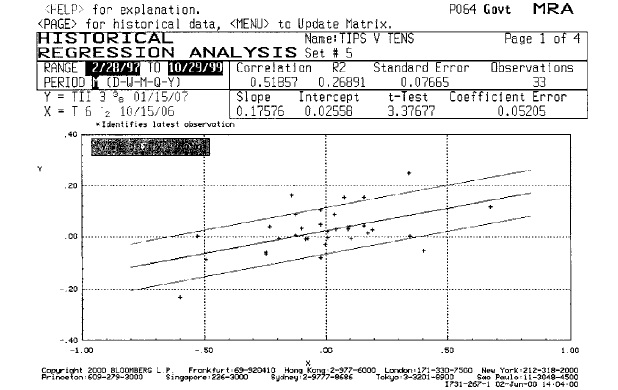
EXHIBIT 8.4 Bloomberg Screen—Historical Regression Analysis—Weekly Yield Changes of 2007 TIPS versus Yield Changes of 2006 Treasury
Source: Bloomberg Financial Markets

EXHIBIT 8.5 Bloomberg Graph of TIPS Bond‘s 26-Week Rolling Price Volatility
Source: Bloomberg Financial Markets
QUOTATION AND SETTLEMENT
In the United States, TIPS are quoted on a “real-clean” basis-as distinguished from a “nominal-dirty” basis. Fractions of a dollar are quoted as units of 1/32.
In this instance, “real” means that U.S. TIPS prices are quoted on the basis of 100 inflation-adjusted units of principal. For example (see Example 2), the quoted price 102-11 can be interpreted as 102 and 11/32 real dollars, meaning the investor is paying 102.3438% of the indexed principal amount, for the principal of the bond. So if the bond’s principal has grown from $1,000 per bond to $1,102.50 per bond, the price paid for the principal will be $1,136.27. While this may seem intuitive, it is not the only way to quote TIPS prices. If prices were quoted on a nominal basis, as they are in the U.K. Linker market, this same purchase would be quoted as 113.63 (102.3438 × 1.1025 = the real price times the index ratio). Similarly, to convert the real price quoted on U.S. TIPS to a nominal price for the bond, which necessarily is paid in “nominal dollars” upon settlement, one must multiply the real price by the index ratio.
Clean means the quoted TIPS price does not include the accrued-interest amount that the buyer of a TIPS bond owes the seller. Just as with nominal bonds, the TIPS buyer must compensate the seller for coupon income that has been earned since the last coupon payment. Parties, therefore, can calculate the settlement proceeds by multiplying real accrued interest by the index ratio and adding the result to the clean settlement price. In practice, a computer algorithm as shown in Exhibit 8.2 is used to incorporate rounding procedures prescribed by the Treasury.
In the U.K. Linker market, quotes are on a “nominal clean price” basis, and therefore some of their linkers trade at prices above $200 per $100 original face. This is because the country’s Retail Price Index (RPI) has more than doubled since the Bank of England began issuing these bonds in the early 1980s, so some of the index ratios are above 2.0.
In Australia and New Zealand, Inflation-Indexed Bonds (IIBs) typically are quoted and traded on a “real yield” basis. This means that the traders are quoting the most intuitive of all measures, real yield, and settlement computers are therefore performing the multistep calculations needed to convert this to settlement proceeds suitable for wire transfer.
In the Canadian and French markets, TIPS are quoted similarly to U.S. TIPS, except of course local inflation indexes are referenced.