Humans know that measures such as the level of their blood pressure, cholesterol, blood sugar, and white blood cells reflect the state of their health. Similarly, program managers know that measures such as time to money, development cost, gross profit margin, and profitability index reflect their programs' health. This chapter deals with performance measures that senior managers, program managers, and project managers need to understand to assess the health of their programs.
It is commonly understood today that one of the key rationales for using metrics is that "what gets measured gets improved." In particular, using performance metrics will help program managers and their sponsors understand how well a program is performing, where and why a program has problems, and tailor actions to eliminate the problems. This will, in turn, improve the program and bring it closer to its goals. Therefore, devising and employing appropriate metrics should aim to improve business results of the organization.
Program metrics not only measure the health of individual programs but also show the effectiveness of program management-related processes, such as strategic management and portfolio management. In this manner, program management metrics are an effective means to integrate and synchronize strategic, portfolio, planning, and execution activities.
We first explain detailed reasons why a program manager needs to utilize metrics with a description of the design requirements for metrics, or what kinds of metrics are needed. We then present the program management value pyramid (PMVP) to develop a menu of metrics, which is conceptually grounded in the integrated management system from Chapter 3. After explaining how metrics can help improve business results, we delve into what may be the most important aspect of metrics—customizing metrics to support a company's business strategy. Hence, the purpose of this chapter is to help practicing and prospective senior managers, program managers, and other program stakeholders, accomplish the following objectives:
Understand why program management metrics are needed
Utilize the PMVP to determine the types of metrics to use
Choose value-added program management metrics from a menu of options
Understand how to customize metrics to support a company's business strategy
Business understanding and experience leads to the following question:What is the business rationale for using metrics?
There are at least two logical and often cited reasons for using metrics, with one less obvious reason explained later. First, as stated earlier, what gets measured gets improved. Second, metrics measure performance toward the achievement of the business results intended, as well as other program critical success factors.
Metrics measure achievement of the critical success factors of the program. Programs using comprehensive metrics to measure and monitor performance will have fewer problems, hence, higher success in accomplishment of program goals. For example, recent studies cite metrics as a key to programs and project success.[105] Additionally, a recent study by one of the authors involving 229 programs and projects found that companies using consistent, tiered, balanced, and mutually aligned metrics outperformed companies who used sporadic, nontiered, schedule-oriented, and nonaligned metrics. The use of program metrics is an institutionalized practice of leading companies. They focus on regular, periodic measurements of program and business performance. Other companies still favor schedule-only metrics that are sporadically utilized, normally when a program is in trouble. Additionally, leading companies do not apply the same metrics throughout the PLC.[106] Programs have different priorities and emphases in different phases of the life cycle of the program.
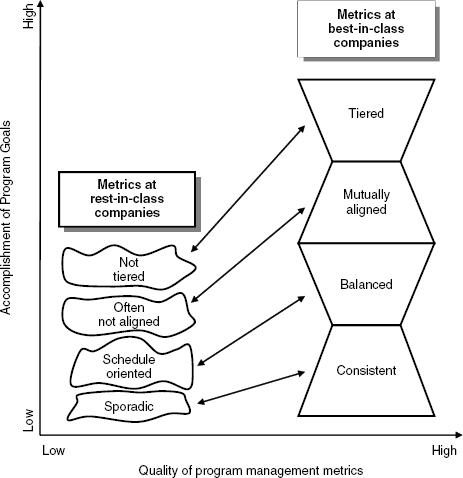
Figure 9.1 demonstrates the key differences between companies that methodically design their set of program metrics (which we refer to as best-in-class companies). There are also those that take an ad hoc approach (which we refer to as rest-in-class companies). Best-in-class companies experience both a higher rate of program goal accomplishment and produce a higher-quality metric set—quality that is quantified by usefulness.
A detailed comparison between the best-in-class and rest-in-class companies revealed that the best companies engineered and installed a system of metrics that were balanced and mutually aligned. Balanced metrics are those that cover all dimensions of a program, including schedule-oriented metrics, as well as those for financial, customer, process, and human resource utilization. Balanced metrics also include both leading and lagging metrics. Leading metrics are forward looking, such as a projected finish date based upon the rate of milestone completion. Lagging metrics, such as percentage of deliverables completed, are most valuable for a retrospective view of program performance. Both leading and lagging metrics are important and useful.
Mutually aligned means that metrics are compatible, using the same baseline information. For example, performance-to-planned schedule, probability of completing the program by a certain date, and the cumulative percentage of milestones that are accomplished are all based on the same baseline—the program schedule.
Literature claims that this behavior, using balanced and mutually aligned metrics, is not by chance but by design and is aimed toward enhancing success in terms of accomplishing the program goals.[107] Consequently, best-in-class companies translate program success criteria into specific metrics the program team can act on and also create incentives for accomplishment of the metrics. For example, the executive team at Lucent Technologies studies the best time-to-market performance measures in the industry, which are turned into targets for their own teams to beat. This is a culture of continual improvement by making program targets highly aggressive.[108]
To reflect how metrics vary, successful companies create metric tiers. Tiering allows the companies to categorize a diverse continuum of programs and projects, while concentrating on crucial features. One company uses the following three tiers for its research and development programs: basic research programs (tier 1), technology development programs (tier 2), and specific programs (tier 3). Quality of the research and percent of goal fulfillment are examples of tier-1 metrics. Number of deployable technologies and breakeven after release exemplify tier-2 metrics. When it comes to tier 3, good examples are the number of customers who found defects and time to market.
In summary, best-in-class organizations carefully build metrics systems that align program execution with the organization's business strategy. In that effort, the emphasis is on using metrics to measure performance on a consistent basis from inception to completion of the program. They insist on measuring multiple facets, balancing metrics to obtain a holistic picture of program health, and selecting metrics that are aligned and compatible. Finally, by dividing metrics into tiers, leading companies define metrics for use by all levels of management.
This brings us to the third, and less obvious, reason for using program management metrics. One of the most fundamental duties of senior management is to account for, and use as effectively as possible, the corporate assets which he or she oversees. To date, senior managers have not designed a methodology that enables satisfactory evaluation of their program management assets, except in a passive fiduciary way. Hence, top corporate managers have limited capability to evaluate one of the strongest competitive weapons a corporation may build—its program management discipline.
The real value of the program management discipline is only obvious when we take a close look at the role program management plays in the development of product, service, or infrastructure capabilities. However, one cannot judge the intrinsic value of program management by just looking at the value of recently developed new products, services, or infrastructure capabilities. Measuring program management performance and effectiveness requires a shared understanding between all stakeholders and their participation in the evaluation process. Participative roles will vary between stakeholders, but, in general, only a high level of interaction between these members can lead to the establishment of credible metrics of value-producing performance.
We have constructed an approach that enables stakeholders to get involved in a relevant and direct fashion to ensure that program management performance and effectiveness are adequately measured—the PMVP. All stakeholders, including CEOs, senior management, program management directors, functional managers, program managers, and project managers will all benefit from use of the PMVP.
In Chapter 3, we explained the integrated management system and its subsystems that describe the program management capability of a company—strategic management, portfolio management, program management, project management, and team execution. The subsystems are used to build the PMVP, as shown Figure 9.2 Metrics related to each subsystem allow the PMVP to serve as a tool to analyze the performance of the program management function and to be used as a guide for continual improvement efforts.
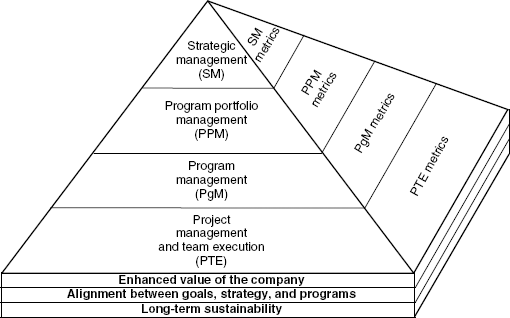
The PMVP's foundation is built upon three premises that should be in place to create and sustain program management as a competitive advantage for an enterprise:
The program management discipline should enhance the value of the firm.
There must be alignment between the firm's business goals, strategies, and programs.
The program management discipline is sustainable over the long term to continuously generate useful products, services, or infrastructure capabilities.
These premises indicate the following: First, the ability of program management to create value for the corporation should be measurable; second, how well programs and program management are aligned with the business goals and strategies should be measurable; and third, how well program management executes its function should be measurable. If program management performance can be effectively measured in these areas, one has the ability to evaluate the overall value of program management within the firm.
The bottom level of the pyramid, project management and team execution, contains the tactical elements of the PMVP. As explained in Chapter 3, project management and team execution form the basis for planning, implementing, and delivering the interdependent elements of the product, service, or infrastructure capability. This is where the hands-on work gets completed. The functional project managers are responsible for the detailed planning and execution of the project deliverables pertaining to their respective operating functions (for example, hardware engineering, software engineering, and marketing). Metrics that assess the adequacy of the tactical elements would be those that permit measurement of parameters, which are important to practices that support the program management capability.
The second level in the pyramid relates to program management. As described in Chapter 3, it is not by accident that program management is in the center of the integrated management system and PMVP. Program Management is the "glue" that translates business strategic objectives into tangible products, services, or infrastructures that are developed by integrating the work efforts and deliverables of multiple project teams. Effective program management metrics focus on the program's ability to transcend across strategic planning and execution.
The third level is program portfolio management. Portfolio management is an effective process for choosing the most valuable programs, balancing and prioritizing them, and making sure they are aligned with the strategic goals of a company. Various metrics are available for evaluating the effectiveness of the portfolio management process within an organization.
The highest level of the PMVP is strategic management. This level deals with the question of whether program management is a viable part of a company's business goals and strategy. Some appropriate metrics are covered in the PMVP that can be used to answer this question.
Table 9.1 presents a menu of the most commonly used metrics for each level of the PMVP, as they pertain to program management. The metrics are categorized by what is being measured (financial return, strategic alignment, and so on) and by the PMVP level (strategic management, portfolio management, and program management, and project management). A single metric may relate to more than one PMVP level, which is indicated in the table.
Table 9.1. Program Management Menu of Metrics
Metric | Definition | Usage |
|---|---|---|
1. Projected value of the program road map | ||
PMVP Level: Strategic Management and Program Management | ||
Dollar sales from program road map | Fraction of future sales by year projected from programs on the program road map over multiple years; the probability of accomplishing each program goal is also provided. | Many companies tend to project future sales and income from programs on the road map. The cumulative value of these programs is equal to the value of the program road map in total. When this is taken seriously, assumptions about probability of projections and related sales/income are taken seriously too. That means biases for individual programs that affect the assessment are not allowed. |
Projected future income from program road map | Fraction of future net income by year projected from programs on the program roadmap over multiple years; the probability times the net income for accomplishing each program goal should also be provided. | The forecasts (leading metrics) of the measures are made quarterly and are compared to the original forecasts. |
2. Strategic alignment of programs | ||
PMVP Level: Strategic Management and Program Portfolio Management | ||
Alignment of programs to business-unit strategic goals | Percentage of total program portfolio that is compatible with documented business-unit strategic goals. | It appears difficult to find a program that does not support specific business-unit goals. But if so, an explanation should be provided. This is a lagging metric. |
3. Program portfolio distribution | ||
PMVP Level: Program Portfolio Management | ||
Program portfolio distribution | A way to express fractions of the total program portfolio among various dimensions that are important to program stakeholders. | The intent of these metrics is to ensure that program investments are well balanced among various dimensions. These lagging metrics should show balance across dimensions. If the programs are not in balance, the metrics help determine how to modify the program portfolio. |
For senior management, the following list shows how programs within the portfolio are distributed | ||
| ||
For directors of program management, the following list shows how programs are distributed:
| ||
4. Portfolio risk | ||
PMVP Level: Program Portfolio Management | ||
Portfolio risk index | The total risk associated with all programs in a company's portfolio. | This is an emerging leading metric—not standardized, not universally recognized as a metric, and probably needs some time to reach an accepted form and formula but valuable |
Two often used forms are as follows:
| The additive form assumes that individual program risks are independent of one another, which is not true. The multiplicative form assumes that individual program risks depend on one another. That means, for example, that a risk occurring in one program may trigger a risk in another program. | |
5. Customer satisfaction surveys | ||
PMVP Level: Program Portfolio Management and Program Management | ||
External | Average value of ratings given by key external customers, on a Likert scale of 1 to 5, with 5 being the highest value. It measures various dimensions such as timeliness of the program completion and customer value of the program output. | External customer surveys about program performance, service, quality, and competence of personnel provides a lot of information about customer satisfaction. |
Internal | The same average value of ratings for internal customers such as engineering, marketing, etc. An example is timeliness of deliverables. | Similarly, internal customer surveys are important to understand satisfaction of internal customers in the program. To paraphrase an executive, external customer satisfaction begins with internal customer satisfaction. |
6. Profitability index | ||
PMVP Level: Program Portfolio Management and Program Management | ||
Portfolio profitability index | The portfolio profitability index is the net-present value of all expected cash flows for the future in all portfolio programs, it is divided by initial cash investment into the program portfolio. | The profitability index is also known as the benefit-cost ratio. Typically, this metric is used as a program selection tool. Once a program is selected, companies periodically reestimate the index to see if the program is still promising. If it is not, the program may be terminated. |
Program profitability index | The program profitability index is the net-present value of all expected cash flows for a future program; it is divided by initial cash investment of the program. | In a program selection process, if an index is greater than one for a program, it means the program may make more profits than it costs—in which case the program becomes a candidate for acceptance. |
Some companies estimate the index to visualize the profitability of the entire portfolio. If the index value is greater then one, the portfolio as a whole will make money. This metric may help to set the direction for modifying the portfolio and adding more profitable programs. | ||
The forecasts of the metrics are made monthly or quarterly (these are of the leading nature) and compared to the original forecasts. The actual values of the metrics are lagging. | ||
7. Milestone completion | ||
PMVP Level: Program Portfolio Management, Program Management, and Project Management | ||
Percent of the program milestones accomplished | The percent of all program milestones in the portfolio of programs achieved within a week of projected achievement date (or within appropriate time for an industry). | A good leading metric to reflect the in-process timelines of the program portfolio, individual programs, and projects within a program. The metric acts as an early warning signal for a company's time management system. For example, having this metric at the level of 40 percent, may mean that a lot of final program completion dates will be missed and other cycle-time dates will be delayed. It takes some time for a company to learn what levels of the metric can be tolerated. For example, one company considers any value of the metric below 80 percent unacceptable. |
Percent of program milestones accomplished | The percent of all milestones in a program achieved within a specified time period of the projected achievement date. | |
Percent of project milestones accomplished | The percent of all milestones in a project achieved within a specified time period of the projected achievement date. | |
8. Development system adoption | ||
PMVP Level: Program Management and Project Management | ||
Program development system adoption | The percentage of programs and the projects making up a program in the total portfolio; this follows the established program management system that has standard decision checkpoints. | This lagging metric determines the percentage of the company utilizing a common development system. The metric value will be dependent upon the expected adoption strategy of the company. If, for example, the company includes technology development programs, the metric value will be small because many technology development programs are exploratory and commonly do not follow a standard development system. |
9. Product, service, or infrastructure quality | ||
PMVP Level: Strategic Management, Program Management and Project Management | ||
Reliability/defect rate assessment | At the company level, it is the percentage of the company's product, service, or infrastructure output that meets or exceeds the accepted quality standards. | Each company will have its own style of measurement. These lagging metrics serve the purpose of knowing the level of quality provided to customers. |
At the program level, percentage of a program's output that meets or exceeds the accepted quality standards. | ||
At the project level, percentage of a project's output that meets or exceeds the accepted quality standards. | ||
Customer fall out | At the company level, a fraction of the company's product, service, or infrastructure output that has defects captured by customers. | |
At the program and project level, a fraction of a program's output that has defects captured by customers. | ||
10. Program cycle time | ||
PMVP Level: Program Management | ||
Program time to market | The time between the point when the customer's need was identified until the point when commercial sales or use of the program output begins. | These are all classic lagging metrics. The first one is used to measure how fast the program reaches the phase of commercialization or implementation. |
Program development time | The time between the point when the program was established until the point when the launch or go-live decision is made. | This metric was established to measure achievement of the speed of program results promised in the program business case. |
Program time to results | The elapsed time from the point when a program was established until the point when results (such as market share or cost-reduction goals) from the program business plan are achieved. | Typically used by the real fans of fast time-to-market philosophy. Attempting to achieve fast time to profit brings a risk of focusing on programs that can have fast time to profit, such as derivative programs, and ignoring programs that are more risky and typically not as fast, such as breakthrough programs. |
Program time to profit | The elapsed time from the point when a program was established until the point when the profit goals of the program are achieved. | Another speed metric focusing on how fast the program investment was recouped and first profits were made. |
Program time to breakeven | The elapsed time from the point when a program is established until the point when all program investments are equal to the program net income. | The beginning of program implementation denotes the point when the program begins to incur expenditures for labor and materials. As the program progresses through its life cycle, it continues to incur expenditures. When the net income from the sales (or cost savings) from the output becomes equal to the expenditures for development and production, the point of breakeven is reached. The logic is that shorter time to breakeven equates to faster recuperation of the program expenditures. |
11. Profit margin | ||
PMVP Level: Program Management | ||
Gross profit margin | Gross profit is a percentage of sales for program products. | These are leading indicators, in which forecasts of the profit margins are made periodically and compared to the original forecasts. The actual profit margin values are lagging metrics. |
Net profit margin | Net profit margin is equal to net sales minus cost of goods sold. | |
12. Market share | ||
PMVP Level: Program Management | ||
Market share | The percentage of the market that will buy or use the output of a program. The probability of accomplishing that market share goal should also be given consideration. | All projections must be done with a clear understanding of assumptions behind probabilities. Personal biases in favor or against the program should not be allowed to affect the probabilities. |
The forecasts of the metrics are made periodically (leading metrics) and compared to the original forecasts. The actual values of the metrics are lagging. | ||
13. Resource Management | ||
PMVP Level: Program Management and Project Management | ||
Program staffing level | Number of actual person hours per program (over a specific period) divided by the planned number of person hours over the same period. | These metrics will measure if a program and its projects are staffed for success and address the practice of understaffing programs. Ideally, the value of these metrics is one (all planned resources are actually assigned to a program), assuming that the planned number of the resources was accurate. |
Project staffing level | Number of actual person hours per project (over a specific period) divided by the planned number of person hours over the same period. | These metrics do not indicate if the program is staffed with people who have the appropriate skills and experience. |
14. Program cost | ||
PMVP Level: Program Management and Project Management | ||
Program development cost | Total cost of a program from formal initiation to launch or go live. This metric includes all costs associated with the development, including nonrecurring engineering, design, and development labor in all operating functions participating in the program—all parts and materials used during development and any associated indirect and allocated costs deemed appropriate by the accounting department, in accordance with generally accepted accounting practices. | This metric is useful in calculating the financial returns on the program. Additionally, tracking the development cost of each program and the total for all programs; this assists senior management with managing overall development spending to the available budget set by the firm. |
Manufacturing cost | This reflects the total cost to manufacture a product or capability. It includes the labor, materials, overhead, and any designated company allocations of indirect costs deemed appropriate by the accounting department, in accordance with generally accepted accounting principles. | This metric is used together with the rest of the costs and benefits to determine the overall financial returns on the program. It also helps senior management determine future continual improvement efforts to drive further margin and profitability gains on the product. |
Nonrecurring engineering cost | This represents that portion of the total development cost related to the direct engineering and design effort for a specific new product, service, or infrastructure capability. This measure does not include any follow-on engineering effort that is applied for sustaining or support. | This is a useful metric to assist senior management with managing the effective usage of resources and budget. Also, by monitoring this at the program level and in total for the organization, management can ensure that the available dollars and resources are applied to the highest-priority programs based upon the firm's business objectives and strategy. |
15. Technology innovation | ||
PMVP Level: Program Management | ||
Percentage of technologies new to the world | The fraction of technologies in the program output that are new to the external ecosystem, including customers and competitors. | These metrics measure the technical complexity and technical risk of a program. The higher the percentage, the greater the technical complexity and risk. They also give an indication of the technical competitive advantage that a program may provide. |
Percentage of technologies new to the company | The fraction of technologies in the program output that are new to the company. | |
The menu was developed from our experience with specific companies; therefore, it is not a comprehensive list of all possible metrics. Rather, we present metrics that we have found to be the most generally representative and useful for the managerial functions in the PMVP.
The heading in column one of the table, metric, identifies the metric being presented; the heading in column two, definition, provides the definition of each metric; and the heading in column three, usage, explains the purpose and how to use the metric.
In practical terms, it is highly unlikely that any one firm would, or could, use all the metrics presented in Table 9.1. It is presented as a menu of metrics. The listing should be seen as a restaurant menu that presents many dining options. From a restaurant menu you choose and order only a subset of the available menu items—seldom all of them. Similarly, from the menu of metrics you choose only those metrics that you need. We will explain later how to customize a metrics set for a specific company's needs.
We'd like to remind the reader once again that Table 9.1 is a menu of common metrics used in practice and does not represent that all the metrics should be used on a program. Each senior management team and PCT must select a set of metrics for their particular measurement needs. A common question we are asked is how many metrics do we need? The answer to this question is that it depends. A study by Business Week and The Boston Group shows that the sweet spot is somewhere between 8 and 12 metrics, which was Chu Woosik, a senior vice president of Samsung Electronics confirmed.[109] See the box titled, "How Many Metrics Do You Need?" for additional guidance.
In developing the PMVP, our focus was on those measurements that relate to program management's contribution to building and sustaining a business-unit's competitive advantage and the improvement of business results. The PMVP provides a holistic approach for evaluating the strategy for obtaining business objectives, how well a company's development funds are invested, the value of program management to the company, the effectiveness of program management practices, and how individual programs are progressing.
The PMVP is designed to function in a top-down fashion, level by level, to create a balanced and aligned set of metrics that cover multiple dimensions of product, service, or infrastructure development. The value pyramid is also a dynamic model, meaning the metrics set created will dynamically change as a program progresses through the development life cycle, as different metrics are needed at different points in the life cycle.
The PMVP is applicable to both centralized and decentralized forms of program management structure. In a centralized form of program management, there exists an organizational home for all or a majority of program managers. In this case, the use of the PMVP will be determined between the director of program management and senior management, and the commonality of metrics across programs is established. The decentralized form means that all or a majority of the program managers are assigned to one or more business units, and metrics will be based upon the specific business needs of the business unit.
The PMVP is an effective tool for measuring and guiding continual improvement in an organization. However, utilizing the PMVP does not mean automatic improvement. Metrics can only provide data. It is up to the senior management team of a business to interpret the data presented by the metrics and turn it into information that can be used to develop the necessary improvement actions. Let's look at some of the key questions and considerations for management at each level of the PMVP.
At the top of the pyramid is the strategic management domain along with the firm's business objectives. This level is, therefore, the primary driver of the PMVP. Strategic management metrics are used as an input for business planning, management reviews, and for addressing the following questions:
Will the current portfolio of programs achieve the strategic objectives?
What is the cost/benefit ratio for achieving the strategic objectives?
How long will it take to achieve the strategic objectives?
Are we getting returns on program management as we expect?
Strategic management metrics related to program management are solid indicators of the return the business is gaining from using a program management model, whether enough is being spent on program management and if the business can expect to receive further positive returns from program management.
When a business designs a balanced and prioritized portfolio of programs, if develops the strategy for achieving the key business objectives it has defined. Additionally, by converting the portfolio into a program road map, it further develops the strategy by creating a time-phased plan for achieving the objectives.
Metrics that measure the effectiveness of program portfolio management generally indicate if a business's development dollars are invested properly for achievement of the business returns desired. They also indicate how the investment is balanced across multiple dimensions such as reward versus risk and new versus core technologies.
Program management practices are a mirror of the culture of the program management organization and are risky to neglect. Like any cultural element, they can degrade or improve quickly. For this reason, program management practices need to be continually monitored and measured to become and remain a competitive weapon for an organization.
These metrics measure the program-level practices of the program management discipline within an organization. They are designed to give a business an indication of whether program management is helping to achieve its goals, if programs are cost effective, and if quality and customer satisfaction is sufficient. These metrics also indicate the effectiveness of the program management discipline by measuring elements such as whether the program management acumen and core competencies are improving or declining within a business.
Program management metrics also measure the performance of the program team on a particular program and give the program manager and his or her senior management team an indication of whether the program will attain its critical success factors.
Project management and team execution helps deliver critical elements of the integrated management system and subsystems of the whole product. These metrics measure the hands-on performance of the project teams. The functional project managers are responsible for the detailed planning and execution of the project deliverables pertaining to their respective operating functions. Each project manager, along with his or her respective functional team specialists, will develop a specific project plan and project schedule, budget, and performance goals. Project metrics are designed and used to measure the functional team performance to the goals. Additionally, metrics used to measure the effectiveness of the cross-project coordination and collaboration are also needed at both the project and program levels.
As we mentioned earlier, each company will need a distinct set of metrics, depending on its business strategy. Therefore, the set of metrics will vary by the type of industry the company is part of and by its business strategy (for example, differentiation, cost leadership, or best cost). The PMVP does not provide a mechanism to automatically indicate which metrics to choose; this is the job of senior management.
When a business unit determines its own distinct set of metrics, it should do so in collaboration with company stakeholders. As noted in the following list, each stakeholder will emphasize different metrics, according to their needs:
The board of directors, financial community, and CEO will primarily be interested in the strategic metrics. See the box titled, "I Have Only Three Minutes a Month" for an example of the metrics one CEO wanted to see.
Business management will show a strong interest in metrics that assess the strategic health of the business unit, the alignment of development programs with the business strategy, and the balance of the program portfolio relative to the business unit needs.
Program management directors will be concerned with metrics from all levels of the PMVP pyramid, with most interest in metrics assessing the portfolio of programs and the management of individual programs.
Members of the PCT and project teams will be most keenly interested in metrics about project management and team execution.
In addition to selecting from a set of metrics, thought has to be given to how all metrics from the various levels of the PMVP interconnect and which are compatible with one another. It is the job of the senior stakeholders of the business to provide the interconnection and alignment strategy of the set of metrics. Let's be reminded that business strategy dictates the configuration and focus of a company's program management function. This means that each element of program management needs to be aligned with the business strategy—program management metrics included. To illustrate, we'll look at three companies with three different business strategies as defined by Porter's model, and demonstrate how the strategy drives the selection of the metrics.[110] Company A in Table 9.2 utilizes a differentiation strategy to offer its customers something different from their competitors. In particular, Company A focuses on technology innovation and fast time to market to achieve differentiation and gain higher profits and market share. Secondarily, Company A strives to achieve high quality and doesn't allow runaway cost. To measure performance to their strategy, Company A selects metrics for measuring time to market, percentage of new technologies developed, profitability index, and market share. Additionally, they choose customer fall out and development cost metrics to measure their secondary strategy of providing high quality and cost containment.
Company B focuses on a low-cost strategy aimed at establishing a sustainable cost advantage over its rivals. The intent is to use the low-cost advantage as a way of underpricing rivals and capturing market share. This strategy will leave company B with a small-profit gross margin per product, but profit can be achieved through a large volume of sales and lean staffing. Metrics to support this business strategy should measure development and manufacturing cost, market share, program-staffing level, gross profit margin, and sales volume. Secondary objectives are to bring the product to the market in an average industry standard time and with an average quality. This is complemented with the second priority metrics of development time and defect assessment rate.
The best-cost strategy pursued by Company C combines upscale features with low cost. Company C aims to become a low-cost provider of IT products that have high-quality features. A secondary strategy is to develop innovative information technologies within reasonable time frames. Primary metrics to measure this strategy should include defect rate assessment, customer fall out, development cost, and manufacturing cost. Secondary metrics could include percent of new technologies developed and development time.
Table 9.2. Strategy drives metric selection
Company A | Company B | Company C | |
|---|---|---|---|
Company Business | High-tech electronics | Conventional manufacturing | Automobile company IT |
Business Strategy | Differentiation | Cost leadership | Best cost |
Type of programs | New product development | New product development | Infrastructure development |
First Priority | |||
Metrics | Time to market | Development cost | Defect rate assessment |
Percentage of new technologies developed | Manufacturing cost | Customer fall out | |
Profitability index Market share | Market share Staffing level | Development cost Manufacturing cost | |
Gross profit margin Sales volume | |||
Second Priority | |||
Customer fall out | Development time | Development time | |
Manufacturing cost | Defect rate assessment | Percent of new technologies to company | |
Development cost | |||
These examples illustrate how business strategy drives the choice of metrics. We showed only three examples of companies with different strategies and the corresponding sets of metrics chosen. Each company in the world will have its own unique business strategy and set of metrics to measure the effectiveness and achievement of its strategy (see box titled, "The Control Chart as a Metric for Program Team Charter").
All metrics should help improve business results. To demonstrate this point, we choose and evaluate the use of a set of metrics from the PMVP, as follows: 1)Projected future income from program road map from the strategic management and portfolio management levels, 2) portfolio risk index from the portfolio management level, and 3)percentage of program milestones accomplished from the program management and project management levels.
Projected future income from program road map: A metric that shows the fraction of future net income anticipated from programs on the program road map over a multiyear period. For discussion sake, let's assume that the metric shows that the projected income is lower than the stated goal. The question from senior management will then become "why?". A close look at the supporting detail of the metric reveals the income from many programs is low. An even closer look shows that the majority of programs are for derivative products, not new architectures. Derivative products serve to extend the life of a particular product line but do not provide much income due to ever-decreasing profit margin caused by competitive pressures. A deeper analysis shows that the only way to achieve the income goal is to terminate some of the derivative programs with low-revenue generation and shift investment to new platform programs that will provide higher levels of net income. As a result, the use of this metric highlighted a serious flaw in the execution of this organization's business strategy and helped to resolve it, leading to improved business results in the form of higher-net income and profit.
Portfolio risk index: A program portfolio-management level metric indicating the total risk of all programs in a company's portfolio. For example, let's say that the portfolio risk index indicates a low-risk level for a business unit's portfolio. The conventional wisdom tells us that it is good to keep risk levels as low as possible. But it also says that low risk typically means low gains. Further analysis of the portfolio shows that most of the individual programs face low risk and low-projected profits. These types of programs are commonly called "bread-and-butter" programs. They are typically the mainstream of a business, use existing technology, and target markets and customers that are well known. The portfolio team realized that they were selling their future by doing mainly bread-and-butter programs. To invest in the future, the company needed to terminate some of these programs and instead invest in programs that create new technologies, bring higher-profit margins, and are also more risky. This metric demonstrated an unbalanced portfolio (in terms of risk) and helped the company choose a different program portfolio that promised improved business results in the form of higher profits and new products and markets.
Percentage of program milestones accomplished: A metric that indicates percent of all milestones in a program achieved within a specified time period (such as a week) of the projected achievement date. To understand how it can help improve business results, let us look at an example of a program schedule that is structured with 300-lower-level milestones over the 11-month program duration. The first month does not have any milestones; the remaining 10 months have 30 milestones each. At the end of the third month of the program, only 40 percent of the 60 milestones planned to that point were accomplished. What does this indicate? This metric shows that the rate of milestone completion was poor compared to the plan, and that the final program completion date is likely to be significantly delayed. This is an early warning signal for management to take comprehensive corrective actions that will lead to timely completion of the program. This metric's function is to warn the business insert problems in the management of the program schedule so that corrective actions can be implemented to remove the barriers and achieve the business results intended.
The purpose of metrics is to help improve business results of the organization. To serve this purpose, metrics need to be carefully developed to ensure they are compatible (or mutually aligned), balanced, consistently utilized, and tiered.
We provide a menu of commonly used program metrics that can be configured as a customized set of metrics by the management team of a business. Each business should construct its set of metrics based upon its business strategy and the specific industry in which it operates.
One convenient way to visualize a system of metrics is the PMVP that has the following four levels: strategic management, program portfolio management, program management, and project management and team execution. This pyramid provides an integrated and holistic approach for selecting and utilizing a metrics set, which evaluates the performance of the four levels of the integrated management system.
[105] Hauser, J. and F. Zettelmeyer, "Metrics to evaluate R&D",Sloan Working Paper # 3934, MIT, (October 1996).
[106] Tipping, J. W., E. Zeffren, et al.,"Assessing the Value of Your Technology", Research Technology Management, Vol. 38, No. 5 (1995): 22–39.
[107] Hauser, J. and F. Zettelmeyer, "Metrics to evaluate R&D", Sloan Working Paper # 3934, MIT, (October 1996).
[108] Meyer, Chris. "How The Right Measures Help Teams Excel",Harvard Business Review (May–June 1994): pp. 95–103.
[109] McGregor, Jena. "The World's Most Innovative Companies", Business Week Online (April 24, 2006).
[110] Porter, M. E., Competitive Strategy: Techniques for Analyzing Industries and Competitors, 1st edition. New York, NY: Free Press Publishers, 1998.