Chapter 7
Debugging and Error Handling
Wrox.com Code Downloads for this Chapter
You can find the wrox.com code downloads for this chapter at www.wrox.com/go/beginningvisualc#2015programming on the Download Code tab. The code is in the Chapter 7 download and individually named according to the names throughout the chapter.
So far this book has covered all the basics of simple programming in C#. Before you move on to object-oriented programming in the next part, you need to look at debugging and error handling in C# code.
Errors in code are something that will always be with you. No matter how good a programmer is, problems will always slip through, and part of being a good programmer is realizing this and being prepared to deal with it. Of course, some problems are minor and don't affect the execution of an application, such as a spelling mistake on a button, but glaring errors are also possible, including those that cause applications to fail completely (usually known as fatal errors). Fatal errors include simple errors in code that prevent compilation (syntax errors), or more serious problems that occur only at runtime. Some errors are subtle. Perhaps your application fails to add a record to a database because a requested field is missing, or adds a record with the wrong data in other restricted circumstances. Errors such as these, where application logic is in some way flawed, are known as semantic errors or logic errors.
Often, you won't know about these subtle errors until a user complains that something isn't working properly. This leaves you with the task of tracing through your code to find out what's happening and fixing it so that it does what it was intended to do. In these situations, the debugging capabilities of Visual Studio are a fantastic help. The first part of this chapter looks at some of the techniques available and applies them to some common problems.
Then, you'll learn the error-handling techniques available in C#. These enable you to take precautions in cases where errors are likely, and to write code that is resilient enough to cope with errors that might otherwise be fatal. The techniques are part of the C# language, rather than a debugging feature, but the IDE provides some tools to help you here too.
Debugging in Visual Studio
Earlier, you learned that you can execute applications in two ways: with debugging enabled or without debugging enabled. By default, when you execute an application from Visual Studio (VS), it executes with debugging enabled. This happens, for example, when you press F5 or click the green Start arrow in the toolbar. To execute an application without debugging enabled, choose Debug ![]() Start Without Debugging, or press Ctrl+F5.
Start Without Debugging, or press Ctrl+F5.
Visual Studio allows you to build applications in numerous configurations, including Debug (the default) and Release. You can switch between these configurations using the Solution Configurations drop-down menu in the Standard toolbar.
When you build an application in debug configuration and execute it in debug mode, more is going on than the execution of your code. Debug builds maintain symbolic information about your application, so that the IDE knows exactly what is happening as each line of code is executed. Symbolic information means keeping track of, for example, the names of variables used in uncompiled code, so they can be matched to the values in the compiled machine code application, which won't contain such human-readable information. This information is contained in .pdb files, which you may have seen in your computer's Debug directories.
In the release configuration, application code is optimized, and you cannot perform these operations. However, release builds also run faster; when you have finished developing an application, you will typically supply users with release builds because they won't require the symbolic information that debug builds include.
This section describes debugging techniques you can use to identify and fix areas of code that don't work as expected, a process known as debugging. The techniques are grouped into two sections according to how they are used. In general, debugging is performed either by interrupting program execution or by making notes for later analysis. In Visual Studio terms, an application is either running or in break mode — that is, normal execution is halted. You'll look at the nonbreak mode (runtime or normal) techniques first.
Debugging in Nonbreak (Normal) Mode
One of the commands you've been using throughout this book is the WriteLine()function, which outputs text to the console. As you are developing applications, this function comes in handy for getting extra feedback about operations:
WriteLine("MyFunc() Function about to be called.");
MyFunc("Do something.");
WriteLine("MyFunc() Function execution completed.");
This code snippet shows how you can get extra information concerning a function called MyFunc(). This is all very well, but it can make your console output a bit cluttered; and when you develop other types of applications, such as desktop applications, you won't have a console to output information to. As an alternative, you can output text to a separate location — the Output window in the IDE.
Chapter 2, which describes the Error List window, mentions that other windows can also be displayed in the same place. One of these, the Output window, can be very useful for debugging. To display this window, select View ![]() Output. This window provides information related to compilation and execution of code, including errors encountered during compilation. You can also use this window, shown in Figure 7.1, to display custom diagnostic information by writing to it directly.
Output. This window provides information related to compilation and execution of code, including errors encountered during compilation. You can also use this window, shown in Figure 7.1, to display custom diagnostic information by writing to it directly.

Alternatively, you might want to create a logging file, which has information appended to it when your application is executed. The techniques for doing this are much the same as those for writing text to the Output window, although the process requires an understanding of how to access the filesystem from C# applications. For now, leave that functionality on the back burner because there is plenty you can do without getting bogged down by file-access techniques.
Outputting Debugging Information
Writing text to the Output window at runtime is easy. You simply replace calls to WriteLine() with the required call to write text where you want it. There are two commands you can use to do this:
Debug.WriteLine()Trace.WriteLine()
These commands function in almost exactly the same way, with one key difference — the first command works in debug builds only; the latter works for release builds as well. In fact, the Debug.WriteLine() command won't even be compiled into a release build; it just disappears, which certainly has its advantages (the compiled code will be smaller, for one thing).
These functions don't work exactly like WriteLine(). They work with only a single string parameter for the message to output, rather than letting you insert variable values using {X} syntax. This means you must use an alternative technique to embed variable values in strings — for example, the + concatenation operator. You can also (optionally) supply a second string parameter, which displays a category for the output text. This enables you to see at a glance which output messages are displayed in the Output window, which is useful when similar messages are output from different places in the application.
The general output of these functions is as follows:
<category>: <message>For example, the following statement, which has "MyFunc" as the optional category parameter,
Debug.WriteLine("Added 1 to i", "MyFunc");MyFunc: Added 1 to iThe next Try It Out demonstrates outputting debugging information in this way.
Tracepoints
An alternative to writing information to the Output window is to use tracepoints. These are a feature of Visual Studio, rather than C#, but they serve the same function as using Debug.WriteLine(). Essentially, they enable you to output debugging information without modifying your code.
To demonstrate tracepoints, you can use them to replace the debugging commands in the previous example. (See the Ch07Ex01TracePoints file in the downloadable code for this chapter.) The process for adding a tracepoint is as follows:
- Position the cursor at the line where you want the tracepoint to be inserted. The tracepoint will be processed before this line of code is executed.
- Right-click the line of code and select Breakpoint
 Insert Tracepoint. Right-click the red circle placed next to the line of code and select the Settings menu item.
 - Check the Actions checkbox and type the string to be output in the Message text box in the Log a message section. If you want to output variable values, enclose the variable name in curly braces.
- Click OK. A red diamond appears to the left of the line of code containing a tracepoint, and the line of code itself is shown in red.
As implied by the title of the dialog box for adding tracepoints and the menu selections required for them, tracepoints are a form of breakpoint (and can cause application execution to pause, just like a breakpoint, if desired). You look at breakpoints, which typically serve a more advanced debugging purpose, a little later in the chapter.
Figure 7.4 shows the tracepoint required for line 32 of Ch07Ex01TracePoints, where line numbering applies to the code after the existing Debug.WriteLine() statements have been removed.

There is another window that you can use to quickly see the tracepoints in an application. To display this window, select Debug ![]() Windows
Windows ![]() Breakpoints from the Visual Studio menu. This is a general window for displaying breakpoints (tracepoints, as noted earlier, are a form of breakpoint). You can customize the display to show more tracepoint-specific information by adding the When Hit column from the Columns drop-down in this window. Figure 7.5 shows the display with this column configured and all the tracepoints added to
Breakpoints from the Visual Studio menu. This is a general window for displaying breakpoints (tracepoints, as noted earlier, are a form of breakpoint). You can customize the display to show more tracepoint-specific information by adding the When Hit column from the Columns drop-down in this window. Figure 7.5 shows the display with this column configured and all the tracepoints added to Ch07Ex01TracePoints.

Executing this application in debug mode has the same result as before. You can remove or temporarily disable tracepoints by right-clicking on them in the code window or via the Breakpoints window. In the Breakpoints window, the check box to the left of the tracepoint indicates whether the tracepoint is enabled; disabled tracepoints are unchecked and displayed in the code window as diamond outlines, rather than solid diamonds.
Diagnostics Output Versus Tracepoints
Now that you have seen two methods of outputting essentially the same information, consider the pros and cons of each. First, tracepoints have no equivalent to the Trace commands; that is, there is no way to output information in a release build using tracepoints. This is because tracepoints are not included in your application. Tracepoints are handled by Visual Studio and, as such, do not exist in the compiled version of your application. You will see tracepoints doing something only when your application is running in the Visual Studio debugger.
The chief disadvantage of tracepoints is also their major advantage, which is that they are stored in Visual Studio. This makes them quick and easy to add to your applications as you need them, but also makes them all too easy to delete. Deleting a tracepoint is as simple as clicking on the red diamond indicating its position, which can be annoying if you are outputting a complicated string of information.
One bonus of tracepoints, though, is the additional information that can be easily added, such as $FUNCTION which adds the current function name to the output message. Although this information is available to code written using Debug and Trace commands, it is trickier to obtain. In summary, use these two methods of outputting debug information as follows:
- Diagnostics output — Use when debug output is something you always want to output from an application, particularly when the string you want to output is complex, involving several variables or a lot of information. In addition,
Tracecommands are often the only option should you want output during execution of an application built in release mode. - Tracepoints — Use these when debugging an application to quickly output important information that may help you resolve semantic errors.
Debugging in Break Mode
The rest of the debugging techniques described in this chapter work in break mode. This mode can be entered in several ways, all of which result in the program pausing in some way.
Entering Break Mode
The simplest way to enter break mode is to click the Pause button in the IDE while an application is running. This Pause button is found on the Debug toolbar, which you should add to the toolbars that appear by default in Visual Studio. To do this, right-click in the toolbar area and select Debug. Figure 7.6 shows the Debug toolbar that appears.

The first three buttons on the toolbar allow manual control of breaking. In Figure 7.6, these are grayed out because they don't work with a program that isn't currently executing. The following sections describe the rest of the buttons as needed.
When an application is running, the toolbar changes to look like Figure 7.7.

The three buttons that were grayed out now enable you to do the following:
- Pause the application and enter break mode.
- Stop the application completely (this doesn't enter break mode; it just quits).
- Restart the application.
Pausing the application is perhaps the simplest way to enter break mode, but it doesn't give you fine-grained control over exactly where to stop. You are likely to stop in a natural pause in the application, perhaps where you request user input. You might also be able to enter break mode during a lengthy operation, or a long loop, but the exact stop point is likely to be fairly random. In general, it is far better to use breakpoints.
Breakpoints
A breakpoint is a marker in your source code that triggers automatic entry into break mode. Breakpoints can be configured to do the following:
- Enter break mode immediately when the breakpoint is reached.
- Enter break mode when the breakpoint is reached if a Boolean expression evaluates to
true. - Enter break mode once the breakpoint is reached a set number of times.
- Enter break mode once the breakpoint is reached and a variable value has changed since the last time the breakpoint was reached.
These features are available only in debug builds. If you compile a release build, all breakpoints are ignored.
There are several ways to add breakpoints. To add simple breakpoints that break when a line is reached, just left-click on the far left of the line of code. Alternatively, you can right-click on the line and select Breakpoint ![]() Insert Breakpoint, select Debug
Insert Breakpoint, select Debug ![]() Toggle Breakpoint from the menu, or press F9.
Toggle Breakpoint from the menu, or press F9.
A breakpoint appears as a red circle next to the line of code, which is highlighted, as shown in Figure 7.8.

You can also see information about a file's breakpoints using the Breakpoints window (you saw how to enable this window earlier). You can use the Breakpoints window to disable breakpoints (by removing the tick to the left of a description; a disabled breakpoint shows up as an unfilled red circle), to delete breakpoints, and to edit the properties of breakpoints. You can also add labels to breakpoints, which is a handy way to group selected breakpoints. You can see labels in the Labels column and filter the items shown in this window by label.
The other columns shown in this window, Condition and Hit Count, are only two of the available ones, but they are the most useful. You can edit these by right-clicking a breakpoint (in code or in this window) and selecting Condition or Hit Count.
Selecting Condition opens a dialog box in which you can type any Boolean expression, which may involve any variables in scope at the breakpoint. For example, you could configure a breakpoint that triggers when it is reached and the value of maxVal is greater than 4 by entering the expression "maxVal > 4" and selecting the Is true option. You can also check whether the value of this expression has changed and only trigger the breakpoint then (you might trigger it if maxVal changed from 2 to 6 between breakpoint encounters, for example).
Selecting Hit Count opens a dialog box in which you can specify how many times a breakpoint needs to be hit before it is triggered. A drop-down list offers the following options:
- Break always
- Break when the hit count is equal to
- Break when the hit count is a multiple of
- Break when the hit count is greater than or equal to
The option you choose, combined with the value entered in the text box next to the options, determines the behavior of the breakpoint. The hit count is useful in long loops, when you might want to break after, say, the first 5,000 cycles. It would be a pain to break and restart 5,000 times if you couldn't do this!
Other Ways to Enter Break Mode
There are two more ways to get into break mode. One is to enter it when an unhandled exception is thrown. This subject is covered later in this chapter, when you look at error handling. The other way is to break when an assertion is generated.
Assertions are instructions that can interrupt application execution with a user-defined message. They are often used during application development to test whether things are going smoothly. For example, at some point in your application you might require a given variable to have a value less than 10. You can use an assertion to confirm that this is true, interrupting the program if it isn't. When the assertion occurs, you have the option to Abort, which terminates the application; Retry, which causes break mode to be entered; or Ignore, which causes the application to continue as normal.
As with the debug output functions shown earlier, there are two versions of the assertion function:
Debug.Assert()Trace.Assert()
Again, the debug version is only compiled into debug builds.
These functions take three parameters. The first is a Boolean value, whereby a value of false causes the assertion to trigger. The second and third are string parameters to write information both to a pop-up dialog box and the Output window. The preceding example would need a function call such as the following:
Debug.Assert(myVar < 10, "myVar is 10 or greater.",
             "Assertion occurred in Main().");
Assertions are often useful in the early stages of user adoption of an application. You can distribute release builds of your application containing Trace.Assert()functions to keep tabs on things. Should an assertion be triggered, the user will be informed, and this information can be passed on to you. You can then determine what has gone wrong even if you don't know how it went wrong.
You might, for example, provide a brief description of the error in the first string, with instructions as to what to do next as the second string:
Trace.Assert(myVar < 10, "Variable out of bounds.",
             "Please contact vendor with the error code KCW001.");
Should this assertion occur, the user will see the dialog box shown in Figure 7.9.

Admittedly, this isn't the most user-friendly dialog box in the world, as it contains a lot of information that could confuse users, but if they send you a screenshot of the error, you could quickly track down the problem.
Now it's time to look at what you can actually do after application execution is halted and you are in break mode. In general, you enter break mode to find an error in your code (or to reassure yourself that things are working properly). Once you are in break mode, you can use various techniques, all of which enable you to analyze your code and the exact state of the application at the point in its execution where it is paused.
Monitoring Variable Content
Monitoring variable content is just one example of how Visual Studio helps you a great deal by simplifying things. The easiest way to check the value of a variable is to hover the mouse over its name in the source code while in break mode. A tooltip showing information about the variable appears, including the variable's current value.
You can also highlight entire expressions to get information about their results in the same way. For more complex values, such as arrays, you can even expand values in the tooltip to see individual element entries.
It is possible to pin these tooltip windows to the code view, which can be useful if there is a variable you are particularly interested in. Pinned tooltips persist, so they are available even if you stop and restart debugging. You can also add comments to pinned tooltips, move them around, and see the value of the last variable value, even when the application isn't running.
You may have noticed that when you run an application, the layout of the various windows in the IDE changes. By default, the following changes are likely to occur at runtime (this behavior may vary slightly depending on your installation):
- The Properties window disappears, along with some other windows, probably including the Solution Explorer window.
- The Error List window is replaced with two new windows across the bottom of the IDE window.
- Several new tabs appear in the new windows.
The new screen layout is shown in Figure 7.10. This may not match your display exactly, and some of the tabs and windows may not look exactly the same, but the functionality of these windows as described later will be the same, and this display is customizable via the View and Debug ![]() Windows menus (during break mode), as well as by dragging windows around the screen to reposition them.
Windows menus (during break mode), as well as by dragging windows around the screen to reposition them.

The new window that appears in the bottom-left corner is particularly useful for debugging. It enables you to keep tabs on the values of variables in your application when in break mode:
- Autos — Variables in use in the current and previous statements (Ctrl+D, A)
- Locals — All variables in scope (Ctrl+D, L)
- Watch N — Customizable variable and expression display (where N is 1 to 4, found on Debug Windows Watch)
All these tabs work in more or less the same way, with various additional features depending on their specific function. In general, each tab contains a list of variables, with information on each variable's name, value, and type. More complex variables, such as arrays, may be further examined using the + and – tree expansion/contraction symbols to the left of their names, enabling a tree view of their content. For example, Figure 7.11 shows the Locals tab obtained by placing a breakpoint in the example code. It shows the expanded view for one of the array variables, maxValIndices.

You can also edit the content of variables from this view. This effectively bypasses any other variable assignment that might have happened in earlier code. To do this, simply type a new value into the Value column for the variable you want to edit. You might do this to try out some scenarios that would otherwise require code changes, for example.
The Watch window enables you to monitor specific variables, or expressions involving specific variables. To use this window, type the name of a variable or expression into the Name column and view the results. Note that not all variables in an application are in scope all the time, and are labeled as such in a Watch window. For example, Figure 7.12 shows a Watch window with a few sample variables and expressions in it, obtained when a breakpoint just before the end of the Maxima() function is reached.

The testArray array is local to Main(), so you don't see a value here and it is grayed out.
Stepping through Code
So far, you've learned how to discover what is going on in your applications at the point where break mode is entered. Now it's time to see how you can use the IDE to step through code while remaining in break mode, which enables you to see the exact results of the code being executed. This is an extremely valuable technique for those of us who can't think as fast as computers can.
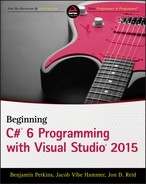
When Visual Studio enters break mode, a yellow arrow cursor appears to the left of the code view (which may initially appear inside the red circle of a breakpoint if a breakpoint was used to enter break mode) next to the line of code that is about to be executed, as shown in Figure 7.13.
![Screenshot of the Visual Studio in break mode and code view displaying the line of code int[] testArray = { 4, 7, 4, 2, 7, 3, 7, 8, 3, 9, 1, 9 }; pointed by the arrow on the left. All int are highlighted.](http://images-20200215.ebookreading.net/22/4/4/9781119096689/9781119096689__beginning-c-60__9781119096689__images__c07f013.jpg)
This shows you what point execution has reached when break mode is entered. At this point, you can execute the program on a line-by-line basis. To do so, you use some of the Debug toolbar buttons shown in Figure 7.14.

The sixth, seventh, and eighth icons control program flow in break mode. In order, they are as follows:
- Step Into — Execute and move to the next statement to execute.
- Step Over — Similar to Step Into, but won't enter nested blocks of code, including functions.
- Step Out — Run to the end of the code block and resume break mode at the statement that follows.
To look at every single operation carried out by the application, you can use Step Into to follow the instructions sequentially. This includes moving inside functions, such as Maxima() in the preceding example. Clicking this icon when the cursor reaches line 17, which is the call to Maxima(), results in the cursor moving to the first line inside the Maxima() function. Alternatively, clicking Step Over when you reach line 17 moves the cursor straight to line 18, without going through the code in Maxima() (although this code is still executed). If you do step into a function that you aren't interested in, you can click Step Out to return to the code that called the function. As you step through code, the values of variables are likely to change. If you keep an eye on the monitoring windows just discussed, you can clearly see this happening.
You can also change which line of code will be executed next by right-clicking on a line of code and selecting Set Next Statement, or by dragging the yellow arrow to a different line of code. This doesn't always work, such as when skipping variable initialization. However, it can be very useful for skipping problematic lines of code to see what will happen, or for repeating the execution of code by moving the arrow backward.
In code that has semantic errors, these techniques may be the most useful ones at your disposal. You can step through code right up to the point where you expect problems to occur, and the errors will be generated as if you were running the program normally. Or you can cause statements to be executed more than once by changing the executing code. Along the way, you can watch the data to see just what is going wrong. Later in this chapter, you'll step through some code to find out what is happening in an example application.
Immediate and Command Windows
The Command and Immediate windows (found on the Debug Windows menu) enable you to execute commands while an application is running. The Command window enables you to perform Visual Studio operations manually (such as menu and toolbar operations), and the Immediate window enables you to execute additional code besides the source code lines being executed, and to evaluate expressions.
These windows are intrinsically linked. You can even switch between them by entering commands — immed to move from the Command window to the Immediate window and cmd to move back.
This section concentrates on the Immediate window because the Command window is only really useful for complex operations. The simplest use of this window is to evaluate expressions, a bit like a one-shot use of the Watch windows. To do this, type an expression and press Return. The information requested will then be displayed. An example is shown in Figure 7.15.
![Screenshot of the Immediate window displaying testArray[3] * 10 and 20.](http://images-20200215.ebookreading.net/22/4/4/9781119096689/9781119096689__beginning-c-60__9781119096689__images__c07f015.jpg)
You can also change variable content here, as demonstrated in Figure 7.16.
![Similar image in Figure 7-15 but with added testArray[3] +=7 and 9.](http://images-20200215.ebookreading.net/22/4/4/9781119096689/9781119096689__beginning-c-60__9781119096689__images__c07f016.jpg)
In most cases, you can get the effects you want more easily using the variable monitoring windows shown earlier, but this technique is still handy for tweaking values, and it's good for testing expressions.
The Call Stack Window
The final window to look at is the Call Stack window, which shows you the way in which the program reached the current location. In simple terms, this means showing the current function along with the function that called it, the function that called that, and so on (that is, a list of nested function calls). The exact points where calls are made are also recorded.
In the earlier example, entering break mode when in Maxima(), or moving into this function using code stepping, reveals the information shown in Figure 7.17.

If you double-click an entry, you are taken to the appropriate location, enabling you to track the way code execution has reached the current point. This window is particularly useful when errors are first detected, because you can see what happened immediately before the error. Where errors occur in commonly used functions, this helps you determine the source of the error.
Error Handling
The first part of this chapter explained how to find and correct errors during application development so that they don't occur in release-level code. Sometimes, however, you know that errors are likely to occur and there is no way to be 100 percent sure that they won't. In those situations, it may be preferable to anticipate problems and write code that is robust enough to deal with these errors gracefully, without interrupting execution.
Error handling is the term for all techniques of this nature, and this section looks at exceptions and how you can deal with them. An exception is an error generated either in your code or in a function called by your code that occurs at runtime. The definition of error here is more vague than it has been up until now, because exceptions may be generated manually, in functions and so on. For example, you might generate an exception in a function if one of its string parameters doesn't start with the letter “a.” Strictly speaking, this isn't an error outside of the context of the function, although the code that calls the function treats it as an error.
You've seen exceptions a few times already in this book. Perhaps the simplest example is attempting to address an array element that is out of range:
int[] myArray = { 1, 2, 3, 4 };
int myElem = myArray[4];
This outputs the following exception message and then terminates the application:
Index was outside the bounds of the array.Exceptions are defined in namespaces, and most have names that make their purpose clear. In this example, the exception generated is called System.IndexOutOfRangeException, which makes sense because you have supplied an index that is not in the range of indices permissible in myArray. This message appears, and the application terminates, only when the exception is unhandled. In the next section, you'll see exactly what you have to do to handle an exception.
try…catch…finally
The C# language includes syntax for structured exception handling (SEH). Three keywords mark code as being able to handle exceptions, along with instructions specifying what to do when an exception occurs: try, catch, and finally. Each of these has an associated code block and must be used in consecutive lines of code. The basic structure is as follows:
try
{
   …
}
catch (<exceptionType> e) when (filterIsTrue)
{
   <await methodName(e);>
   …
}
finally
{
   <await methodName;>
   …
}
Optionally using await within either a catch or finally block was introduced in C# 6. The await keyword is used to support advanced asynchronous programming techniques that avoid bottlenecks and can improve the overall performance and responsiveness of an application. Asynchronous programming, utilizing the async and await keywords, is not discussed in this book; nevertheless, as those keywords do simplify the implementation of this programming technique, it is highly recommended to learn about them.
It is also possible, however, to have a try block and a finally block with no catch block, or a try block with multiple catch blocks. If one or more catch blocks exist, then the finally block is optional; otherwise, it is mandatory. The usage of the blocks is as follows:
try— Contains code that might throw exceptions (“throw” is the C# way of saying “generate” or “cause” when talking about exceptions).catch— Contains code to execute when exceptions are thrown.catchblocks can respond only to specific exception types (such asSystem.IndexOutOfRangeException) using<exceptionType>, hence the ability to provide multiplecatchblocks. It is also possible to omit this parameter entirely, to get a generalcatchblock that responds to all exceptions. C# 6 introduced a concept called exception filtering that is implemented by adding thewhenkeyword after the exception type expressions. If that exception type occurs and the filter expression is true, only then will the code in thecatchblock execute.finally— Contains code that is always executed, either after thetryblock if no exception occurs, after acatchblock if an exception is handled, or just before an unhandled exception moves “up the call stack.” This phrase means that SEH allows you to nesttry…catch…finallyblocks inside one another, either directly or because of a call to a function within atryblock. For example, if an exception isn't handled by anycatchblocks in the called function, it might be handled by acatchblock in the calling code. Eventually, if nocatchblocks are matched, then the application will terminate. The fact that thefinallyblock is processed before this happens is the reason for its existence; otherwise, you might just as well place code outside of thetry…catch…finallystructure. This nested functionality is discussed further in the “Notes on Exception Handling” section a little later, so don't worry if it sounds a little confusing.
Here's the sequence of events that occurs after an exception occurs in code in a try block, also illustrated by Figure 7.18.
- The
tryblock terminates at the point where the exception occurred. - If a
catchblock exists, then a check is made to determine whether the block matches the type of exception that was thrown. If nocatchblock exists, then thefinallyblock (which must be present if there are nocatchblocks) executes. - If a
catchblock exists but there is no match, then a check is made for othercatchblocks. - If a
catchblock matches the exception type and there is an exception filter that results intrue, the code within it executes and then thefinallyblock is executed (if it is present). - If a
catchblock matches the exception type and there is no exception filter, the code it contains executes, and then thefinallyblock executes if it is present. - If no
catchblocks match the exception type, then thefinallyblock of code executes if it is present.

The following Try It Out demonstrates handling exceptions. It shows throwing and handling them in several ways so you can see how things work.
Listing and Configuring Exceptions
The .NET Framework contains a host of exception types, and you are free to throw and handle any of these in your own code. The IDE supplies a dialog box for examining and editing the available exceptions, which can be called up with the Debug ![]() Exception Settings menu item (or by pressing Ctrl+D, E). Figure 7.20 shows the Exception Settings dialog box.
Exception Settings menu item (or by pressing Ctrl+D, E). Figure 7.20 shows the Exception Settings dialog box.

Exceptions are listed by category and .NET library namespace. You can see the exceptions in the System namespace by expanding the Common Language Runtime Exceptions plus sign. The list includes the System.IndexOutOfRangeException exception you used earlier.
Each exception may be configured using the check boxes next to the exception type. When checked, the debugger will (break when) Thrown, causing a break into the debugger even for exceptions that are handled.
 What You Learned in This Chapter
| Topic | Key Concepts |
| Error types | Fatal errors cause your application to fail completely, either at compile time (syntax errors) or at runtime. Semantic, or logic, errors are more insidious, and may cause your application to function incorrectly or unpredictably. |
| Outputting debugging information | You can write code that outputs helpful information to the Output window to aid debugging in the IDE. You do this with the Debug and Trace family of functions, where Debug functions are ignored in release builds. For production applications, you may want to write debugging output to a log file instead. You can also use tracepoints to output debugging information. |
| Break mode | You can enter break mode (essentially a state where the application is paused) manually, through breakpoints, through assertions, or when unhandled exceptions occur. You can add breakpoints anywhere in your code and you can configure breakpoints to break execution only under specific conditions. When in break mode, you can inspect the content of variables (with the help of various debug information windows) and step through code a line at a time to assist you in determining where the errors are. |
| Exceptions | Exceptions are errors that occur at runtime and that you can trap and process programmatically to prevent your application from terminating. There are many types of exceptions that can occur when you call functions or manipulate variables. You can also generate exceptions with the throw keyword. |
| Exception handling | Exceptions that are not handled in your code will cause the application to terminate. You handle exceptions with try, catch, and finally code blocks. try blocks mark out a section of code for which exception handling is enabled. catch blocks consist of code that is executed only if an exception occurs, and can match specific types of exceptions. You can include multiple catch blocks. finally blocks specify code that is executed after exception handling has occurred, or after the try block finishes if no exception occurs. You can include only a single finally block, and if you include any catch blocks, then the finally block is optional. |