
CHAPTER 9
Key Risk Indicators
This chapter explores the benefits and challenges of the use of metrics in the operational risk (OR) framework. Metrics can provide the business environment and internal control factors (BEICF) needed for an AMA capital approach, but more importantly, they can provide insight into the changing operational risk environment.
KEY RISK INDICATORS
Key risk indicators, or KRIs, are used in the operational risk framework to keep a finger on the pulse of the changing risk environment. External risk factors, internal risk factors, and the control environment can be monitored using metrics.
In Basel II, there is a requirement for Advanced Measurement Approach (AMA) banks to collect BEICF for use in the capital model. These BEICF have proved elusive and capital models have struggled with how to incorporate them. The use of BEICF in capital modeling is discussed later in Chapter 12.
However, it is common sense that monitoring our environment and our controls will lead to better operational risk management, regardless of their use in the capital model, and all firms attempt to develop a key risk indicator (KRI) structure of some kind. Some are highly sophisticated; some are simple.
In fintechs it is common for the strategic business plan to be monitored by objectives and key results (OKRs), and aligning operational risk KRIs to these OKRs is an effective way to embed a strong risk culture.
KRIs are an important pillar in the operational risk framework, as illustrated in Figure 9.1.
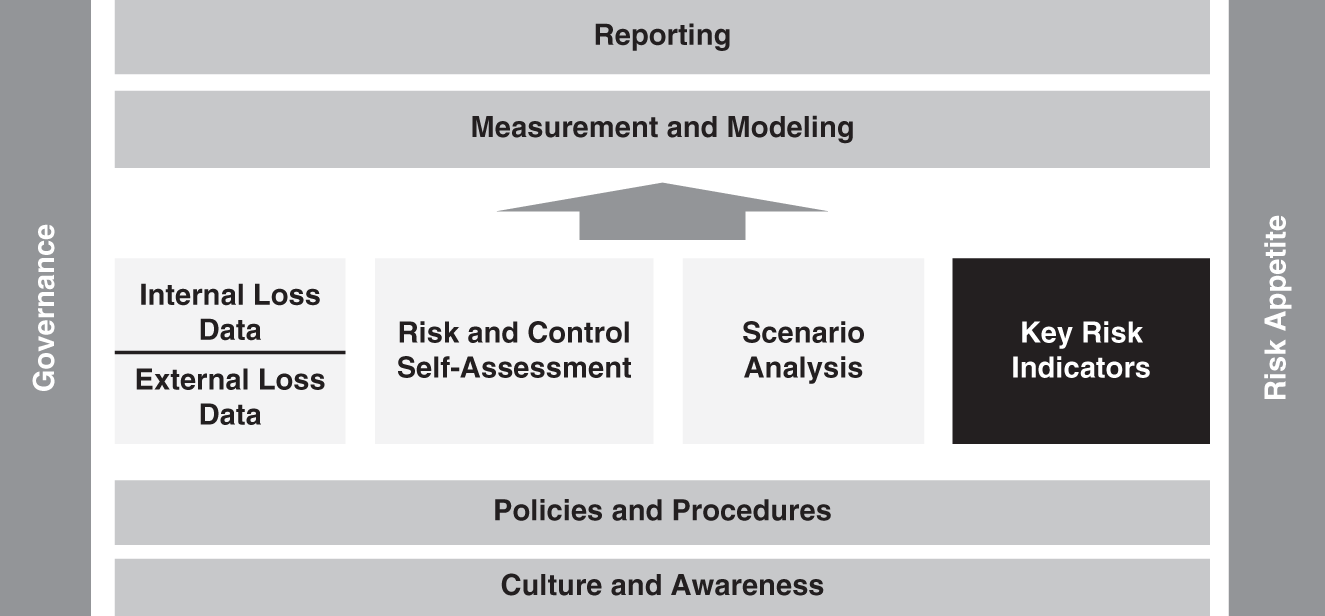
FIGURE 9.1 Key Risk Indicators in the Operational Risk Framework
At its most complex, a metrics or KRI program can lead to the danger of frisking the ant while the elephant walks by—that is to say, we can become so focused on detailed data that we miss the major looming operational risk that is not being captured in our metrics systems.
The challenge is to identify a suitable metric that is truly measuring risk. Most metrics simply count something and should not be confused with a true KRI.
For this reason, it may be safer to refer to gathered metrics as “indicators” rather than KRIs until they have proven their worth. For example, the number of failed trades per day is a metric. This metric alone does not indicate rising or falling risk levels unless it is combined with other related metrics, such as volume. In contrast, an indicator that measures the percentage of failed trades in the total volume of trades is a more helpful indicator and might be a true KRI.
There are many types of indicators, and each has its own strengths and weaknesses and can be used effectively in the right place.
When considering the role of KRIs in the operational risk framework, it is important to remember that they provide input into the framework. They are not the end; they are simply one of the means to the end. There is a danger in relying too heavily on metrics in that we can become overconfident that we are collecting all of the right data, and that a green dashboard of metrics means everything is fine and operational risk is under control. Conversely, we may panic over a red dashboard when all that has happened is that we set our thresholds too low.
An analogy may be helpful. If managing operational risk is like driving a car, then KRIs are the dashboard of the car. No one would be foolish enough to drive without a dashboard, as it tells us important information such as our speed, our fuel levels, and whether we have any issues such as overheating or running low on oil.
But we do not drive with our heads down, looking at the dashboard of our cars. We look ahead at the road to see where we are going and what is coming over the horizon. We learn to drive, and we drive safely and carefully.
To take the analogy one step further, sometimes, through no fault of our own, we get crashed into by a truck. That is why we have insurance, and that is why we calculate and hold operational risk capital. We hold capital for the rare catastrophic events that can occur, either through our own reckless behavior or through no fault of our own.
It is important to have a good functioning dashboard and to rely on it appropriately and build out the rest of the framework that you need in order to “drive safely.”
Key Performance Indicators
Key performance indicators, or KPIs, measure how well something is performing, or how efficient it is. For example, the average time taken to resolve a help desk request would be a KPI. KPIs are used extensively in sales to track which sales area is performing best or which sales method is producing the best results. They are also effective tools to measure the efficiency of process and an operations function will usually have a dashboard of KPIs for that purpose.
Key Control Indicators
Key controls indicators, or KCIs, measure how effectively a control is working. For example, the number of viruses caught in a virus protection screen is a KCI. The number of viruses that got past the virus protection is also a KCI.
Metric Types
Whether a metric is a KPI or a KCI, it may be one of three types of metric: an exception monitor, a lagging indicator, or a leading indicator.
Exception Monitoring
Exception monitoring indicators raise a flag when an exception occurs. For example, if a report fails to print, then this could produce a “yes” flag for a “Report Print Failure” indicator. Another example might be where a new product has been launched without the proper approvals. This could raise a red flag in the new-product approval process. More important, exception monitoring can raise red flags in urgent situations to ensure remediation.
Exceptions are easily understood as they have a binary outcome. They typically produce ad-hoc reporting to alert managers to the issue that has arisen.
Lagging Indicators
Lagging indicators track past activity and look for trends over time. Lagging indicators can be very useful but have limitations, as they can only show us what has already happened, not what is going to happen. As we all know, past performance is not necessarily an indication of future performance. However, analyzing trends can be helpful in the formation of strategy and in identifying changing risk profiles.
A KCI that is showing a constant deterioration of a control will allow for decisions to be made to alleviate any rising risk. Lagging indicators are the most common metrics in most reporting packs, and management is generally very comfortable interpreting them.
Perhaps the strongest lagging indicator in the operational risk framework is operational event data. The losses that were suffered in the past can be analyzed for trends and patterns.
However, as mentioned earlier, lagging indicators can give a false sense of urgency or complacency if they are not carefully designed and managed. Lagging indicators are often found in regular monthly and quarterly reporting decks.
Leading Indicators
A true KRI will be a leading indicator. Leading indicators attempt to predict points of emerging risk. They are rare. An example of a leading indicator might be customer complaints. A high number of customer complaints might correlate with the size and number of class action lawsuits that a retail firm faces. If so, then the number of customer complaints is a leading indicator for legal risk.
Perhaps we can go further back the chain of causation. If it can be shown that a drop of more than 30 percent in the asset value in a customer account produces a significant increase in complaints, then a drop in asset value in an account becomes a leading indicator for legal risk.
If strong leading indicators can be found, they allow for preventive measures to be taken. In this example, whenever an account drops more than 30 percent, there could be a process in place to ensure that the customer is called within one day to discuss their needs and any changes they might wish to make.
Leading, lagging, and exception indicators are often monitored by line managers as part of ensuring efficiency and excellence in their processes. The operational risk framework can look for such indicators, link them to risks through the risk and control self-assessment (RCSA) process, and then produce a dashboard of operational risk-relevant indicators for tracking.
SELECTING KRIS
The indicators selected by a firm to monitor its risk may be KPIs or KCIs or combinations of the two. There are many challenges in finding appropriate KRIs for the operational risk framework. Metrics that are valuable for the day-to-day running of a department might be inappropriate or insufficient for operational risk management.
Many operational risk functions are faced with a sea of metric data when they first request KRIs.
These metrics needed to be filtered and enhanced in order to find the most appropriate indicators. It is helpful to complete the RCSA program before seeking KRIs so that the search can be narrowed down to only those metrics that are relevant to the risks that have been identified in the RCSA.
The RCSA will assist the operational risk manager in identifying which are the high risks and which risks are currently low but are in danger of increasing if the control environment deteriorates. The manager can then explore which controls are contributing to the risk rating and how those controls might be monitored by a KRI.
Having identified the areas of interest, the manager can set about developing a metric and hopefully one that is a KRI. They will often need to work with managers in other departments in order to establish ownership and find a reliable source for the data. They will also need to ensure that the quality of the metric is validated.
Once the risks that need to be monitored are identified, SMART principles can be applied in the selection or creation of an appropriate KRI. SMART principles suggest that a KRI should be:
- Specific
- Measurable
- Attainable
- Relevant
- Timely
In practice, it is difficult to find indicators that meet all of these criteria, and it may be necessary to use proxy indicators temporarily, or even permanently.
Having established what data needs to be collected, the operational risk manager must then put in place thresholds and appropriate reporting scales and processes.
THRESHOLDS
The thresholds that are set for a metric are critical. Once thresholds are set, they are unlikely to be changed for some time and so they need to be set at the correct point.
Picking a threshold for a metric might produce an outcome that gives a high, medium, or low risk score. For example, if a firm's system has been shown to become unstable above 1 million trades, then a metric that tracks the number of trades in a day might have three thresholds set, as shown below.
Example of Thresholds for a Trade Volume Metric
| Metric | Low Risk | Medium Risk | High Risk |
|---|---|---|---|
| Daily trade volume | <500,000 | 500,001–1,000,000 | >1,000,000 |
This is a purely subjective and qualitative approach and can work well for many metrics as it is based on the management experience within the firm.
However, a more scientific approach can be helpful. If you have a data set for the metric that spans a good period of time, then you can apply statistical analysis to that data set and determine the properties of those data. By establishing the mean and the standard deviation, it is possible to apply a consistent threshold approach to all metrics.
For example, the operational risk function might establish in the KRI standards that a standard deviation in a metric above 0.5 should result in a medium risk rating and a standard deviation above 1 should result in a high risk rating. This assumes that the metrics are set up appropriately so that increases or decreases are appropriately tracked where they may indicate increased risk.
KRI STANDARDS
Each KRI must be monitored, and the minimum standards for KRIs should be set by the operational risk department. Gathering KRIs can be a manually intensive task, and many firms have implemented technology systems to extract metrics automatically where possible and to house metrics for analysis.
For each KRI, certain criteria need to be set, including:
- Name of the indicator.
- Risk that it is being monitored against.
- Method of calculation.
- Owner of the KRI.
- Red flag threshold, or red, amber, green or high, medium, low thresholds.
- Reporting period.
KRI CHALLENGES
The biggest challenge with KRIs is finding the right one. There is no consensus on which KRIs should be collected, although some best practice is starting to emerge. It is also often practically challenging to collect data that might be very helpful in managing operational risk. Einstein put it best when he said: “Not everything that can be counted counts, and not everything that counts can be counted.”1
Industry collaboration has led to some recommendations from the American Banking Association and from the Risk Management Association (RMA) on appropriate KRIs. However, these recommended KRIs number in the hundreds or even thousands, and every firm is seeking the magical minimum number of KRIs that can indicate the operational risk health of the firm.
Firms are participating in collaborative exercises with these and other organizations to compare metrics and seek out possible benchmarking opportunities.
Without industry benchmarking, a firm's KRI can be compared only to itself. This can result in a false sense of security in an indicator that is remaining stable but that may in fact indicate that the control being monitored is operating at below industry standard.
As mentioned earlier, it is good practice to link KRIs to risks and controls that have been identified in the RCSA process and are known to be key to operational risk management. A complete KRI program also requires constant validation and feedback and strong standards.
METRICS EXAMPLES
KRIs could be developed based on the following examples of indicators that can be helpful in an operational risk program.
People Metrics
Some common examples of people metrics are provided in Table 9.1.
TABLE 9.1 Sample People Metrics
| Metric | Description | Possible Parameters |
|---|---|---|
| Staff turnover | A simple metric that tracks the number of staff leaving and joining. | Number of leavers; number of joiners. |
| Regretted losses | The number of staff who have left the firm not due to downsizing or firing. | Percentage of workforce; percentage of total leavers. |
| Reason for leaving | Human resources generally tracks the reasons for leaving, and capturing that information may give an indication of morale and other people issues. | Categories could be: compensation, lack of training, lack of opportunities for advancement. |
| Educational levels | Highest level of education for each employee. | High school, bachelor's, MA, PhD. |
| Professional level | Professional exams taken and passed. | For example, Series 7, CPEs, CLEs, etc. |
| Training days | May indicate the level of expertise in the firm and may relate to morale and reasons for leaving. | Average number of days per employee; number of days per department/business unit. |
| Staff morale | Firm-wide surveys can provide information that can assist with measuring the morale in the firm. | Average morale score; high and low scores; departmental/business unit comparisons; year-on-year comparisons. |
| Compensation | Benchmarking compensation can help ensure salaries are competitive. | Comparison with industry benchmarks. |
Compliance Metrics
Some common examples of compliance metrics are provided in Table 9.2.
TABLE 9.2 Sample Compliance Metrics
| Metric | Description | Possible Parameters |
|---|---|---|
| Number of action letters from regulator | Regulators provide investigation notices that require a response by the firm. | Number of letters, number of letters resolved without issue, number of letters requiring remediating actions. |
| Regulatory fines | This is a subset of loss data that may provide insight into the compliance health of the firm. | Number of fines, dollar value of fines, total dollars in fines this month/quarter/year. |
| Frequency of compliance reviews | Compliance desk reviews are mandatory in some areas. | Frequency or length of time since last review, by division, desk, etc. |
| Number of open compliance issues | Remediating actions are often required by compliance departments. | Number of actions open, number of actions late, number of high-priority actions open, etc. |
| Time taken to complete AML | Measures how promptly anti–money laundering checks are made. | Days/hours from request to completion. |
| Number of new products traded without new-product approval | Products that miss this process may expose the firm to elevated operational risk (as well as market and credit risk). | Number of new products approved by month; number of products identified that missed NPA process. |
| Number of complaints | Customer complaints regarding the clarity and fairness of products may indicate compliance risk. | Number of customer complaints related to alleged unfair, deceptive or abusive practices. |
Technology and Infrastructure Metrics
Some common examples of technology and infrastructure metrics are provided in Table 9.3.
TABLE 9.3 Samples of Technology and Infrastructure Metrics
| Metric | Description | Possible Parameters |
|---|---|---|
| Average time to resolve support requests | Time between initial request and response or final resolution. | Days/hours/minutes to respond; days/hours/minutes to resolve. |
| Number of support requests | Number of requests received by the help desk, or production support areas. May indicate issues with the systems. Should be compared to number of support staff and response times. | Number of requests total; number of requests per area; number of requests per time of day, week, month. |
| Network downtime | Measures resiliency of the network. | Days/hours/minutes down; by process/department/system, etc. |
| Hardware failure | Measures failed hardware. | Number of incidents; time to resolution or replacement. |
| Number of software patches | Measures quality of systems and workload of IT. | Number of patches by process/department/system. |
| Number of security breaches | Number of virus/hacker attacks may indicate the stability of the systems and security confidence. | Number of total attacks; number of attacks caught at firewall; number of attacks penetrating security. |
| System capacity | Measures the redundancy in the systems to ensure they can handle peak requirements. | Percentage of average system capacity per month; percentage of peak system capacity per month. |
| Password exceptions | Measures how often password attempts are made to monitor security breach attempts. | Number of password breaches; number of authorize exceptions to password resets. |
| Telecoms failure | Measures failed telecommunications infrastructure. | Number of incidents; time to resolution or replacement. |
Business Continuity Metrics
Some common examples of business continuity metrics are provided in Table 9.4.
TABLE 9.4 Sample Business Continuity Metrics
| Metric | Description | Possible Parameters |
|---|---|---|
| Number of completed business continuity plans | Tracks how many plans are in place, but does not evaluate their quality. Quality may be scored by BCP team. | Number of plans; number of plans scoring as “high”; date since last plan update. |
| Date since last BCP test | Tracks the age of BCP testing to ensure it does not get stale. | Days/months since last test by process/system/department/location. |
Client Metrics
Some common examples of client metrics are provided in Table 9.5.
TABLE 9.5 Sample Client Metrics
| Metric | Description | Possible Parameters |
|---|---|---|
| Number of client complaints | Customer satisfaction changes may provide insight into changes in employee practice, product issues, client profile changes. | Number of complaints; types of complaints; by department/region/product. |
| Number of new accounts opened | The number of accounts opened may indicate resources constraints. | Number of accounts opened; number of accounts opened with missing data. |
| Number of client records complete | Measures how many clients have completed reference records. This measure can be used for EDPM, CPBP, and fraud risks. | Percentage of client records that are incomplete. |
Trade Execution and Process Management Metrics
Some common examples of trade execution and process management metrics are provided in Table 9.6.
TABLE 9.6 Sample Execution and Process Management Metrics
| Metric | Description | Possible Parameters |
|---|---|---|
| Volume of transactions | All transactional measures require further insight than mere volumes. They can be considered in relation to each other, e.g., number of fails as percentage of total volume. | Total number of transactions; number per desk/product/department; compared to last day/week/month. |
| Number of fails | Total number of fails number per desk/product/department; compared to last day/week/month; compared to total volume. | |
| Number of cancel and corrects | Total number of cancel; percentage of corrects; number per desk/product/department; compared to last day/week/month; compared to total volume. | |
| Number of manual wire transfers | An increase in manual wire transfers might increase errors. | Total number or comparison with last week/month; number of erroneous wire transfers per total number of manual transfers. |
| Downtime of external feeds | Loss of external feeds may affect performance and increase errors. | Days/hours/minutes downtime of each external feed. |
Financial Statement Metrics
Some common examples of financial statement metrics are provided in Table 9.7.
TABLE 9.7 Sample Financial Statement Metrics
| Basic Indicator | Description | Possible Parameters |
|---|---|---|
| Percentage of SOX controls tested | SOX controls provide evidence that the financials are correct. | Total number tested; percentage tested; percentage tested and failed. |
| Number of errors in financial statements | The number of erroneous entries and fixes. | Number of entries; percentage of entries requiring fixes; number of fixes; number of unreconciled entries. |
| Percentage of SOX controls tested | SOX controls provide evidence that the financials are correct. | Total number tested; percentage tested; percentage tested and failed. |
KEY POINTS
- KRIs are used to monitor changing risk levels, and true KRIs are difficult to identify.
- Metrics may provide the business environment and internal control factors that are required for an Advanced Measurement Approach capital model under Basel II.
- There are many types of metrics, including exception monitoring, performance indicators and control indicators.
- A metric might be a lagging, leading, or exception metric.
- SMART principles suggest that a KRI should be specific, measurable, attainable, relevant, and timely.
- It is important to ensure that thresholds are carefully set and monitored.
REVIEW QUESTION
- An indicator that measures the average time taken to resolve a help desk request would best be described as a
- key risk indicator.
- key performance indicator.
- key control indicator.
- simple metric.
NOTE
- 1 Quote has been attributed to Albert Einstein (1879–1955), but it has also been attributed to William Bruce Cameron's 1963 text, Informal Sociology: A Casual Introduction to Sociological Thinking.