
7 Conic Sections
Chapter Outline
Introduction Hypatia is the first woman in the history of mathematics about whom we have considerable knowledge. Born in 370 C.E. in Alexandria, she was renowned as a mathematician and philosopher. Among her writings is On the Conics of Apollonius, which popularized Apollonius’(200 B.C.E.) work on curves that can be obtained by intersecting a double-napped cone with a plane: the circle, parabola, ellipse, and hyperbola. Note in FIGURE 7.1.1 that the plane does not pass through the vertex of the cone. When the plane passes through the vertex, the resulting figures: a single point, a single line, or two intersecting lines are commonly called degenerate conics. With the close of the Greek period, interest in conic sections waned; after Hypatia the study of these curves was neglected for over 1000 years.

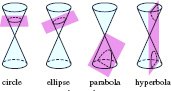
FIGURE 7.1.1 Conic sections
In the seventeenth century, the Italian physicist and mathematician Galileo Galilei (1564–1642) showed that in the absence of air resistance the path of a projectile follows a parabolic arc. At about the same time, the German mathematician, astronomer, and astrologist Johannes Kepler (1571–1630) hypothesized that the orbits of planets around the Sun are ellipses with the Sun at one focus. This was later verified by the English mathematician Sir Isaac Newton (1642–1726), using the methods of the newly developed calculus. Kepler also experimented with the reflecting properties of parabolic mirrors; these investigations sped the development of the reflecting telescope. The Greeks had known little of these practical applications. They had studied the conics for their beauty and fascinating properties. In the first three sections of this chapter, we will examine both the ancient properties and the modern applications of these curves. Rather than using a cone, we shall see how the parabola, ellipse, and hyperbola are defined by means of distance. Using a rectangular coordinate system and the distance formula, we obtain equations for the conics. Each of these equations will be in the form of a quadratic equation in variables x and y:
![]()
where A, B, C, D, E, and F are constants. We have already studied the special case y = ax2 + bx2 + c of the foregoing equation in Section 2.4.

Solar System
DEFINITION 7.1.1 Parabola
A parabola is the set of points P (x, y) in the plane that are equidistant from a fixed line L, called the directrix, and a fixed point F called the focus.
A parabola is shown in FIGURE 7.1.2. The line through the focus perpendicular to the directrix is called the axis of the parabola. The point of intersection of the parabola and the axis is called the vertex, denoted by V in Figure 7.1.2.
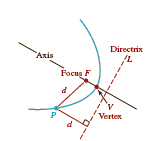
FIGURE 7.1.2 A parabola
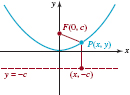
FIGURE 7.1.3 Parabola with vertex (0, 0) and focus on the y-axis
![]() Parabola with Vertex (0, 0) To describe a parabola analytically, we use a rectangular coordinate system where the directrix is a horizontal line y = −c, where c > 0, and the focus is the point F(0, c) Then we see that the axis of the parabola is along the y-axis, as FIGURE 7.1.3 shows. The origin is necessarily the vertex, since it lies on the axis c units from both the focus and the directrix. The distance from a point p(x, y) to the directrix is
Parabola with Vertex (0, 0) To describe a parabola analytically, we use a rectangular coordinate system where the directrix is a horizontal line y = −c, where c > 0, and the focus is the point F(0, c) Then we see that the axis of the parabola is along the y-axis, as FIGURE 7.1.3 shows. The origin is necessarily the vertex, since it lies on the axis c units from both the focus and the directrix. The distance from a point p(x, y) to the directrix is
![]()
Using the distance formula, the distance from to the focus is
![]()
From the definition of the parabola it follows that d(P, F) = y + c, or
![]()
By squaring both sides and simplifying, we obtain
![]()
or
![]()
Equation (1) is referred to as the standard form of the equation of a parabola with focus (0, c) directrix y = −c, c > 0 and vertex (0,0). The graph of any parabola with standard form (1) is symmetric with respect to the y-axis.
Equation (1) does not depend on the assumption that c > 0 However, the direction in which the parabola opens does depend on the sign of c Specifically, if c > 0 the parabola opens upward as in Figure 7.1.3; if c < 0 the parabola opens downward.
If the focus of a parabola is assumed to lie on the x-axis at F(c, 0) and the directrix is x = −c,> then the x-axis is the axis of the parabola and the vertex is (0, 0). If c > 0 the parabola opens to the right; if c < 0, it opens to the left. In either case, the standard form of the equation is
![]()
The graph of any parabola with standard form (2) is symmetric with respect to the x-axis.
A summary of all this information for equations (1) and (2) is given in FIGURES 7.1.4 and 7.1.5, respectively. You may be surprised to see in Figure 7.1.4(b) that the directrix above the x-axis is labeled y = −c and the focus on the negative y-axis has coordinates F(0, c). Bear in mind that in this case the assumption is that c < 0 and so −c > 0. A similar remark holds for Figure 7.1.5(b).
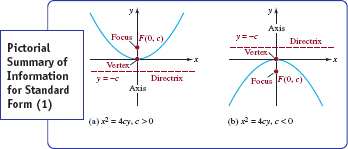
FIGURE 7.1.4 Summary of information for standard form (1)
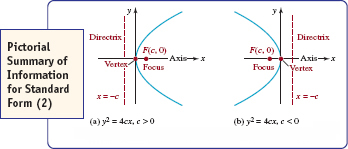
FIGURE 7.1.5 Summary of information for standard form (2)
EXAMPLE 1 The Simplest Parabola
We first encountered the graph of y = x2 in Section 2.2. By comparing this equation with (1) we see
![]()
and so 4c = 1 or c =![]() , Therefore the graph of y =x2 is a parabola with vertex at the origin, focus at (0, −
, Therefore the graph of y =x2 is a parabola with vertex at the origin, focus at (0, −![]() ), and directrix y = −
), and directrix y = −![]() . These details are indicated in the graph in FIGURE 7.1.6.
. These details are indicated in the graph in FIGURE 7.1.6.

FIGURE 7.1.6 Graph of equation in Example 1
![]() Graphing tip for equations (1) and (2).
Graphing tip for equations (1) and (2).
Knowing the basic parabolic shape, all we need to know to sketch a rough graph of either equation (1) or (2) is the fact that the graph passes through its vertex and the direction in which the parabola opens. To add more accuracy to the graph it is convenient to use the number determined by the standard form equation to plot two additional points. Note that if we choose y = c in (1), then x2 = 4c2 implies x = ±2c. Thus (2c, c) and (−2c, c) lie on the graph of x2 = 4cy. Similary, the choice x = c (2) implies y = ±2c and so (c, 2c) and (c, −2c) are points on the graph of y2 = 4cx. The line segment through the focus with endpoints (2c, c), (−2c, c) for equations with standard form (1), and (c, 2c), (c, −2c) for equations with standard form (2) is called the focal chord. For example, in Figure 7.1.6, if we choose y =![]() then x2 =
then x2 = ![]() implies x = ±
implies x = ±![]() . Endpoints of the horizontal focal chord for y = x2 are (−
. Endpoints of the horizontal focal chord for y = x2 are (−![]() ,
, ![]() ) and (
) and (![]() ,
, ![]() ).
).
Example 2 Finding an Equation of a Parabola
Find the equation in standard form of the parabola with directrix x = 2 and focus (−2,0) Graph.
Solution In FIGURE 7.1.7 we have graphed the directrix and the focus. We see from their placement that the equation we seek is of the form y2 = 4cx. Since c = −2 the parabola opens to the left and so
![]()
As mentioned in the discussion preceding this example, if we substitute x = c or in this case x = −2, into the equation y2 = −8x we can find two points on its graph. From y2 = −8(−2) = 16 we get y = ±4. As shown in FIGURE 7.1.8, the graph passes through (0,0) as well as through the endpoints (−2, 4) and (−2, 4) of the focal chord.
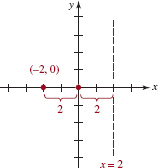
FIGURE 7.1.7 Directrix and focus in Example 2
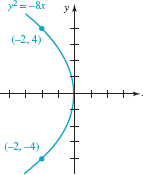
FIGURE 7.1.8 Graph of parabola in Example 2
![]() Parabola with Vertex (h, k) Suppose that a parabola is shifted both horizontally and vertically so that its vertex is at the point (h, k) and its axis is the vertical line x = h. The standard form of the equation of the parabola is then
Parabola with Vertex (h, k) Suppose that a parabola is shifted both horizontally and vertically so that its vertex is at the point (h, k) and its axis is the vertical line x = h. The standard form of the equation of the parabola is then
![]()
Similarly, if its axis is the horizontal line y = k the standard form of the equation of the parabola with vertex (h, k) is
![]()
![]() Shifts The parabolas defined by these equations are identical in shape to the parabolas defined by equations (1) and (2) because equations (3) and (4) represent rigid transformations (shifts up, down, left, and right) of the graphs of (1) and (2). For example, the parabola has vertex (−1, 5). Its graph is the graph of x2 = 8y shifted horizontally one unit to the left followed by an upward vertical shift of five units.
Shifts The parabolas defined by these equations are identical in shape to the parabolas defined by equations (1) and (2) because equations (3) and (4) represent rigid transformations (shifts up, down, left, and right) of the graphs of (1) and (2). For example, the parabola has vertex (−1, 5). Its graph is the graph of x2 = 8y shifted horizontally one unit to the left followed by an upward vertical shift of five units.
![]()
For each of the equations, (1) and (2) or (3) and (4), the distance from the vertex to the focus, as well as the distance from the vertex to the directrix, is |c|
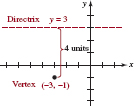
FIGURE 7.1.9 Vertex and directrix in Example 3
Example 3 Finding an Equation of a Parabola
Find the equation in standard form of the parabola with vertex (−3, −1) and directrix y = 3.
Solution We begin by graphing the vertex at (−3, −1) and the directrix y = 3. From FIGURE 7.1.9 we can see that the parabola must open downward, and so its standard form is (3). This fact, plus the observation that the vertex lies 4 units below the directrix, indicates that the appropriate solution of |c| = 4 is c = −4. Substituting h = −3, k = −1, and c = −4 into (3) gives
![]()
EXAMPLE 4 Find Everything
Find the vertex, focus, directrix, intercepts, and graph of the parabola (5)
![]()
Solution In order to write the equation in one of the standard forms we complete the square in y:
![]()
Thus the standard form of equation (5) is (y −2)2 = 8(x +4). Comparing this equation with (4) we conclude that the vertex is (−4, 2) and that 4c = 8 or c = 2, Thus the parabola opens to the right. From c = 2 > 0, the focus is 2 units to the right of the vertex at (−4 + 2, 2) or (−2, 2). The directrix is the vertical line 2 units to the left of the vertex, x = −4 −2 or x =−6 Knowing the parabola opens to the right from the point (−4, 2) also tells us that the graph has intercepts. To find the x-intercept we set y = 0 in (5) and find immediately that ![]() . The x-intercept is
. The x-intercept is ![]() . To find the y-intercepts we set x = 0 in (5) and find from the quadratic formula that
. To find the y-intercepts we set x = 0 in (5) and find from the quadratic formula that ![]() or y ≈ 7.66 and y ≈ −3.66. The y-intercepts are
or y ≈ 7.66 and y ≈ −3.66. The y-intercepts are ![]() and
and ![]() . Putting all this information together we get the graph in FIGURE 7.1.10.
. Putting all this information together we get the graph in FIGURE 7.1.10.

FIGURE 7.1.10 Graph of equation in Example 4
![]() Applications of the Parabola The parabola has many interesting properties that make it suitable for certain applications. Reflecting surfaces are often designed to take advantage of a reflection property of parabolas. Such surfaces, called paraboloids, are three-dimensional and are formed by rotating a parabola about its axis. As illustrated in FIGURE 7.1.11(a), rays of light (or electronic signals) from a point source located at the focus of a parabolic reflecting surface will be reflected along lines parallel to the axis. This is the idea behind the design of searchlights, some flashlights, and on-location satellite dishes. Conversely, if the incoming rays of light are parallel to the axis of a parabola, they will be reflected off the surface along lines passing through the focus. See Figure 7.1.11(b). Beams of light from a distant object such as a galaxy are essentially parallel, and so when these beams enter a reflecting telescope they are reflected by the parabolic mirror to the focus, where a camera is usually placed to capture the image over time. A parabolic home satellite dish operates on the same principle as the reflecting telescope; the digital signal from a TV satellite is captured at the focus of the dish antenna by a receiver.
Applications of the Parabola The parabola has many interesting properties that make it suitable for certain applications. Reflecting surfaces are often designed to take advantage of a reflection property of parabolas. Such surfaces, called paraboloids, are three-dimensional and are formed by rotating a parabola about its axis. As illustrated in FIGURE 7.1.11(a), rays of light (or electronic signals) from a point source located at the focus of a parabolic reflecting surface will be reflected along lines parallel to the axis. This is the idea behind the design of searchlights, some flashlights, and on-location satellite dishes. Conversely, if the incoming rays of light are parallel to the axis of a parabola, they will be reflected off the surface along lines passing through the focus. See Figure 7.1.11(b). Beams of light from a distant object such as a galaxy are essentially parallel, and so when these beams enter a reflecting telescope they are reflected by the parabolic mirror to the focus, where a camera is usually placed to capture the image over time. A parabolic home satellite dish operates on the same principle as the reflecting telescope; the digital signal from a TV satellite is captured at the focus of the dish antenna by a receiver.

Searchlight
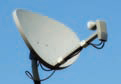
Tv satellite dish
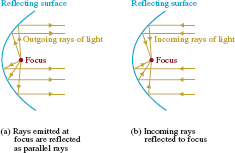
FIGURE 7.1.11 Parabolic reflecting surface
Parabolas are also important in the design of suspension bridges. It can be shown that if the weight of the bridge is distributed uniformly along its length, then a support cable in the shape of a parabola will bear the load evenly.

The Brooklyn bridge is a suspension bridge
The trajectory of an obliquely launched projectile—say, a basketball thrown from the free throw line—will travel in a parabolic arc.

The ball travels in a parabolic arc
Tuna, which prey on smaller fish, have been observed swimming in schools of 10 to 20 fish arrayed approximately in a parabolic shape. One possible explanation for this is that the smaller fish caught in the school of tuna will try to escape by “reflecting” off the parabola. As a result, they are concentrated at the focus and become easy prey for the tuna. See FIGURE 7.1.12.

FIGURE 7.1.12 Tuna hunting in a Parabolic arc
7.1 Exercises Answers to selected odd-numbered problems begin on page ANS–19.
In Problems 1–24, find the vertex, focus, directrix, and axis of the given parabola. Graph the parabola.
1. y2 = 4x
2. ![]()
3. ![]()
4. y2 = −10x
5. x2 = −16y
6. ![]()
7. x2 = 28y
8. x2 = −64y
9. (y − 1)2 = 16x
10. (y + 3)2 = −8(x + 2)
11. (x + 5)2 = −4(y + 1)
12. (x − 2)2 + y = 0
13. y2 + 12y − 4x + 16 = 0
14. x2 + 6x + y + 11 = 0
15. ![]()
16. x2 − 2x − 4y + 17 = 0
17. y2 − 8y + 2x + 10 = 0
18. y2 − 4y − 4x + 3 = 0
19. 4x2 = 2y
20. 3(y − 1)2 = 9x
21. −2x2 + 12x − 8y − 18 = 0
22. 4y2 + 16y − 6x − 2 = 0
23. 6y2 − 12y − 24x − 42 = 0
24. 3x2 + 30x − 8y + 75 = 0
In Problems 25–44, find an equation of the parabola that satisfies the given conditions.
25. Focus (0, 7), directrix y = −7
26. Focus (0, −5), directrix y = 5
27. Focus (−4, 0), directrix x = 4
28.![]()
29. Focus ![]() , vertex (0,0)
, vertex (0,0)
30. Focus (0, −10), vertex (0, 0)
31. Focus (2, 3), directrix y = −3
32. Focus (1, −7), directrix x = −5
33. Focus (−1, 4), directrix x = 5
34. Focus (−2, 0), directrix ![]()
35. Focus (1, 5), vertex (1, −3)
36. Focus (−2, 3), vertex (−2, 5)
37. Focus (8, −3), vertex (0, −3)
38. Focus (1, 2), vertex (7, 2)
39. Vertex (0, 0), directrix ![]()
40. Vertex (0, 0), directrix x = 6
41. Vertex (5, 1), directrix y = 7
42. Vertex (−1, 4), directrix x = 0
43. Vertex (0, 0), through (−2, 8), axis along the y-axis
44. Vertex (0, 0), through ![]() axis along the x-axis
axis along the x-axis
In Problems 45–48, find the x- and y-intercepts of the given parabola.
45. (y + 4)2 = 4(x + 1)
46. (x − 1)2 = −2(y − 1)
47. x2 + 2y − 18 = 0
48. y2 −8y − x + 15 = 0
Miscellaneous Applications
49. Spotlight A large spotlight is designed so that a cross section through its axis is a parabola and the light source is at the focus. Find the position of the light source if the spotlight is 4 ft across at the opening and 2 ft deep.
50. Reflecting Telescope A reflecting telescope has a parabolic mirror that is 20 ft across at the top and 4 ft deep at the center. Where should the eyepiece be located?
51. Light Ray Suppose that a light ray emanating from the focus of the parabola y2 = 4x strikes the parabola at (1, −2)What is the equation of the reflected ray?
52. Suspension Bridge Suppose that two towers of a suspension bridge are 350 ft apart and the vertex of the parabolic cable is tangent to the road midway between the towers. If the cable is 1 ft above the road at a point 20 ft from the vertex, find the height of the towers above the road.
53. Another Suspension Bridge Two 75-ft towers of a suspension bridge with a parabolic cable are 250 ft apart. The vertex of the parabola is tangent to the road midway between the towers. Find the height of the cable above the roadway at a point 50 ft from one of the towers.
54. Drainpipe Assume that the water gushing from the end of a horizontal pipe follows a parabolic arc with vertex at the end of the pipe. The pipe is 20 m above the ground. At a point 2 m below the end of the pipe, the horizontal distance from the water to a vertical line through the end of the pipe is 4 m. See FIGURE 7.1.13. Where does the water strike the ground?
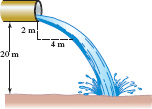
FIGURE 7.1.13 Pipe in Problem 54
55. A Bull’s Eye A dart thrower releases a dart 5 ft above the ground. The dart is thrown horizontally and follows a parabolic path. It hits the ground ![]() ft from the dart thrower. At a distance of 10 ft from the dart thrower, how high should a bull’s eye be placed in order for the dart to hit it?
ft from the dart thrower. At a distance of 10 ft from the dart thrower, how high should a bull’s eye be placed in order for the dart to hit it?
56. Path of a Projectile The vertical position of a projectile is given by the equation y = −16t2 and the horizontal position by x = 40t for t ≥0. By eliminating t between the two equations, show that the path of the projectile is a parabolic arc. Graph the path of the projectile.
57. Focal Width The focal width of a parabola is the length of the focal chord, that is, the line segment through the focus perpendicular to the axis, with endpoints on the parabola. See FIGURE 7.1.14.
(a) Find the focal width of the parabola x2 = 8y.
(b) Show that the focal width of the parabola x2 = 4cy and y2 = 4cx is 4|c|.

FIGURE 7.1.14 Focal width in Problem 57
58. Parabolic Orbit The orbit of a comet is a parabola with the Sun at the focus. When the comet is 50,000,000 km from the Sun, the line from the comet to the Sun is perpendicular to the axis of the parabola. Use the result of Problem 57(b) to write an equation of the comet’s path. (A comet with a parabolic path will not return to the Solar System.)
For Discussion
59. Suppose that two parabolic reflecting surfaces face one another (with foci on a common axis). Any sound emitted at one focus will be reflected off the parabolas and concentrated at the other focus. FIGURE 7.1.15 shows the paths of two typical sound waves. Using the definition of a parabola on page 367, show that all waves will travel the same distance. [Note: This result is important for the following reason: If the sound waves traveled paths of different lengths, then the waves would arrive at the second focus at different times. The result would be interference rather than clear sound.]
60. The point closest to the focus is the vertex. How would you go about proving this? Carry out your ideas.
61. For the comet in Problem 58, use the result of Problem 60 to determine the shortest distance between the Sun and the comet.

FIGURE 7.1.15 Parabolic reflecting surfaces in Problem 59
Introduction The ellipse occurs frequently in astronomy. For example, the paths of the planets around the Sun are elliptical with the Sun located at one focus. Similarly, communication satellites, the Hubble Space Telescope, and the International Space Station revolve around the Earth in elliptical orbits with the Earth at one focus. In this section we define the ellipse and study some of its properties and applications.
DEFINITION 7.2.1 Ellipse
An ellipse is the set of points P(x,y) in the plane such that the sum of the distances between P and two fixed points F1 and F2 is constant. The fixed points F1 and F2 are called foci (plural for focus). The midpoint of the line segment joining points F1 and F2 is called the center of the ellipse.
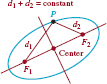
FIGURE 7.2.1 An ellipse
As shown in FIGURE 7.2.1, if P is a point on the ellipse and if d1 = d(F1, P) and d2 = d(F2, P) are the distances from the foci to p, then the preceding definition asserts that
![]()
where k > 0 is some constant.
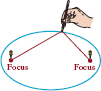
FIGURE 7.2.2 A way to draw an ellipse
On a practical level, equation (1) suggests a way of generating an ellipse. FIGURE 7.2.2 shows that if a string of length k is attached to a piece of paper by two tacks, then an ellipse can be traced out by inserting a pencil against the string and moving it in such a manner that the string remains taut.
![]() Ellipse with Center (0, 0) We now derive an equation of the ellipse. For algebraic convenience, let us choose k = 2a > 0 and put the foci on the x-axis with coordinates F1 (−c, 0) and F2 (c, 0) as shown in FIGURE 7.2.3. It follows from (1) that
Ellipse with Center (0, 0) We now derive an equation of the ellipse. For algebraic convenience, let us choose k = 2a > 0 and put the foci on the x-axis with coordinates F1 (−c, 0) and F2 (c, 0) as shown in FIGURE 7.2.3. It follows from (1) that
![]()
We square both sides of the second equation in (2) and simplify,
![]()
Squaring a second time gives,

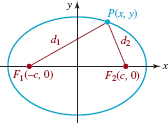
FIGURE 7.2.3 Ellipse with center (0, 0) and foci on the x-axis
Referring to Figure 7.2.3, we see that the points F1, F2, and P form a triangle. Because the sum of the lengths of any two sides of a triangle is greater than the remaining side, we must have 2a > 2c or a > c. Hence, a2 − c2 > 0 When we let b2 = a2 − c2 then (3) becomes b2x2 + a2y2 = a2b2. Dividing this last equation by a2b2 gives
![]()
Equation (4) is called the standard form of the equation of an ellipse centered at (0, 0) with foci (−c, 0) and (c, 0) where is defined by b2 = a2 − c2 and a > b > 0.
If the foci are placed on the y-axis, then a repetition of the above analysis leads to
![]()
Equation (5) is called the standard form of the equation of an ellipse centered at (0, 0) with foci (0, −c) and (0, c) where c is defined by b2 = a2 − c2 and a > b > 0.
![]() Major and Minor Axes The major axis of an ellipse is the line segment through its center, containing the foci, and with endpoints on the ellipse. For an ellipse with standard form equation (4) the major axis is horizontal, whereas for (5) the major axis is vertical. The line segment through the center, perpendicular to the major axis, and with endpoints on the ellipse, is called the minor axis. The two endpoints of the major axis are called the vertices of the ellipse. For (4) the vertices are the x-intercepts. Setting y = 0 in (4) gives x = ±a The vertices are then (−a, 0) and (a, 0). For (5) the vertices are the y-intercepts (0, −a) and (0, −a. For equation (4), the endpoints of the minor axis are (0, −b) and (0, b); for (5) the endpoints are (−b, 0) and (b, 0). For either (4) or (5), the length of the major axis is a − (−a) = 2a; the length of the minor axis is 2b. Since a > b the major axis of an ellipse is always longer than its minor axis.
Major and Minor Axes The major axis of an ellipse is the line segment through its center, containing the foci, and with endpoints on the ellipse. For an ellipse with standard form equation (4) the major axis is horizontal, whereas for (5) the major axis is vertical. The line segment through the center, perpendicular to the major axis, and with endpoints on the ellipse, is called the minor axis. The two endpoints of the major axis are called the vertices of the ellipse. For (4) the vertices are the x-intercepts. Setting y = 0 in (4) gives x = ±a The vertices are then (−a, 0) and (a, 0). For (5) the vertices are the y-intercepts (0, −a) and (0, −a. For equation (4), the endpoints of the minor axis are (0, −b) and (0, b); for (5) the endpoints are (−b, 0) and (b, 0). For either (4) or (5), the length of the major axis is a − (−a) = 2a; the length of the minor axis is 2b. Since a > b the major axis of an ellipse is always longer than its minor axis.
A summary of all this information for equations (4) and (5) is given in FIGURE 7.2.4.
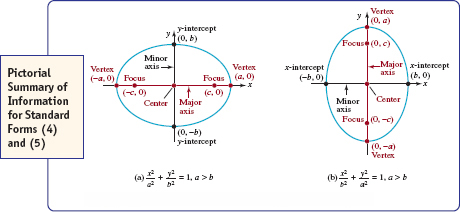
FIGURE 7.2.4 Summary of information for standard forms (4) and (5)
EXAMPLE 1 Vertices and Foci
Find the vertices and foci of the ellipse whose equation is 3x2 + y2 = 9. Graph.
Solution By dividing both sides of the equality by 9 the standard form of the equation is
![]()
We see that 9 > 3 and so we identify the equation with (5). From a2 = 9 and b2 = 3, we see that a = 3 and b = ![]() The major axis is vertical with vertices (0, -3) and (0, 3). The minor axis is horizontal with endpoints (−
The major axis is vertical with vertices (0, -3) and (0, 3). The minor axis is horizontal with endpoints (−![]() , 0) and (
, 0) and (![]() , 0). Of course, the vertices are also the y-intercepts and the endpoints of the minor axis are the x-intercepts. Now, to find the foci we use b2 = a2 – c2 or c2 = a2 – b2 to write
, 0). Of course, the vertices are also the y-intercepts and the endpoints of the minor axis are the x-intercepts. Now, to find the foci we use b2 = a2 – c2 or c2 = a2 – b2 to write ![]() . With a =3, b =
. With a =3, b = ![]() , we get
, we get ![]() Hence, the foci are on the y-axis at
Hence, the foci are on the y-axis at ![]() and
and ![]() The graph is given in FIGURE 7.2.5.
The graph is given in FIGURE 7.2.5.
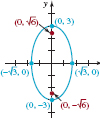
FIGURE 7.2.5 Ellipse in Example 1
Example 2 Finding an Equation of an Ellipse
Find an equation of the ellipse with a focus (2, 0) and an x-intercept (5, 0)
Solution Since the given focus is on the x-axis, we can find an equation in standard form (4). Consequently, c = 2, a = 5, a2 = 25, and b2 = a2 − c2 or b2 = 52 − 22 = 21. The desired equation is
![]()
![]() Ellipse with Center (h, k) When the center is at (h, k), the standard form for the equation of an ellipse is either
Ellipse with Center (h, k) When the center is at (h, k), the standard form for the equation of an ellipse is either
![]()
or
![]()
The ellipses defined by these equations are identical in shape to the ellipses defined by equations (4) and (5) since equations (6) and (7) represent rigid transformations of the graphs of (4) and (5). For example, the ellipse
![]()
has center (1, −3) Its graph is the graph of x2/9 + y2/16 = 1 shifted horizontally one unit to the right followed by a downward vertical shift of three units.
It is not a good idea to memorize formulas for the vertices and foci of an ellipse with center (h, k). Everything is the same as before: a, b, and c are positive and a > b, a > c. You can locate vertices, foci, and endpoints of the minor axis using the fact that a is the distance from the center to a vertex, b is the distance from the center to an endpoint on the minor axis, and is the distance from the center to a focus. Also, the number c is still defined by the equation b2 = a2 − c2.
Example 3 Ellipse Centered at (h,k)
Find the center, vertices, and foci of the ellipse 4x2 + 16y2 − 8x − 96y + 84 = 0. Graph.
Solution To write the given equation in one of the standard forms (6) or (7) we must complete the square in x and in y. Recall that in order to complete the square we want the coefficients of the quadratic terms x2 and y2 to be 1. To do this we factor 4 from both and and factor 16 from both x2 and x and factor 16 from both y2 and y:
![]()
Then from
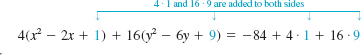
we obtain
![]()
or
![]()
From (8) we see that the center of the ellipse is (1, 3). Since the last equation has the standard form (6), we identify a2 = 16 or a = 4 and b2 = 4 or b = 2. The major axis is horizontal and lies on the horizontal line y = 3 passing through (1, 3). This is the red horizontal dashed line segment in FIGURE 7.2.6. By measuring a = 4 units to the left and then to the right of the center along the line y = 3 we arrive at the verties (−3, 3) and (5, 3) By measuring units both down and up the vertical line x = 1 through the center, we arrive at the endpoints of the minor axis (1, 1) and (1, 5). The minor axis is the black dashed vertical line segment in Figure 7.2.6. Because c2 = a2 − b2 = 16 − 4 = 12, c = 2![]() . Finally, by measuring c = 2
. Finally, by measuring c = 2![]() units to the left and right of the center along y = 3, we obtain the foci (1 −2
units to the left and right of the center along y = 3, we obtain the foci (1 −2![]() , 3) and (1 +2
, 3) and (1 +2![]() , 3).
, 3).
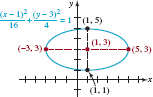
FIGURE 7.2.6 Ellipse in Example 3
![]() Review the dicussion following Example 6 in Section 2.1.
Review the dicussion following Example 6 in Section 2.1.
Example 4 Two Functions
In Example 1, if we solve the equation of the ellipse 3x2 + y2 = 9 for the variable y in terms of x we obtain two functions,
![]()
The domain of each of these functions is the interval [−![]() ,
, ![]() ]. The graphs of
]. The graphs of ![]() and
and ![]() are, in turn, the upper half-ellipse given in FIGURE 7.2.7(a) and the lower half-ellipse in Figure 7.2.7(b).
are, in turn, the upper half-ellipse given in FIGURE 7.2.7(a) and the lower half-ellipse in Figure 7.2.7(b).

FIGURE 7.2.7 Two half-ellipses defined by the functions in Example 4
To graph an ellipse on a calculator you may have to resort to superimposing the graphs of two half-ellipses defined by two functions in order to obtain the graph of the complete ellipse.
EXAMPLE 5 Finding an Equation of an Ellipse
Find an equation of the ellipse with center (2, −1), vertical major axis of length 6, and minor axis of length 3.

FIGURE 7.2.8 Graphical interpretation of data in Example 5
Solution The length of the major axis is 2a = 6; hence a = 3. Similarly, the length of the minor axis is ![]() . By sketching the center and the axes, we see from FIGURE 7.2.8 that the vertices are (2, 2) and (2, −4) and the endpoints of the minor axis are (
. By sketching the center and the axes, we see from FIGURE 7.2.8 that the vertices are (2, 2) and (2, −4) and the endpoints of the minor axis are (![]() , −1) and
, −1) and ![]() . Because the major axis is vertical, the standard equation of this ellipse is
. Because the major axis is vertical, the standard equation of this ellipse is
![]()
![]() Eccentricity Associated with each conic section is a number e called its eccentricity. The eccentricity of an ellipse is defined to be
Eccentricity Associated with each conic section is a number e called its eccentricity. The eccentricity of an ellipse is defined to be
![]()
where ![]() . Since
. Since ![]() implies
implies ![]() the eccentricity of an ellipse satisfies 0 < e < 1.
the eccentricity of an ellipse satisfies 0 < e < 1.
Example 6 Example 3 Revisited
Determine the eccentricity of the ellipse in Example 3.
Solution In the solution of Example 3 we found that a = 4 and c = 2 ![]() . Hence, the eccentricity of the ellipse is e = (2
. Hence, the eccentricity of the ellipse is e = (2![]() )/4 =
)/4 = ![]() /2 ≈ 0.87.
/2 ≈ 0.87.
Eccentricity is an indicator of the shape of an ellipse. When e ≈ 0, that is, e is close to zero, the ellipse is nearly circular, and when e ≈ 1 the ellipse is flattened or elongated. To see this, observe that if e is close to 0, it follows from ![]() that
that ![]() and consequently a ≈ b. As you can see from the standard equations in (4) and (5), this means that the shape of the ellipse is close to circular. Also, because c is the distance from the center of the ellipse to a focus, the two foci are close together near the center. See FIGURE 7.2.9(a). On the other hand, if e ≈ 1 or
and consequently a ≈ b. As you can see from the standard equations in (4) and (5), this means that the shape of the ellipse is close to circular. Also, because c is the distance from the center of the ellipse to a focus, the two foci are close together near the center. See FIGURE 7.2.9(a). On the other hand, if e ≈ 1 or ![]() , then
, then ![]() and so b ≈ 0. Also, c ≈ a means that the foci are far apart; each focus is close to a vertex. Thus, the ellipse is elongated as shown in Figure 7.2.9(b).
and so b ≈ 0. Also, c ≈ a means that the foci are far apart; each focus is close to a vertex. Thus, the ellipse is elongated as shown in Figure 7.2.9(b).

FIGURE 7.2.9 Effect of eccentricity on the shape of an ellipse

Statuary Hall in Washington, DC
![]() Applications of the Ellipse Ellipses have a reflection property analogous to the one discussed in Section 7.1 for the parabola. It can be shown that if a light or sound source is placed at one focus of an ellipse, then all rays or waves will be reflected off the ellipse to the other focus. See FIGURE 7.2.10. For example, if a pool table is constructed in the form of an ellipse with a pocket at one focus, then any shot originating at the other focus will never miss the pocket. Similarly, if a ceiling is elliptical with two foci on (or near) the floor but considerably distant from each other, then anyone whispering at one focus will be heard at the other. Some famous “whispering galleries” are the Statuary Hall at the Capitol in Washington, DC, the Mormon Tabernacle in Salt Lake City, and St. Paul’s Cathedral in London.
Applications of the Ellipse Ellipses have a reflection property analogous to the one discussed in Section 7.1 for the parabola. It can be shown that if a light or sound source is placed at one focus of an ellipse, then all rays or waves will be reflected off the ellipse to the other focus. See FIGURE 7.2.10. For example, if a pool table is constructed in the form of an ellipse with a pocket at one focus, then any shot originating at the other focus will never miss the pocket. Similarly, if a ceiling is elliptical with two foci on (or near) the floor but considerably distant from each other, then anyone whispering at one focus will be heard at the other. Some famous “whispering galleries” are the Statuary Hall at the Capitol in Washington, DC, the Mormon Tabernacle in Salt Lake City, and St. Paul’s Cathedral in London.
Using his Law of Universal Gravitation and the newly developed calculus, Isaac Newton was the first to prove Kepler’s first law of planetary motion:
The orbit of each planet about the Sun is an ellipse with the Sun at one focus.
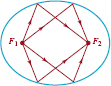
FIGURE 7.2.10 Reflection property of an ellipse
EXAMPLE 7 Eccentricity of Earth’s Orbit
The perihelion distance of the Earth (the least distance between the Earth and the Sun) is approximately 9.16 × 10⁷ miles, and its aphelion distance (the greatest distance between the Earth and the Sun) is approximately 9.46 × 10⁷ miles. What is the eccentricity of Earth’s orbit?
Solution Let us assume that the orbit of the Earth is as shown in FIGURE 7.2.11. From the figure we see that
![]()
Solving this system of equations gives a = 9.31 × 10⁷ and c = 0.15 × 10⁷. Thus the eccentricity e = c/a is
![]()
The orbits of seven of the planets have eccentricities less than 0.1 and, hence, the orbits are not far from circular. The planet Mercury is the exception. The orbit of the dwarf planet Pluto has the eccentricity 0.25. Many of the asteroids and comets have highly eccentric orbits. The orbit of the asteroid Hildago is one of the most eccentric, with e = 0.66. Another notable case is the orbit of Comet Halley. See Problem 47 in Exercises 7.2.
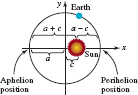
FIGURE 7.2.11 Graphical interpretation of data in Example 7
7.2 Exercises Answers to selected odd-numbered problems begin on page ANS–20.
In Problems 1–20, find the center, foci, vertices, endpoints of the minor axis, and eccentricity of the given ellipse. Graph the ellipse.
1. ![]()
2. ![]()
3. ![]()
4. ![]()
5. 9x2 + 16y2 = 144
6. 2x2 + y2 = 4
7. 9x2 + 4y2 = 36
8. x2 + 4y2 = 4
9. ![]()
10. ![]()
11. ![]()
12. ![]()
13. ![]()
14. 36(x + 2)2 + (y − 4)2 = 72
15. 5(x − 2)2 + 3(y + 2)2 = 45
16. 6(x − 2)2 + 8y2 = 48
17. 25x2 + 9y2 − 100x + 18y − 116 = 0
18. 9x2 + 5y2 + 18x − 10y − 31 = 0
19. x2 + 3y2 + 18y + 18 = 0
20. 12x2 + 4y2 − 24x − 4y + 1 = 0
In Problems 21–40, find an equation of the ellipse that satisfies the given conditions.
21. Vertices (±5, 0), foci (±3, 0)
22. Vertices (±9, 0), foci (±2, 0)
23. Vertices (0, ±3), foci (0, ±1)
24. Vertices (0, ±7), foci (0, ±3)
25. Vertices (0, ±3), endpoints of minor axis (±1, 0)
26. Vertices (±4, 0), endpoints of minor axis (0, ±2)
27. Vertices (−3, −3), (5, −3), endpoints of minor axis (1, −1), (1, −5)
28. Vertices (1, −6), (1, 2), endpoints of minor axis (−2, −2), (4, −2)
29. One focus (0, −2), center at origin, b = 3
30. One focus (1, 0), center at origin, a = 3
31. Foci ![]() , length of minor axis 6
, length of minor axis 6
32. Foci ![]() , length of major axis 16
, length of major axis 16
33. Foci (0, ±3), passing through ![]()
34. Vertices (±5, 0), passing through ![]()
35. Vertices (±4, 1), passing through ![]() , 2)
, 2)
36. Center (1, −1), one focus (1, 1), a = 5
37. Center (1, 3), one focus (1, 0), one vertex (1, −1)
38. Center (5, −7), length of vertical major axis 8, length of minor axis 6
39. Endpoints of minor axis (0, 5), (0, −1), one focus (6, 2)
40. Endpoints of major axis (2, 4), (13, 4), one focus (4, 4)
In Problems 41–44, find a function y = f(x) that defines the indicated half-ellipse. Give the domain of each function. The equations are from Problems 1, 3, 9, and 12.
41. ![]() lower half-ellipse
lower half-ellipse
42. ![]() upper half-ellipse
upper half-ellipse
43. ![]() upper half-ellipse
upper half-ellipse
44. ![]() lower half-ellipse
lower half-ellipse
45. The orbit of the planet Mercury is an ellipse with the Sun at one focus. The length of the major axis of this orbit is 72 million miles and the length of the minor axis is 70.4 million miles. What is the least distance (perihelion) between Mercury and the Sun? What is the greatest distance (aphelion)?
46. What is the eccentricity of the orbit of Mercury in Problem 45?
47. The orbit of Comet Halley is an ellipse whose major axis is 3.34 × 10⁹ miles long, and whose minor axis is 8.5 × 10⁸ miles long. What is the eccentricity of the comet’s orbit?
48. A satellite orbits the Earth in an elliptical path with the center of the Earth at one focus. It has a minimum altitude of 200 mi and a maximum altitude of 1000 mi above the surface of the Earth. If the radius of the Earth is 4000 mi, what is an equation of the satellite’s orbit?
Miscellaneous Applications
49. Archway A semielliptical archway has a vertical major axis. The base of the arch is 10 ft across and the highest part of the arch is 15 ft. Find the height of the arch above the point on the base of the arch 3 ft from the center.
50. Gear Design An elliptical gear rotates about its center and is always kept in mesh with a circular gear that is free to move horizontally. See FIGURE 7.2.12. If the origin of the xy-coordinate system is placed at the center of the ellipse, then the equation of the ellipse in its present position is x2 + 3y2 = 8. The diameter of the circular gear equals the length of the minor axis of the elliptical gear. Given that the units are centimeters, how far does the center of the circular gear move horizontally during the rotation from one vertex of the elliptical gear to the next?
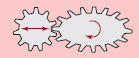
FIGURE 7.2.12 Elliptical and circular gears in Problem 50
51. Carpentry A carpenter wishes to cut an elliptical top for a coffee table from a rectangular piece of wood that is 4 ft by 3 ft utilizing the entire length and width available. If the ellipse is to be drawn using the string and tack method illustrated in Figure 7.2.2, how long should the piece of string be and where should the tacks be placed?
52. Park Design The Ellipse is a park in Washington, DC. It is bounded by an elliptical path with a major axis of length 458 m and a minor axis of length 390 m. Find the distance between the foci of this ellipse.
53. Whispering Gallery Suppose that a room is constructed on a flat elliptical base by rotating a semiellipse 180° about its major axis. Then, by the reflection property of the ellipse, anything whispered at one focus will be distinctly heard at the other focus. If the height of the room is 16 ft and the length is 40 ft, find the location of the whispering and listening posts.

The Ellipse Park in Washington, DC
54. Focal Width The focal width of the ellipse is the length of a focal chord, that is, a line segment, perpendicular to the major axis, through a focus with endpoints on the ellipse. See FIGURE 7.2.13.
(a) Find the focal width of the ellipse x2/9 + y2/4 = 1.
(b) Show that, in general, the focal width of the ellipse x2/a2 + y2/b2 = 1 is 2b2
55. Find an equation of the ellipse with foci (0, 2) and (8, 6) and fixed distance sum 2a = 12. [Hint: Here the major axis is neither horizontal nor vertical; thus none of the standard forms from this section apply. Use the definition of the ellipse.]

FIGURE 7.2.13 Focal width in Problem 54
56. Proceed as in Problem 55, and find an equation of the ellipse with foci (−1, −3) and (−5, 7) and fixed distance sum 2a = 20.
For Discussion
57. The graph of the ellipse x2/4 + (y − 1)2/9 = 1 is shifted 4 units to the right. What are the center, foci, vertices, and endpoints of the minor axis for the shifted graph?
58. The graph of the ellipse (x − 1)2 + (y − 4)2 = 1 is shifted 5 units to the left and 3 units up. What are the center, foci, vertices, and endpoints of the minor axis for the shifted graph?
59. In engineering the eccentricity of an ellipse is often expressed only in terms of a and b. Show that ![]()
60. Look up the definition of semi-ellipse. Are the half-ellipses in Figure 7.2.7 semi-ellipses?
Introduction The definition of a hyperbola is basically the same as the definition of the ellipse with only one exception: the word sum is replaced by the word difference.
DEFINITION 7.3.1 Hyperbola
A hyperbola is the set of points P(x, y) in the plane such that the difference of the distances between P and two fixed points F1 and F2 is constant. The fixed points F1 and F2 are called foci (plural for focus). The midpoint of the line segment joining points F1 and F2 is called the center of the hyperbola.
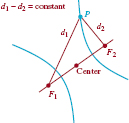
FIGURE 7.3.1 A hyperbola
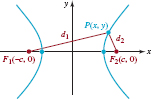
FIGURE 7.3.2 Hyperbola with center (0, 0) and foci on the x-axis
As shown in FIGURE 7.3.1, a hyperbola consists of two branches. If P is a point on the hyperbola, then
![]()
where d1 = d(F1, P) and d2 = d(F2, P).
![]() Hyperbola with Center (0, 0) Proceeding as for the ellipse, we place the foci on the x-axis at F1(−c, 0) and F2(c, 0) as shown in FIGURE 7.3.2 and choose the constant k to be 2a for algebraic convenience. It follows from (1) that
Hyperbola with Center (0, 0) Proceeding as for the ellipse, we place the foci on the x-axis at F1(−c, 0) and F2(c, 0) as shown in FIGURE 7.3.2 and choose the constant k to be 2a for algebraic convenience. It follows from (1) that
![]()
As drawn in FIGURE 7.3.2, P is on the right branch of the hyperbola and so d1 − d2 = 2a > 0. If P is on the left branch then the difference is −2a. Writing (2) as
![]()
or
![]()
we square, simplify, and square again:

From Figure 7.3.2, we see that the triangle inequality gives
d1 < d2 + 2c and d2 < d1 + 2c
or d1 − d2 < 2c and d2 − d1 < 2c.
Using d1 − d2 = ±2a, the last two inequalities imply that 2a < 2c or a < c. Since c > a > 0, c2 − a2 is a positive constant. If we let b2 = c2 − a2, (3) becomes b2x2 − a2y2 = a2b2 or, after dividing by a2b2,
![]()
Equation (4) is called the standard form of the equation of a hyperbola centered at (0, 0) with foci (−c, 0) and (c, 0), where c is defined by b2 = c2 − a2.
When the foci lie on the y-axis, a repetition of the foregoing algebra leads to
![]()
Equation (5) is the standard form of the equation of a hyperbola centered at (0, 0) with foci (0, −c) and (0, c). Here again, c > a and b2 = c2 − a2.
For the hyperbola (unlike the ellipse), bear in mind that in (4) and (5) there is no relationship between the relative sizes of a and b; rather, a2 is always the denominator of the positive term and the intercepts always have ±a as a coordinate.
![]() Note of Caution
Note of Caution
![]() Transverse and Conjugate Axes The line segment with endpoints on the hyperbola and lying on the line through the foci is called the transverse axis; its endpoints are called the vertices of the hyperbola. For the hyperbola described by equation (4), the transverse axis lies on the x-axis. Therefore, the coordinates of the vertices are the x-intercepts. Setting y = 0 gives x2/a2 = 1, or x = ±a. Thus, as shown in FIGURE 7.3.3 the vertices are (−a, 0) and (a, 0); the length of the transverse axis is 2a. Notice that by setting y = 0 in (4), we get 2y2/b2 = 1 or y2 = −b2, which has no real solutions. Hence the graph of any equation in that form has no y-intercepts. Nonetheless, the numbers ±b are important. The line segment through the center of the hyperbola perpendicular to the transverse axis and with endpoints (0, −b) and (0, b) is called the conjugate axis. Similarly, the graph of an equation in standard form (5) has no x-intercepts. The conjugate axis for (5) is the line segment with endpoints (−b, 0) and (b, 0).
Transverse and Conjugate Axes The line segment with endpoints on the hyperbola and lying on the line through the foci is called the transverse axis; its endpoints are called the vertices of the hyperbola. For the hyperbola described by equation (4), the transverse axis lies on the x-axis. Therefore, the coordinates of the vertices are the x-intercepts. Setting y = 0 gives x2/a2 = 1, or x = ±a. Thus, as shown in FIGURE 7.3.3 the vertices are (−a, 0) and (a, 0); the length of the transverse axis is 2a. Notice that by setting y = 0 in (4), we get 2y2/b2 = 1 or y2 = −b2, which has no real solutions. Hence the graph of any equation in that form has no y-intercepts. Nonetheless, the numbers ±b are important. The line segment through the center of the hyperbola perpendicular to the transverse axis and with endpoints (0, −b) and (0, b) is called the conjugate axis. Similarly, the graph of an equation in standard form (5) has no x-intercepts. The conjugate axis for (5) is the line segment with endpoints (−b, 0) and (b, 0).
This information for equations (4) and (5) is summarized in Figure 7.3.3.
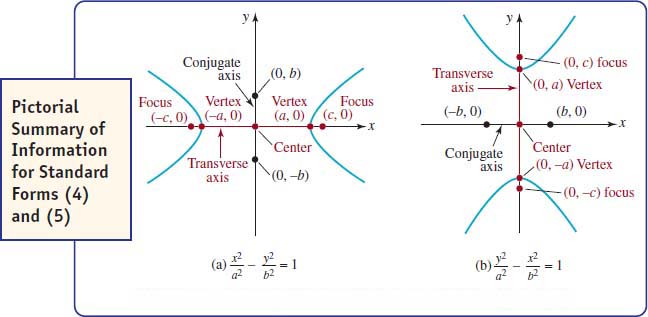
FIGURE 7.3.3 Summary of information for standard forms (4) and (5)
![]() Asymptotes Every hyperbola possesses a pair of slant asymptotes that pass through its center. These asymptotes are indicative of end behavior, and as such are an invaluable aid in sketching the graph of a hyperbola. Solving (4) for y in terms of x gives
Asymptotes Every hyperbola possesses a pair of slant asymptotes that pass through its center. These asymptotes are indicative of end behavior, and as such are an invaluable aid in sketching the graph of a hyperbola. Solving (4) for y in terms of x gives
![]()
As x → – ∞ or as x → ∞, a2/x2 → 0, and thus ![]() . Therefore, for large values of |x|, points on the graph of the hyperbola are close to the points on the lines
. Therefore, for large values of |x|, points on the graph of the hyperbola are close to the points on the lines
![]()
By a similar analysis we find that the slant asymptotes for (5) are
![]()
Each pair of asymptotes intersect at the origin, which is the center of the hyperbola. Note, too, in FIGURE 7.3.4(a) that the asymptotes are simply the extended diagonals of a rectangle of width 2a (the length of the transverse axis) and height 2b (the length of the conjugate axis); in Figure 7.3.4(b) the asymptotes are the extended diagonals of a rectangle of width 2b and height 2a. This rectangle is referred to as the auxiliary rectangle.
We recommend that you do not memorize the equations in (6) and (7). There is an easy method for obtaining the asymptotes of a hyperbola. For example, since ![]() is equivalent to
is equivalent to
![]()
the asymptotes of the hyperbola given in (4) are obtained from a single equation
![]()
Note that (8) factors as the difference of two squares:
![]()
![]() This is a mnemonic, or memory device. It has no geometric significance.
This is a mnemonic, or memory device. It has no geometric significance.
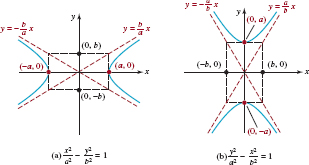
FIGURE 7.3.4 Hyperbolas (4) and (5) with slant asymptotes (in red) as the extended diagonals of the auxiliary rectangles (in black)
Setting each factor equal to zero and solving for y gives an equation of an asymptote. You do not even have to memorize (8) because it is simply the left-hand side of the standard form of the equation of a hyperbola given in (4). In like manner, to obtain the asymptotes for (5) just replace 1 by 0 in the standard form, factor y2/a2 − x2/b2 = 0, and solve for y.
Example 1 Hyperbola Centered at (0, 0)
Find the vertices, foci, and asymptotes of the hyperbola 9x2 − 25y2 = 225. Graph.
Solution We first put the equation into standard form by dividing the left-hand side by 225:
![]()
From this equation we see that a2 = 25 and b2 = 9, and so a = 5 and b = 3. Therefore the vertices are (−5, 0) and (5, 0). Since b2 = c2 − a2 implies c2 = a2 + b2, we have c2 = 34, and so the foci are ![]() and
and ![]() . To find the slant asymptotes we use the standard form (9) with 1 replaced by 0:
. To find the slant asymptotes we use the standard form (9) with 1 replaced by 0:
![]()
Setting each factor equal to zero and solving for y gives the asymptotes y = ±3x/5. We plot the vertices and graph the two lines through the origin. Both branches of the hyperbola must become arbitrarily close to the asymptotes as x → ± ∞. See FIGURE 7.3.5.

FIGURE 7.3.5 Hyperbola in Example 1
EXAMPLE 2 Finding an Equation of a Hyperbola
Find an equation of the hyperbola with vertices (0, −4), (0, 4) and asymptotes ![]()
Solution The center of the hyperbola is (0, 0). This is revealed by the fact that the asymptotes intersect at the origin. Moreover, the vertices are on the y-axis and are 4 units on either side of the origin. Thus the equation we seek is of form (5). From (7) or Figure 7.3.4(b), the asymptotes must be of the form ![]() so that a/b = 1/2. From the given vertices we identify a = 4, and so
so that a/b = 1/2. From the given vertices we identify a = 4, and so
![]()
The equation of the hyperbola is then
![]()
![]() Hyperbola with Center (h, k) When the center of the hyperbola is (h, k) the standard form analogues of equations (4) and (5) are, in turn,
Hyperbola with Center (h, k) When the center of the hyperbola is (h, k) the standard form analogues of equations (4) and (5) are, in turn,
![]()
and
![]()
As in (4) and (5), the numbers a2, b2, and c2 are related by b2 = c2 − a2.
You can locate vertices and foci using the fact that a is the distance from the center to a vertex and c is the distance from the center to a focus. The slant asymptotes for (10) can be obtained by factoring

Similarly, the asymptotes for (11) can be obtained from factoring
![]()
setting each factor equal to zero and solving for y in terms of x. As a check on your work, remember that (h, k) must be a point that lies on each asymptote.
EXAMPLE 3 Hyperbola Centered at (h, k)
Find the center, vertices, foci, and asymptotes of the hyperbola
4x2 − y2 − 8x − 4y − 4 = 0.
Graph.
Solution Before completing the square in x and y, we factor 4 from the two x-terms and factor −1 from the two y-terms so that the leading coefficient in each expression is 1. Then we have


FIGURE 7.3.6 Hyperbola in Example 3
We see now that the center is (1, −2). Since the term in the standard form involving x has the positive coefficient, the transverse axis is horizontal along the line y = −2, and we identify a = 1 and b = 2. The vertices are 1 unit to the left and to the right of the center at (0, −2) and (2, −2), respectively. From b2 = c2 − a2, we have
c2 = a2 + b2 = 1 + 4 = 5,
and so c = ![]() . Hence the foci are
. Hence the foci are ![]() units to the left and the right of the center (1, −2) at (1 −
units to the left and the right of the center (1, −2) at (1 − ![]() , −2) and (1 +
, −2) and (1 + ![]() , −2). To find the asymptotes, we solve
, −2). To find the asymptotes, we solve
![]()
for y. From y + 2 = ±2(x − 1) we find that the asymptotes are y = −2x and y = 2x − 4. Observe that by substituting x = 1, both equations give y = −2, which means that both lines pass through the center. We then locate the center, plot the vertices, and graph the asymptotes. As shown in FIGURE 7.3.6, the graph of the hyperbola passes through the vertices and becomes closer and closer to the asymptotes as x → ±∞.
EXAMPLE 4 Finding an Equation of a Hyperbola
Find an equation of the hyperbola with center (2, −3), passing through the point (4, 1), and having one vertex (2, 0).
Solution Since the distance from the center to one vertex is a, we have a = 3. From the location of the center and the vertex, it follows that the transverse axis is vertical and lies along the line x = 2. Therefore, the equation of the hyperbola must be of form (11):
![]()
where b2 is yet to be determined. Since the point (4, 1) is on the graph on the hyperbola, its coordinates must satisfy equation (12). From
we find ![]() . We conclude that the desired equation is
. We conclude that the desired equation is
![]()
![]() Eccentricity Like the ellipse, the equation that defines the eccentricity of a hyperbola is e = c/a. Except in this case the number c is given by
Eccentricity Like the ellipse, the equation that defines the eccentricity of a hyperbola is e = c/a. Except in this case the number c is given by ![]() . Since
. Since ![]() , the eccentricity of a hyperbola satisfies e > 1. As with the ellipse, the magnitude of the eccentricity of a hyperbola is an indicator of its shape. FIGURE 7.3.7 shows examples of two extreme cases: e ≈ 1 and e much greater than 1.
, the eccentricity of a hyperbola satisfies e > 1. As with the ellipse, the magnitude of the eccentricity of a hyperbola is an indicator of its shape. FIGURE 7.3.7 shows examples of two extreme cases: e ≈ 1 and e much greater than 1.

FIGURE 7.3.7 Effect of eccentricity on the shape of a hyperbola
EXAMPLE 5 Eccentricity of a Hyperbola
Find the eccentricity of the hyperbola ![]()
Solution Identifying a2 = 2 and b2 = 36, we get c2 = 2 + 36 = 38. Thus the eccentricity of the given hyperbola is
![]()
We conclude that the hyperbola is one whose branches open widely as in Figure 7.3.7(b).
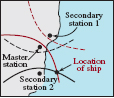
FIGURE 7.3.8 The idea behind LORAN
![]() Applications of the Hyperbola The hyperbola has several important applications involving sounding techniques. In particular, several navigational systems utilize hyperbolas as follows. Two fixed radio transmitters at a known distance from each other transmit synchronized signals. The difference in reception times by a navigator determines the difference 2a of the distances from the navigator to the two transmitters. This information locates the navigator somewhere on the hyperbola with foci at the transmitters and fixed difference in distances from the foci equal to 2a. By using two sets of signals obtained from a single master station paired with each of two secondary stations, the long-range navigation system LORAN locates a ship or plane at the intersection of two hyperbolas. See FIGURE 7.3.8.
Applications of the Hyperbola The hyperbola has several important applications involving sounding techniques. In particular, several navigational systems utilize hyperbolas as follows. Two fixed radio transmitters at a known distance from each other transmit synchronized signals. The difference in reception times by a navigator determines the difference 2a of the distances from the navigator to the two transmitters. This information locates the navigator somewhere on the hyperbola with foci at the transmitters and fixed difference in distances from the foci equal to 2a. By using two sets of signals obtained from a single master station paired with each of two secondary stations, the long-range navigation system LORAN locates a ship or plane at the intersection of two hyperbolas. See FIGURE 7.3.8.
The next example illustrates the use of a hyperbola in another situation involving sounding techniques.
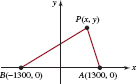
FIGURE 7.3.9 Graph for Example 6
Example 6 Locating a Big Blast
The sound of a dynamite blast is heard at different times by two observers at points A and B. Knowing that the speed of sound is approximately 1100 ft/s or 335 m/s, it is determined that the blast occurred 1000 meters closer to point A than to point B. If A and B are 2600 meters apart, show that the location of the blast lies on a branch of a hyperbola. Find an equation of the hyperbola.
Solution In FIGURE 7.3.9, we have placed the points A and B on the x-axis at (1300, 0) and (−1300, 0), respectively. If P(x, y) denotes the location of the blast, then
d(P, B) − d(P, A) = 1000.
From the definition of the hyperbola on page 382 and the derivation following it, we see that this is the equation for the right branch of a hyperbola with fixed distance difference 2a = 1000 and c = 1300. Thus the equation has the form
![]()
or after solving for x,
![]()
With a = 500 and c = 1300, b2 = (1300)2 − (500)2 = (1200)2. Substituting in the foregoing equation gives
![]()
To find the exact location of the blast in Example 6 we would need another observer hearing the blast at a third point C. Knowing the time between when this observer hears the blast and when the observer at A hears the blast, we find a second hyperbola. The actual point of detonation is a point of intersection of the two hyperbolas.
There are many other applications of the hyperbola. As shown in FIGURE 7.3.10(a), a plane flying at a supersonic speed parallel to level ground leaves a hyperbolic sonic “footprint” on the ground. Like the parabola and ellipse, a hyperbola also possesses a reflecting property. The Cassegrain reflecting telescope shown in Figure 7.3.10(b) utilizes a convex hyperbolic secondary mirror to reflect a ray of light back through a hole to an eyepiece (or camera) behind the parabolic primary mirror. This telescope construction makes use of the fact that a beam of light directed along a line through one focus of a hyperbolic mirror will be reflected on a line through the other focus. The most famous telescope in the world (or out of the world), the Hubble Space Telescope, is an example of a Cassegrain telescope. See the website:

FIGURE 7.3.10 Applications of hyperbolas
http://hubblesite.org/the_telescope/hubble_essentials/
Orbits of objects in the universe can be parabolic, elliptic, or hyperbolic. When an object passes close to the Sun (or a planet), it is not necessarily captured by the gravitational field of the larger body. Under certain conditions, the object picks up a fractional amount of orbital energy of this much larger body and the resulting “slingshot-effect” orbit of the object as it passes the Sun is hyperbolic. See Figure 7.3.10(c).

Hubble Space Telescope
7.3 Exercises Answers to selected odd-numbered problems begin on page ANS–1
In Problems 1–20, find the center, foci, vertices, asymptotes, and eccentricity of the given hyperbola. Graph the hyperbola.
1. ![]()
2. ![]()
3. ![]()
4. ![]()
5. 4x2 − 16y2 = 64
6. 5x2 − 5y2 = 25
7. y2 − 5x2 = 20
8. 9x2 − 16y2 + 144 = 0
9. ![]()
10. ![]()
11. ![]()
12. ![]()
13. 25(x − 3)2 − 5(y −1)2 = 125
14. ![]()
15. 8(x + 4)2 − 5(y − 7)2 + 40 = 0
16. 9(x + 1)2 − 81(y − 2)2 = 9
17. 5x2 − 6y2 − 20x + 12y − 16 = 0
18. 16x2 − 25y2 − 256x − 150y + 399 = 0
19. 4x2 − y2 − 8x + 6y − 4 = 0
20. 2y2 − 9x2 − 18x + 20y + 5 = 0
In Problems 21–44, find an equation of the hyperbola that satisfies the given conditions.
21. Foci (±5, 0), a = 3
22. Foci (±10, 0), b = 2
23. Foci (0, ±4), one vertex (0, −2)
24. Foci (0, ±3), one vertex ![]()
25. Foci (±4, 0), length of transverse axis 6
26. Foci (0, ±7), length of transverse axis 10
27. Center (0, 0), one vertex ![]() , one focus (0, 23)
, one focus (0, 23)
28. Center (0, 0), one vertex (7, 0), one focus (9, 0)
29. Center (0, 0), one vertex (−2, 0), one focus (−3, 0)
30. Center (0, 0), one vertex (1, 0), one focus (5, 0)
31. Vertices (0, ±8), asymptotes y = ±2x
32. Foci (0, ±3), asymptotes ![]()
33. Vertices (±2, 0), asymptotes ![]()
34. Foci (±5, 0), asymptotes ![]()
35. Center (1, −3), one focus (1, −6), one vertex (1, −5)
36. Center (2, 3), one focus (0, 3), one vertex (3, 3)
37. Foci (−4, 2), (2, 2), one vertex (−3, 2)
38. Vertices (2, 5), (2, −1), one focus (2, 7)
39. Vertices (±2, 0), passing through (2![]() , 4)
, 4)
40. Vertices (0, ±3), passing through ![]()
41. Center (−1, 3), one vertex (−1, 4), passing through (−5, 3 + ![]() )
)
42. Center (3, −5), one vertex (3, −2), passing through (1, −1)
43. Center (2, 4), one vertex (2, 5), one asymptote 2y − x − 6 = 0
44. Eccentricity ![]() , endpoints of conjugate axis (−5, 4), (−5, 10)
, endpoints of conjugate axis (−5, 4), (−5, 10)

FIGURE 7.3.11 Reflecting property in Problem 50

FIGURE 7.3.12 Focal width in Problem 52
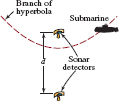
FIGURE 7.3.13 Sonic detectors in Problem 53
In Problems 45–48, find a function y = f(x) by solving the given equation for the variable y and taking the nonnegative root. Give the domain of the function. Describe the graph of y = f(x) in words. The equations are from Problems 1, 3, 11, and 16.
45. ![]()
46. ![]()
47. ![]()
48. 9(x − 1) − 81(y − 2)2 = 9
49. Three points are located at A(−10, 16), B(22, 0), and C(2, 0), where the units are kilometers. An artillery gun is known to lie on the line segment between A and C, and using sounding techniques it is determined that the gun is 2 km closer to B than to C. Find the point where the gun is located.
50. It can be shown that a ray of light emanating from one focus of a hyperbola will be reflected back along the line from the opposite focus. See FIGURE 7.3.11. A light ray from the left focus of the hyperbola x2/16 − y2/20 = 1 strikes the hyperbola at (−6, −5). Find an equation of the reflected ray.
51. Find an equation of the hyperbola with foci (0, −2) and (8, 4) and fixed distance difference 2a = 8. [Hint: See Problem 55 in Exercises 7.2.]
52. Focal Width The focal width of a hyperbola is the length of a focal chord, that is, a line segment, perpendicular to the line containing the transverse axis and through a focus, with endpoints on the hyperbola. See FIGURE 7.3.12.
(a) Find the focal width of the hyperbola x2/4 − y2/9 = 1.
(b) Show that, in general, the focal width of the hyperbola x2/a2 − y2/b2 = 1 is 2b2/a.
For Discussion
53. Sub Hunting Two sonar detectors are located at a distance d from one another. Suppose that a sound (such as a sneeze aboard a submarine) is heard at the two detectors with a time delay h between them. See FIGURE 7.3.13. Assume that sound travels in straight lines to the two detectors with speed v.
(a) Explain why h cannot be larger than d/v.
(b) Explain why, for given values of d, v, and h, the source of the sound can be determined to lie on one branch of a hyperbola. [Hint: Where do you suppose that the foci might be?]
(c) Find an equation for the hyperbola in part (b), assuming that the detectors are at the points (0, d/2) and (0, −d/2). Express the answer in the standard form y2/a2 − x2/b2 = 1.
54. The hyperbolas
![]()
are said to be conjugates of each other.
(a) Find the equation of the hyperbola that is conjugate to
![]()
(b) Discuss how the graphs of conjugate hyperbolas are related.
55. A rectangular hyperbola is one for which the asymptotes are perpendicular.
(a) Show that y2 − x2 + 5y + 3x = 1 is a rectangular hyperbola.
(b) Which of the hyperbolas given in Problems 1–20 are rectangular?
56. Suppose a hyperbola is rectangular. See Problem 55.
(a) How are the constants a and b related?
(b) Show that all rectangular hyperbolas have the same eccentricity.
Introduction In the introduction to Section 7.1 we pointed out that equations of conic sections are special cases of the general second-degree equation
![]()
When B = 0, we obtain the standard forms of equations of circles, parabolas, ellipses, and hyperbolas studied in preceding sections from equations of the form
![]()
by completion of the square. Since each standard form is a second-degree equation we must have A ≠ 0 or C ≠ 0 in (2).
In addition to the familiar conics, equation (1) could also represent two intersecting lines, one line, a single point, two parallel lines, or no graph at all. These are referred to as the degenerate cases of equation (1). See Problems 29–31 in Exercises 7.4.
When B ≠ 0, we will see in the discussion that follows that it is possible to remove the xy-term in equation (1) by a rotation of axes. In other words, it is always possible to select the angle of rotation θ so that any equation of the form (1) can be transformed into an equation in x′ and y′ with no x′ y′-term:
![]()
Proceeding as we would for equation (2), we can recast (3) into a standard form and thereby enabling us to identify the conic and graph it in the x′ y′-coordinate plane.

FIGURE 7.4.1 Rotated axes in red
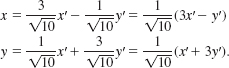
![]() Rotation of Axes We begin with an xy-coordinate system with origin O and rotate the x- and y-axes about O through an angle θ, as shown in FIGURE 7.4.1. In their rotated position we will denote the x- and y-axes by the symbols x′ and y′, respectively. In this manner, any point P in the plane has two sets of coordinates:(x, y) in terms of the original xy-coordinate system and (x′ y′) in terms of the x′ y′-coordinate system. It is a straightforward exercise in trigonometry to show that the xy-coordinates of P can be converted to the new x′ y′-coordinates by
Rotation of Axes We begin with an xy-coordinate system with origin O and rotate the x- and y-axes about O through an angle θ, as shown in FIGURE 7.4.1. In their rotated position we will denote the x- and y-axes by the symbols x′ and y′, respectively. In this manner, any point P in the plane has two sets of coordinates:(x, y) in terms of the original xy-coordinate system and (x′ y′) in terms of the x′ y′-coordinate system. It is a straightforward exercise in trigonometry to show that the xy-coordinates of P can be converted to the new x′ y′-coordinates by
![]()
Conversely, by solving (4) for x and y we obtain a set of equations that allow us to convert the x′ y′-coordinates of P to xy-coordinates:
![]()
See Problem 32 in Exercises 7.4. Of the two sets of rotation equations, (4) and (5), the set given in (5) is the more important for our purposes.

FIGURE 7.4.2 Rotated axes in Example 1
EXAMPLE 1 Coordinates
Suppose that the x-axis is rotated by an angle of 60°. Find
(a) the x′ y′-coordinates of the point whose xy-coordinates are (4, 4),
(b) the xy-coordinates of the point whose x′ y′-coordinates are (3, −5).
Solutions (a) The point (4, 4) is indicated by the black dot in FIGURE 7.4.2. With θ = 60°, x = 4, and y = 4 the equations in (4) give

The x’ y’-coordinates of (4, 4) are (2 + 2![]() , 2 − 2
, 2 − 2![]() ) or approximately (5.46, −1.46).
) or approximately (5.46, −1.46).
(b) The point (3, −5) is indicated by the red dot in FIGURE 7.4.2. With θ = 60°, x’ = 3, and y’ = 25 the equations in (5) give

Thus the xy-coordinates of (3, −5) are ![]() or approximately (5.83, 0.10).
or approximately (5.83, 0.10).
Using the rotation equations in (5) it is possible to determine an angle of rotation u so that any equation of form (1) where B ≠ 0, can be transformed into an equation in x’ and y’ with no x′ y′-term. Substituting the equations in (5) for x and y in (1),
A(x′ cosθ − y′ sinθ)2 + B(x′ cosθ − y′ sinθ)(x′ sinθ + y′ cosθ) + C(x′ sinθ + y′ cosθ)2 + D(x′ cosθ −y′ sinθ) + E(x′ sinθ + y′ cosθ) + F = 0,
and simplifying, we discover that the resulting equation can be written
![]()
The coefficients A′, B′, C′, D′, E′, F′ depend on A, B, C, D, E, F and on sinθ, cosθ. In particular, the coefficient of the x′ y′-term in (6) is
B′ = 2(C − A)sinθcosθ + B(cos2θ − sin2θ).
Thus, in order to eliminate the x′ y′term in (6), we can select any angle θ so that B′ = 0, that is,
2(C — A)sinθcosθ + B(cos2θ – sin2θ) = 0.
By the double-angle formulas for sine and cosine, the last equation is equivalent to
![]()
We have proved the following result.
![]() See (11) and (12) in Section 4.6.
See (11) and (12) in Section 4.6.
THEOREM 7.4.1 Elimination of the xy-Term
The xy-term can be eliminated from the general second-degree equation
Ax2 + Bxy + Cy2 + Dx + Ey + F = 0,
where B ≠ 0, by a rotation of axes through an angle θ that satisfies
![]()
Although equation (7) possesses an infinite number of solutions, it suffices to take a solution such that 0° < θ < 90°. This inequality comes from the three cases:
• If cot2θ = 0, then 2θ = 90° and therefore θ = 45°.
• If cot2θ < 0, then we can take 0° < 2θ < 90° or 0° < θ < 45°.
• If cot2θ < 0, then 90° < 2θ < 180° or 45° < θ < 90°.
EXAMPLE 2 An x′ y′-Equation
The simple equation xy = 1 can be written in terms of x′ and y′ without the product xy. By comparing xy = + with equation (1) we see that A = 0, C = 0, and B = 1. Thus (7) shows cot2θ = 0. Using ![]() , the rotation equations in (5) become
, the rotation equations in (5) become
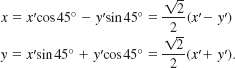
Substituting these expressions for x and y in xy = 1, we obtain

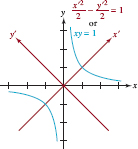
FIGURE 7.4.3 Rotated axes in Example 2
We recognize this as the standard equation of a hyperbola with vertices on the x′-axis at the x′ y′-points ![]() . The asymptotes of the hyperbola are y′ = −x′ and y′ = x′ (which are simply the original x- and y-axes). See FIGURE 7.4.3.
. The asymptotes of the hyperbola are y′ = −x′ and y′ = x′ (which are simply the original x- and y-axes). See FIGURE 7.4.3.
We do not actually have to determine the value of θ if we simply want to obtain an x′ y′-equation to identify the conic. When cot2θ ≠ 0, it is clear that in order to use (5) we only need to know both sin θ and cosθ. To do this, we use the value of cot 2θ to find the value of cos2θ and then use the half-angle formulas
![]()
However, if we wish to sketch the conic, then we need to find θ to determine the position of the x′ and y′ axes. The next example illustrates these ideas.
EXAMPLE 3 Eliminating the xy-Term
After a suitable rotation of axes, identify and sketch the graph of
5x2 + 3xy + y2 = 44.
Solutions With A = 5, B = 3, and C = 1, (7) shows that the desired rotation angle satisfies
![]()
From the discussion following (7), since cot2u is positive, we can choose 2θ such that 0, θ, 45°. From the identity 1 + cot22θ = csc2θ we find ![]() and so
and so ![]() . Then
. Then ![]() . Now from the half-angle formulas in (8), we find
. Now from the half-angle formulas in (8), we find

Thus, the equations in (5) become
Substituting these into the given equation, we have
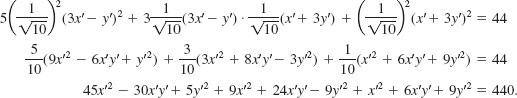
The last equation simplifies to
![]()
We recognize this as the standard equation of an ellipse. Now from (10) we have ![]() and so with the aid of a calculator we find θ ≈ 18.4°. This rotation angle is shown in FIGURE 7.4.4 and we use the new axes to sketch the ellipse.
and so with the aid of a calculator we find θ ≈ 18.4°. This rotation angle is shown in FIGURE 7.4.4 and we use the new axes to sketch the ellipse.
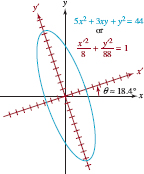
FIGURE 7.4.4 Rotated axes in Example 3
Don’t be misled by the last two examples. After using the rotation equations in (5) the conic section may not be immediately identifiable without some extra work. For example, after an appropriate rotation of axes, the equation
![]()
is transformed into
9x′2 − 24x′ + yr2 + 15 = 0.
After completing the square in x′, (3x′− 4)2 + y′2 = 1, we recognize that the equation (12) defines an ellipse.
![]() Identifying Conics Without Rotation If for the sake of discussion, we simply wish to identify a conic defined by an equation of the form given in (1), we can do so by examining its coefficients. All we need do is calculate the discriminant B2 − 4AC of the equation.
Identifying Conics Without Rotation If for the sake of discussion, we simply wish to identify a conic defined by an equation of the form given in (1), we can do so by examining its coefficients. All we need do is calculate the discriminant B2 − 4AC of the equation.
THEOREM 7.4.2 Identifying Conics
Excluding the degenerate cases, the graph of the second-degree equation (1) is
(i) a parabola when B2 − 4AC = 0,
(ii) an ellipse when B2 − 4AC < 0, or
(iii) a hyperbola when B2 − 4AC > 0.
EXAMPLE 4 Identification
Identify the conic defined by the given equation.
(a) 9x2 + 12xy + 4y2 + 2x − 3y = 0
(b) 3x2 − 5y2 + 8x − y + 2 = 0
Solutions (a) With A = 9, B = 12, C = 4 the discriminant
![]()
indicates that the equation defines a parabola.
(b) With A = 3, B = 0, C = −5 the discriminant is
![]()
The equation defines a hyperbola.
7.4 Exercises Answers to selected odd-numbered problems begin on page ANS-22.
In Problems 1–4, use (4) to find the x′ y′-coordinates of the given xy-point. Use the specified angle of rotation θ.
1. (6, 2), θ = 45°
2. (−2, 8), θ = 30°
3. (−1, −1), θ = 60°
4. (5, 3), θ = 15°
In Problems 5–10, use (5) to find the xy-coordinates of the given x′ y′-point. Use the specified angle of rotation θ.
5. (2, −8), θ = 30°
6. (−5, 7), θ = 45°
7. ![]()
8. ![]()
9. (4, 6), θ = 15°
10. (1, 1), θ = 75°
In Problems 11–16, use rotation of axes to eliminate the xy-term in the given equation. Identify the conic and graph.
11. x2 + xy + y2 = 4
12. 2x2 − 3xy − 2y2 = 5
13. x2 − 2xy + y2 = 8x + 8y
14. 3x2 + 4xy = 16
15. x2 + 4xy − 2y2 − 6 = 0
16. ![]()
In Problems 17–20, use rotation of axes to eliminate the xy-term in the given equation. Identify the conic.
17. 4x2 − 4xy + 7y2 + 12x + 6y − 9 = 0
18. −x2 + 6![]() xy + 5y2 − 8
xy + 5y2 − 8![]() x + 8y = 12
x + 8y = 12
19. 8x2 − 8xy + 2y2 + 10![]() x = 5
x = 5
20. x2 − xy + y2 − 4x − 4y = 20
21. Given 3x2 + 2![]() xy + y2 + 2x − 2
xy + y2 + 2x − 2![]() y = 0.
y = 0.
(a) By rotation of axes show that the graph of the equation is a parabola.
(b) Find the x′ y′-coordinates of the focus. Use this information to find the xy-coordinates of the focus.
(c) Find an equation of the directrix in terms of the x′ y′-coordinates. Use this information to find an equation of the directrix in terms of the xy-coordinates.
22. Given 13x2 − 8xy + 7y2 = 30.
(a) By rotation of axes show that the graph of the equation is an ellipse.
(b) Find the x′ y′-coordinates of the foci. Use this information to find the xy-coordinates of the foci.
(c) Find the xy-coordinates of the vertices.
In Problems 23–28, use the discriminant to determine the type of graph without actually graphing.
23. x2 − 3xy + y2 = 5
24. 2x2 − 2xy + 2y2 = 1
25. 4x2 − 4xy + y2 − 6 = 0
26. ![]()
27. x2 + xy + y2 − x + 2y + 1 = 0
28. ![]()
For Discussion
29. In (2), show that if A and C have the same signs, then the graph of the equation is either an ellipse, a circle, or a point, or does not exist. Give an example of each type of equation.
30. In (2), show that if A and C have opposite signs, then the graph of the equation is either a hyperbola or a pair of intersecting lines. Give an example of each type of equation.
31. In (2), show that if either A = 0 or C = 0, then the graph of the equation is either a parabola, two parallel lines, or one line, or does not exist. Give an example of each type of equation.
32. (a) Use FIGURE 7.4.5 to show that
x = rcosΦ, y = rsinΦ
and
x′ = rcos(Φ − θ), y′ = rsin(Φ − θ).
(b) Use the results from part (a) to derive the rotation equations in (4).
(c) Use (4) to find the rotation equations in (5).
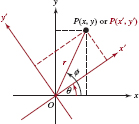
FIGURE 7.4.5 Rotated axes in Problem 32
 Introduction In the plane, or 2-space, one way of describing the position of a point P is to assign to it coordinates relative to two perpendicular coordinate axes called the x- and y-axes. The intersection of the two axes is called the origin and denoted by O. Recall,
![]()
If P is the point of intersection of the vertical line x = a (perpendicular to the x-axis) and the horizontal line y = b (perpendicular to the y-axis), then the ordered pair (a, b) is said to be the rectangular or Cartesian coordinates of the point. See FIGURE 7.5.1. In this section we extend this method of representation of a point to three dimensions.

FIGURE 7.5.1 Point in 2-space
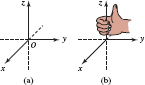
FIGURE 7.5.2 Three-dimensional coordinate axes
![]() Rectangular Coordinate System in 3-Space In three dimensions, or 3-space, a rectangular coordinate system is constructed using three mutually perpendicular coordinate axes. The point at which these axes intersect is called the origin O. The axes drawn as solid lines in FIGURE 7.5.2(a) represent the positive axes, and are labeled in accordance with the so-called right-hand rule illustrated in Figure 7.5.2(b):
Rectangular Coordinate System in 3-Space In three dimensions, or 3-space, a rectangular coordinate system is constructed using three mutually perpendicular coordinate axes. The point at which these axes intersect is called the origin O. The axes drawn as solid lines in FIGURE 7.5.2(a) represent the positive axes, and are labeled in accordance with the so-called right-hand rule illustrated in Figure 7.5.2(b):
• If the fingers of the right hand, pointing in the direction of the positive x-axis, are curled toward the positive y-axis, then the thumb will point in the direction of a new axis perpendicular to the plane of the x- and y-axes. This new axis is labeled the z-axis.
The dashed lines in Figure 7.5.2(a), represent the negative axes. If the x- and y-axes are interchanged in Figure 7.5.2, the coordinate system is said to be left-handed.
In 3-space, the graph of the equations x = a, y = b, and z = c consist of all ordered triples or points of the form (a, y, z), (x, b, z), and (x, y, c), respectively. The graphs of the equations x = a, y = b, and z = c are, in turn, planes perpendicular to the x-, y-, and z-axes. The point P at which these planes intersect can be represented by an ordered triple of numbers (a, b, c) said to be the rectangular, or Cartesian, coordinates of the point. The numbers a, b, and c are called the x-, y-, and z-coordinates of P(a, b, c), respectively. See FIGURE 7.5.3.

FIGURE 7.5.3 Three mutually perpendicular planes intersect in a point
![]() Octants Each pair of coordinate axes determines a coordinate plane. As shown in green in FIGURE 7.5.4, the x- and y-axes determine the xy-coordinate plane, or simply, the xy-plane. Similarly, the y- and z-axes determine the yz-plane, and the x- and z-axes determine the xz-plane. The coordinate planes divide 3-space into eight regions known as octants. The octant in which all three coordinates of a point P(a, b, c) are positive is called the first octant. There is no agreement for naming the other seven octants.
Octants Each pair of coordinate axes determines a coordinate plane. As shown in green in FIGURE 7.5.4, the x- and y-axes determine the xy-coordinate plane, or simply, the xy-plane. Similarly, the y- and z-axes determine the yz-plane, and the x- and z-axes determine the xz-plane. The coordinate planes divide 3-space into eight regions known as octants. The octant in which all three coordinates of a point P(a, b, c) are positive is called the first octant. There is no agreement for naming the other seven octants.
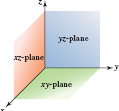
FIGURE 7.5.4 Coordinate planes
The following table summarizes the coordinates of a point either on a coordinate axis or in a coordinate plane. As seen in the table, we can also describe, say, the xy-plane by the simple equation z = 0. Similarly, the xz-plane is y = 0 and the yz-plane is x = 0. A point on a coordinate axes is not considered to be in any octant.
| Axes | Coordinates | Plane | Coordinates |
| x | (x, 0, 0) | xy | (x, y, 0) |
| y | (0, y, 0) | xz | (x, 0, z) |
| z | (0, 0, z) | yz | (0, y, z) |

FIGURE 7.5.5 Points in Example 1
EXAMPLE 1 Graphing Points in 3-Space
Graph the points (4, 5, 6), (3, −3, −1), and (−2, −2, 0).
Solution Of the three points shown in FIGURE 7.5.5 only (4, 5, 6) is in the first octant. The point (−2, −2, 0) lies in the xy-plane.
![]() Distance Formula To find the distance between two points P1(x1, y1, z1) and P2(x2, y2, z2) in 3-space, let us first consider their projections onto the xy-plane. As seen in FIGURE 7.5.6, the distance between (x1, y1, 0) and (x2, y2, 0) follows from the usual distance formula in the plane and is
Distance Formula To find the distance between two points P1(x1, y1, z1) and P2(x2, y2, z2) in 3-space, let us first consider their projections onto the xy-plane. As seen in FIGURE 7.5.6, the distance between (x1, y1, 0) and (x2, y2, 0) follows from the usual distance formula in the plane and is ![]() . Hence, from the Pythagorean theorem applied to the right triangle P1P3P2, we have
. Hence, from the Pythagorean theorem applied to the right triangle P1P3P2, we have
![]()

FIGURE 7.5.6 Distance between two points in 3-space
EXAMPLE 2 Distance Between Points in 3-Space
Find the distance between (2, −3, 6) and (−1, −7, 4).
Solution From (l), the distance is
![]()
![]() Midpoint Formula The distance formula can be used to show that the coordinates of the midpoint M of the line segment in 3-space connecting the distinct points P1(x1, y1, z1) and P2(x2, y2, z2) are
Midpoint Formula The distance formula can be used to show that the coordinates of the midpoint M of the line segment in 3-space connecting the distinct points P1(x1, y1, z1) and P2(x2, y2, z2) are
![]()
See Problem 90 in Exercises 7.5.
EXAMPLE 3 Midpoint in 3-Space
Find the coordinates of the midpoint M of the line segment between the two points in Example 2.
Solution From (2) we find that the coordinates of M are
![]()
![]() Sphere Like a circle, a sphere can be defined in terms of the distance formula.
Sphere Like a circle, a sphere can be defined in terms of the distance formula.
![]() Review Section 1.4.
Review Section 1.4.
DEFINITION 7.5.1 Sphere
A sphere is the set of all points P(x, y, z) in 3-space that are a given fixed distance r, called the radius, from a given fixed point C called the center.
If the center is P1(h, k, l), then a point P(x, y, z) is on the sphere if and only if P1and P satisfy [d(P1, P)]2 = r2, or
![]()
Equation (3) is called the standard form of the equation of a sphere.
EXAMPLE 4 Graph of a sphere
Graph x2 + y2 + z2 = 25.
Solution We identify h = 0, k = 0, l = 0, and r2 = 25 = 52 in (3), and so the graph of x2 + y2 + z2 = 25 is a sphere of radius 5 whose center is at the origin. The graph of the equation is given in FIGURE 7.5.7.

FIGURE 7.5.7 Sphere in Example 4
EXAMPLE 5 Graph of a Sphere
Graph (x − 5)2 + (y − 7)2 + (z − 6)2 = 9.
Solution In this case we identify h = 5, k = 7, l = 6, and r2 = 9. From (3) we see that the graph of (x − 5)2 + (y − 7)2 + (z − 6)2 = 32 is a sphere with center (5, 7, 6) and radius 3. Its graph lies entirely in the first octant and is shown in FIGURE 7.5.8.

FIGURE 7.5.8 Sphere in Example 5
EXAMPLE 6 Equation of a Sphere

FIGURE 7.5.9 Sphere tangent to plane y= 0 in Example 6
Find an equation of the sphere whose center is (4, −3, 0) that is tangent to the xz-plane.
Solution The perpendicular distance from the point (4, −3, 0) to the xz-plane (y = 0), and hence the radius of the sphere, is the absolute value of the y-coordinate, |−3| = 3. Thus, the standard form of the equation of the sphere is
![]()
See FIGURE 7.5.9.
To put an equation of a sphere in the standard form (3) it is necessary to complete the square in the three variables x, y, and z.
EXAMPLE 7 Center and Radius
Find the center and radius of the sphere whose equation is
2x2 + 2y2 + 2z2 − 2x + y − 4z + − = 0.
Solution We first divide by 2, group like terms together, and then complete the square in x, y, and z:

From the last equation we see that the center and radius of the sphere are ![]() and
and ![]() , respectively.
, respectively.
![]() Linear Equation in Three Variables In the introduction to Section 2.3 we defined a linear equation in two variables to be Ax + By + C = 0. For various choices of the coefficients A, B, and C, the graph of a linear equation is a line in 2-space. The graph of a linear equation in three variables
Linear Equation in Three Variables In the introduction to Section 2.3 we defined a linear equation in two variables to be Ax + By + C = 0. For various choices of the coefficients A, B, and C, the graph of a linear equation is a line in 2-space. The graph of a linear equation in three variables
![]()
A, B, C not all zero, is a plane in 3-space. We note that the simple equations x = x0, y = y0, and z = z0, where x0, y0, and z0 are constants, are special cases of (4). Here are two guidelines for graphing planes:
• The graphs of x = x0, y = y0, and z = z0 are planes perpendicular to the x-, y-, and z-axes, respectively. See FIGURE 7.5.3.
• To graph a linear equation (4), find the x-, y-, and z-intercepts, or if necessary, find the trace of a the plane in the coordinate planes.
A trace of a plane in a coordinate plane is the line of intersection of the plane with the coordinate plane. For example, by setting z = 0 we see that the trace of the plane 2x − 3y + 6z = 18 in the xy-plane is the line 2x + 3y = 18. To find the intercepts of a plane we use the fact that points on the x-, y-, and z-axes are of the form (x, 0, 0), (0, y, 0), and (0, 0, z), respectively.
EXAMPLE 8 Graph
Graph the equation 2x + 3 y + 6z = 18.
Solution Setting:
y = 0, z = 0 gives x = 9
x = 0, z = 0 gives y = 6
x = 0, y = 0 gives z = 3.
As shown in FIGURE 7.5.10, we use the x-, y-, and z-intercepts (9, 0, 0), (0, 6, 0), and (0, 0, 3) to draw the graph of the portion of the plane in the first octant.
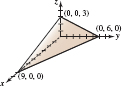
FIGURE 7.5.10 Plane in Example 8
EXAMPLE 9 Graph
Graph the equation x + y − z = 0.
Solution First observe that the plane passes through the origin (0, 0, 0). Now, the trace of the plane in the xz-plane (y = 0) is z = x, whereas its trace in the yz-plane (x = 0) is z = y. The traces are the two black lines in FIGURE 7.5.11.
![]() Missing Variables If two of the variables are missing in equation (4), then as we have already seen the plane is perpendicular to the coordinate axis corresponding to the variable present. For example, z = 1 is the equation of the plane perpendicular to the z-axis at the point (0, 0, 1). Alternatively, we can interpret z = 1 as the equation of the plane through the point (0, 0, 1) parallel to the coordinate plane corresponding to the missing two variables, in this case, parallel to the xy-plane. If one of the variables is missing in equation (4), the equation is then the same as the equation of the trace of the plane in the appropriate coordinate plane. The plane then is parallel to the coordinate axis corresponding to the missing variable. The following example illustrates this last idea.
Missing Variables If two of the variables are missing in equation (4), then as we have already seen the plane is perpendicular to the coordinate axis corresponding to the variable present. For example, z = 1 is the equation of the plane perpendicular to the z-axis at the point (0, 0, 1). Alternatively, we can interpret z = 1 as the equation of the plane through the point (0, 0, 1) parallel to the coordinate plane corresponding to the missing two variables, in this case, parallel to the xy-plane. If one of the variables is missing in equation (4), the equation is then the same as the equation of the trace of the plane in the appropriate coordinate plane. The plane then is parallel to the coordinate axis corresponding to the missing variable. The following example illustrates this last idea.
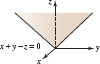
FIGURE 7.5.11 Plane in Example 9
EXAMPLE 10 Graph
Graph the equation y + 2z = 2.
Solution In 3-space the graph of the equation y + 2z = 2 is the graph of the set of ordered triples:
![]()
All we need do is draw the line y + 2z = 2 in the yz-plane. Because the x variable is missing in the given equation the plane is drawn parallel to the x-axis. Necessarily the plane is perpendicular to the yz-plane. See FIGURE 7.5.12.
FIGURE 7.5.12 Trace and plane in Example 10

FIGURE 7.5.13 Position vector in 3-space
![]() Vectors in 3-Space In Section 5.5 we saw that a position vector of a point P(x, y) in 2-space is a vector whose initial point is the origin O and whose terminal point is P. FIGURE 7.5.13 shows a position vector
Vectors in 3-Space In Section 5.5 we saw that a position vector of a point P(x, y) in 2-space is a vector whose initial point is the origin O and whose terminal point is P. FIGURE 7.5.13 shows a position vector
![]()
of a point P(x, y, z) in 3-space. Any vector in 3-space can be identified with a unique position vector ![]() , where the real numbers a1,a2, and a3 are called the components of the vector u. Written in component form the zero vector is one in which all components are 0, that is,
, where the real numbers a1,a2, and a3 are called the components of the vector u. Written in component form the zero vector is one in which all components are 0, that is, ![]()
The component definitions of addition, subtraction, scalar multiplication, and the dot product, and so on, are natural generalizations of those given in 2-space. For convenience we summarize some of these important vector concepts in 3-space.
Vector Operations and Concepts in 3-Space
Let u = ![]() a1, a2, a3
a1, a2, a3![]() and v =
and v = ![]() b1, b2, b3
b1, b2, b3![]() be two vectors in 3-space.
be two vectors in 3-space.
(i) The sum of u and v is
u + v = ![]() a1, a2, a3
a1, a2, a3![]() +
+ ![]() b1, b2, b3
b1, b2, b3![]() =
= ![]() a1 + b1, a2 + b2, a3 + b3
a1 + b1, a2 + b2, a3 + b3![]() .
.
(ii) The difference of u and v is
u − v = ![]() a1, a2, a3
a1, a2, a3![]() −
− ![]() b1, b2, b3
b1, b2, b3![]() =
= ![]() a1 − b1, a2 − b2, a3 − b3
a1 − b1, a2 − b2, a3 − b3![]() .
.
(iii) For a real number k, the scalar multiple of a vector u is
ku = ![]() ka1, ka2, ka3
ka1, ka2, ka3![]() .
.
(iv) The magnitude of a vector u is
![]()
(v) A unit vector u in the same direction as the vector v is
![]()
(vi) The dot product of u and v is
u · v = a1b1 + a2b2 + a3b3.
(vii) Nonzero vectors u and v are orthogonal if and only if u · v = 0.
![]() i, j, k Vectors In Section 5.5 we saw that the set of two unit vectors i =
i, j, k Vectors In Section 5.5 we saw that the set of two unit vectors i = ![]() 1, 0
1, 0![]() and j =
and j = ![]() 0, 1
0, 1![]() constitute a basis for the system of two-dimensional vectors. That is, any vector u in 2-space can be written as a linear combination of i and j: u = a1i + a2j. Likewise any vector u =
constitute a basis for the system of two-dimensional vectors. That is, any vector u in 2-space can be written as a linear combination of i and j: u = a1i + a2j. Likewise any vector u = ![]() a1, a2, a3
a1, a2, a3![]() in 3-space can be expressed as a linear combination of the unit vectors
in 3-space can be expressed as a linear combination of the unit vectors
i = ![]() 1, 0, 0
1, 0, 0![]() , j =
, j = ![]() 0, 1, 0
0, 1, 0![]() , k =
, k = ![]() 0, 0, 1
0, 0, 1![]() .
.
To see this we use (iii) of the above summary:
u = ![]() a1, a2, a3
a1, a2, a3![]() = a1
= a1![]() 1, 0, 0
1, 0, 0![]() + a2
+ a2![]() 0, 1, 0
0, 1, 0![]() + a3
+ a3![]() 0, 0, 1
0, 0, 1![]()
that is,
u = a1i + a2j + a3k.
The vectors i, j, and k illustrated in FIGURE 7.5.14(a) are called the standard basis for the system of three-dimensional vectors. In Figure 7.5.14(b) we see that a position vector u = a1i + a2j + a3k is the sum of three unit vectors a1i, a2j, and a3k, which lie along the x-, y-, and z-coordinate axes, respectively, and have the origin as a common initial point.
FIGURE 7.5.14 A position vector in terms of i, j, k
EXAMPLE 11 Using the i, j, k Vectors
Consider the vectors u = ![]() −3, −1, 4
−3, −1, 4![]() and v =
and v = ![]() 2, 14, 5
2, 14, 5![]() .
.
(a) Expressed in terms of the i, j, k basis vectors u and v are the same as u = −3i − j + 4k and v = 2i + 14j + 5k.
(b) The linear combination 5u − 2v is
5u − 2v = 5(−3i − j + 4k) − 2(2i + 14j + 5k)
= (−15i − 5j + 20k) − (4i + 28j + 10k)
= (−15 − 4)i + (−5 − 28)j + (20 − 10)k
= −19i − 33j + 10k.
(c)The dot product of u and v is the constant
u · v = (−3)(2) + (−1)(14) + (4)(5) = −20 + 20 = 0.
Because the dot product of the vector u and v in part (c) of Example 11 is 0 we can conclude that u and v are orthogonal.
NOTES FROM THE CLASSROOM
(i) We have included this brief section on 3-space because in a typical three-semester course in calculus, the third semester deals primarily with calculus and vectors in three dimensions.
(ii) As we know in 2-space, two distinct points determine a line. Analogously, in 3-space, three noncollinear points (x1, y1, z1), (x2, y2, z2), (x3, y3, z3) determine a plane. One way of finding an equation of the plane is by substituting the coordinates of the three points in (4) and solving the three simultaneous linear equations
![]()
for A, B, and C in terms of D. We can then choose D to be any nonzero real number. See Problems 59–64 in Exercises 7.5.
(iii) The natural follow-up to this introduction to 3-space is to consider multivariable functions. The graph of a function f of one independent variable y = f(x) is a curve in 2-space, whereas the graph of a function z = f(x, y) of two independent variables is a surface in 3-space. For example, if we solve for z in Example 8 the resulting equation ![]() is a linear function whose graph, as we have seen, is a plane. If we solve the equation in Example 4 for z, then one result is a function
is a linear function whose graph, as we have seen, is a plane. If we solve the equation in Example 4 for z, then one result is a function ![]() that describes the upper hemisphere of the sphere.
that describes the upper hemisphere of the sphere.
Graphing a function z = f(x, y) can be difficult and may, at times, require a computer. If you have access to a computer lab, check to see whether the computers have 3D graphing software. The graphs of the polynomial function z = 2x2 − 2y2 + 2 and the trigonometric function z = sin (x y) shown in FIGURE 7.5.15 and FIGURE 7.5.16 were obtained using the computer algebra system (CAS) Mathematica.

FIGURE 7.5.15 Graph of z = 2x2 − 2y2 + 2 for −2 ≤ x ≤ 2, −2 ≤ y ≤ 2
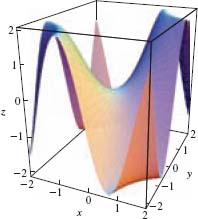
FIGURE 7.5.16 Graph of z = sin(xy) for −2 ≤ x ≤ 2, −2 ≤ y ≤ 2
7.5 Exercises Answers to selected odd-numbered problems begin on page ANS–22.
In Problems 1–6, graph the given point.
1. (1, 1, 5)
2. (0, 0, 4)
3. (3, 4, 0)
4. (6, 0, 0)
5. (6, −2, 0)
6. (5, −4, 3)
In Problems 7−10, describe geometrically all points P(x, y, z) whose coordinates satisfy the given conditions.
7. z = 5
8. x = 1
9. x = 2, y = 3
10. x = 4, y = −1, z = 7

FIGURE 7.5.17 Parallelepiped in Problem 12
11. Give the coordinates of the vertices of the rectangular parallelepiped whose sides are on the coordinate planes and the planes x = 2, y = 5, z = 8.
12. In FIGURE 7.5.17, two vertices are shown of a rectangular parallelepiped having sides parallel to the coordinate planes. Find the coordinates of the remaining six vertices.
13. Consider the point P(−2, 5, 4).
(a)If lines are drawn from P perpendicular to the coordinate planes, what are the coordinates of the point at the base of each perpendicular?
(b) If a line is drawn from P to the plane z = −2, what are the coordinates of the point at the base of the perpendicular?
(c) Find the point in the plane x = 3 that is closest to P.
14. Determine an equation of a plane parallel to a coordinate plane that contains the given pair of points.
(a) (3, 4, −5), (−2, 8, −5)
(b) (1, −1, 1), (1, −1, −1)
(c) (−2, 1, 2), (2, 4, 2)
In Problems 15−20, describe the set of points P(x, y, z) in 3-space whose coordinates satisfy the given equation.
15. xyz = 0
16. x2 + y2 + z2 = 0
17. (x + 1)2 + (y − 2)2 + (z + 3)2 = 0
18. (x − 2)(z − 8) = 0
19. z2 − 25 = 0
20. x = y = z
In Problems 21 and 22, find the distance between the given points.
21. (3, −1, 2), (6, 4, 8)
22. (−1, −3, 5), (0, 4, 3)
23. Find the distance from the point (7, −3, −4) to:
(a) the yz-plane (b) the x-axis.
24. Find the distance from the point (−6, 2, −3) to:
(a) the xz-plane (b) the origin.
In Problems 25−28, the given three points form a triangle. Determine which triangles are isosceles and which are right triangles.
25. (0, 0, 0), (3, 6, −6), (2, 1, 2)
26. (0, 0, 0), (1, 2, 4), ![]()
27. (1, 2, 3), (4, 1, 3), (4, 6, 4)
28. (1, 1, −1), (1, 1, 1), (0, −1, 1)
In Problems 29−32, use the distance formula to determine whether the given points are collinear.
29. P1(1, 2, 0), P2(−2, −2, −3), P3(7, 10, 6)
30. P1(1, 2, −1), P2(0, 3, 2), P3(1, 1, −3)
31. P1(1, 0, 4), P2(−4, −3, 5), P3(−7,−4, 8)
32. P1(2, 3, 2), P2(1, 4, 4), P3(5, 0, −4)
In Problems 33 and 34, solve for the unknown.
33. ![]()
34. P1(x, x, 1), P2(0, 3, 5); d(P1, P2) = 5
In Problems 35 and 36, find the coordinates of the midpoint of the line segment between the given points.
35. ![]()
36. (0, 5, −8), (4, 1, −6)
37. The coordinates of the midpoint of the line segment between P1(x1, y1, z1) and P2(2, 3, 6) are (−1, −4, 8). Find the coordinates of P1.
38. Let P3 be the midpoint of the line segment between P1(−3, 4, 1) and P2(−5, 8, 3). Find the coordinates of the midpoint of the line segment:
(a) between P1 and P3 (b) between P3 and P2.
In Problems 39−42, sketch the graph of the given equation.
39. x2 +y2 +z2 = 9
40. x2 + y2 + (z − 3)2 = 16
41. (x − 1)2 + (y − 1)2 + (z − 1)2 = 1
42. (x + 3)2 + (y + 4)2 + (z − 5)2 = 4
In Problems 43−46, complete the square in x, y, and z to find the center and radius of the given sphere.
43. x2 + y2 + z2 + 8x − 6y − 4z − 7 = 0
44. 4x2 + 4y2 + 4z2 + 4x − 12z + 9 = 0
45. x2 + y2 + z2 − 16z = 0
46. x2 + y2 + z2 − x + y = 0
In Problems 47-52, find an equation of a sphere that satisfies the given conditions.
47. Center (−1, 4, 6); radius ![]()
48. Center (0, −3, 0); diameter ![]()
49. Center (1,1,4); tangent to the xy-plane
50. Center (5, 2, −2); tangent to the yz-plane
51. Center on the positive y-axis; radius 2; tangent to x2 + y2 + z2 = 36
52. Center (−3, 1, 2); passing through the origin
In Problems 53–58, graph the plane whose equation is given.
53. 5x + 2y + z = 10
54. 3x + 2z = 9
55. 3x + z − 6 = 0
56. 3x + 4y − 2z − 12 = 0
57. − x + 2y + z = 4
58. 3x – y – 6 = 0
In Problems 59–64, use (4) and (5) to find an equation of a plane that contains the given points.
59. (3, 5, 2), (2, 3, 1), ( −1, −1, 4)
60. (0, 1, 0), (0, 1, 1), (1, 3, −1)
61. ( −1, −1, 2), (1, 1, 1), (3, 2, −1)
62. (0, 0, 3), (0, −1, 0), (6, 0, 0)
63. (1, 2, −1), (4, 3, 1), (7, 4, 1)
64. (2, 1, 2), (4, 1, 0), (5, 2, −5)
In Problems 65−76, u = ![]() 1,−3, 2
1,−3, 2![]() , v =
, v = ![]() −1,1,1
−1,1,1![]() , and w =
, and w = ![]() 2,6,9
2,6,9![]() . Find the indicated vector or scalar.
. Find the indicated vector or scalar.
65. u + (v + w)
66. 2u − (v − w)
67. v + 2(u − 3w)
68. 4(u + 2w) − 6v
69. ![]()
70. ![]()
71. ![]()
72. ![]()
73. ![]()
74. (v · w)u
75. (u + v) · w
76. (u − v) · (v + w)
77. Find a unit vector in the opposite direction of v = ![]() 10, −5,10
10, −5,10![]() .
.
78. Find a unit vector in the same direction as v = i − 3j + 2k.
79. Find a vector u that is four times as long as v = i − j + k in the same direction as v.
80. Find a vector v for which ![]() that is in the opposite direction of w =
that is in the opposite direction of w = ![]() −6, 3, −2
−6, 3, −2![]() .
.
![]() If you are unfamiliar on how to expand a 3 × 3 determinant, review Section 9.2.
If you are unfamiliar on how to expand a 3 × 3 determinant, review Section 9.2.
The cross product of two three-dimensional vectors u = ![]() a1, a2, a3
a1, a2, a3![]() and v =
and v = ![]() b1, b2, b3
b1, b2, b3![]() is a vector that can be written as the 3 × 3 determinant
is a vector that can be written as the 3 × 3 determinant
In Problems 81−84, use (6) to find the cross product of the given vectors.
81. u = ![]() 4, −2, 5
4, −2, 5![]() , v =
, v = ![]() 3, 1, −1
3, 1, −1![]()
82. u = ![]() 1, −3, 1
1, −3, 1![]() , v =
, v = ![]() 2, 0, 4
2, 0, 4![]()
83. u = 2i + j − k, v = −6i − 3j + 3k
84. u = 8i + j − 6k, v = i − 2j + 10k
In Problems 85 and 86, verify that the cross product (6) of the given vectors is orthogonal to each vector. It can be shown that u × v is perpendicular to the plane determined by the vectors u and v, and as a consequence u × v is orthogonal to u and orthogonal to v.
85. u = ![]() 2, 7, −4
2, 7, −4![]() , v =
, v = ![]() 1, 1, −1
1, 1, −1![]()
86. u = ![]() −1, −2, 4
−1, −2, 4![]() , v =
, v = ![]() 4, −1, 0
4, −1, 0![]()
For Discussion
In Problems 87 and 88, discuss how the procedure used in Problems 59−64 can be used to find an equation of a plane that contains the given points. Carry out your ideas.
87. (0, 0, 0), (1, 1, −1), (3, 2, 1)
88. (0, 0, 1), (0, 0, 5), (0, 2, 1)
89. If you have ever sat at a four-legged table that rocks, you might consider replacing it with a three-legged table. Why?
90. Use the distance formula to prove that (2) is the midpoint of the line segment between P1(x1, y1, z1) and P2(x2, y2, z2). [Hint: Show that d(P1, M) = d(M, P2) and d(P1, P2) = d(P1, M) + d(M, P2).]
In Problems 91−96, describe geometrically all points in 3-space whose coordinates satisfy the given condition(s).
91. x2 + y2 + (z − 1)2 = 4, + ≤ z ≤ 3
92. x2 + y2 + (z − 1)2 = 4, z = 2
93. x2 + y2 + z2 ≥ 1
94. 0 < (x − 1)2 + (y − 2)2 + (z − 3)2 < 1
95. 1 ≤ x2 + y2 + z2 ≤ 9
96. 1 ≤ x2 + y2 + z2 ≤ 9, z ≤ 0
In Problems 97 and 98, describe the surface in 3-space defined by the given set of points.
97. ![]()
98. ![]()
99. Determine whether the cross product (6) of two vectors is commutative. That is, does u × v = v × u?
100. If u = ![]() 1, 2, 3
1, 2, 3![]() , v =
, v = ![]() 4, 5, 6
4, 5, 6![]() , w =
, w = ![]() 7, 8, 3
7, 8, 3![]() , use (6) to find (u × v) × w.
, use (6) to find (u × v) × w.
A. Fill in the Blanks
In Problems 1−20, fill in the blanks.
1. An equation in the standard form y2 = 4cx of a parabola with focus (5, 0) is _____.
2. An equation in the standard form x2 = 4cy of a parabola through (2, 6) is _____.
3. A rectangular equation of a parabola with focus (1, −3) and directrix y = −7 is_____.
4. The directrix and vertex of a parabola are x = −3 and (−1, −2), respectively. The focus of the parabola is_____.
5. The focus and directrix of a parabola are ![]() and
and ![]() , respectively. The vertex of the parabola is_____.
, respectively. The vertex of the parabola is_____.
6. The vertex and focus of the parabola 8(x + 4)2 = y − 2 are_____.
7. After the graph of 8(x + 4)2 = y − 2 is moved rigidly 4 units to the right its equation is_____.
8. The center and vertices of the ellipse ![]() 1 are_____.
1 are_____.
9. The center and vertices of the hyperbola ![]() 1 are_____.
1 are_____.
10. The asymptotes of the hyperbola y2 − (x − 1)2 = 1 are_____.
11. The y-intercepts of the hyperbola y2 − (x − 1)2 = 1 are_____.
12. The eccentricity of the ellipse 9x2 + y2 = 1 is_____.
13. If the graph of an ellipse is very elongated, then its eccentricity e is close to_____. (Fill in with 0 or 1.)
14. The line segment with endpoints on a hyperbola and lying on the line through the foci is called the_____
15. The length of the minor axes of the ellipse 4x2 + 9y2 = 25 is_____.
16. The function ![]() defines a portion of the graph of a conic section. The conic section is a(n). Describe the portion of the graph defined by this function:_____
defines a portion of the graph of a conic section. The conic section is a(n). Describe the portion of the graph defined by this function:_____
17. An equation of the directrix for the parabola y2 = −2x is_____.
18. Because B2 − 4AC _____(Fill in with <0, = 0, or >0), the conic 3x2 − xy − y2 + 1 = 0is a _____.
19.A horizontal line through the focus intersects the graph of the parabola (x − 1)2 = 16y at the points_____.
20. The center of a hyperbola with asymptotes ![]()
B. True/False
In Problems 1−20, answer true or false.
1. The axis of the parabola x2 = −4y is vertical._____
2. The foci of an ellipse lie on its graph._____
3. After simplifying the squares of ![]() we obtain the hyperbola y2 − x2 = 5. Therefore the graphs of all three equations are the same._____
we obtain the hyperbola y2 − x2 = 5. Therefore the graphs of all three equations are the same._____
4. The minor axis of an ellipse bisects the major axis._____
5. The point (−2, 5) is on the ellipse x2/8 + y2/50 = 1._____
6. The graphs of y = x2and y2 − x2 = 1 have at most two points in common._____
7. The eccentricity of the hyperbola x2 − y2 = 1 is ![]() .
.
8. For an ellipse, the length of the major axis is always greater than the length of the minor axis._____
9. The vertex and focus are both on the axis of symmetry of a parabola._____
10. The asymptotes for (x − h)2/a2 − (y − k)2/b2 = 1 must pass through (h, k)._____.
11. An ellipse with eccentricity e = 0.01 is nearly circular._____
12. The transverse axis of the hyperbola x2/9 − y2/49 = 1 is vertical._____
13. The two hyperbolas x2 − y2/25 = 1 and y2/25 − x2 = 1 have the same pair of slant asymptotes._____
14. The major axis of the ellipse 4(x + 1)2 + 25(y − 3)2 = 100 lies on the line y = 3._____
15. If P is a point on a parabola, then the perpendicular distance between P and the directrix equals the distance between P and the vertex._____
16. If y = ±5x are the asymptotes of a hyperbola, its center is necessarily (0, 0)._____
17. The graph of x2/a2 − y2/b2 = 1 cannot cross its asymptotes y = ±bx/a._____
18. If y = 3x + 8 is an asymptote of a hyperbola, then the slope of the other asymptote is m = 23._____
19. The graph of x2 − 5y2 = 5 is symmetric about the x-axis, the y-axis, and the origin._____
20. The xy-term can be eliminated from the equation ![]() by a rotation of axes through the angle θ = 30°.
by a rotation of axes through the angle θ = 30°.
C. Review Exercises
In Problems 1−4, find the vertex, focus, directrix, and axis of the given parabola. Graph the parabola.
1. (y − 3)2 = −8x
2. 8(x + 4)2 = y − 2
3. x2 − 2x + 4y + 1 = 0
4. y2 + 10y + 8x + 41 = 0
In Problems 5−8, find an equation of the parabola that satisfies the given conditions.
5. Focus (1, −3), directrix y = −7
6. Focus (3, −1), vertex (0, −1)
7. Vertex (1, 2), vertical axis, passing through (4, 5)
8. Vertex (−1, −4), directrix x = 2
In Problems 9−12, find the center, vertices, and foci of the given ellipse. Graph the ellipse.
9.![]()
10. ![]()
11. 4x2 + y2 + 8x − 6y + 9 = 0
12. 5x2 + 9y2 − 20x + 54y + 56 = 0
In Problems 13−16, find an equation of the ellipse that satisfies the given conditions.
13. Endpoints of minor axis (0, ±4), foci (65, 0)
14. Foci ![]() , one vertex
, one vertex ![]()
15. Vertices (±2, −2), passing through ![]()
16. Center (2, 4), one focus (2, 1), one vertex (2, 0)
In Problems 17−20, find the center, vertices, foci, and asymptotes of the given hyperbola. Graph the hyperbola.
17. (x − 1)(x + 1) = y2
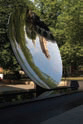
Parabolic mirror in Problem 31
18.![]()
19. 9x2 − y2 − 54x − 2y + 71 = 0
20. 16y2 − 9x2 − 64y − 80 = 0
In Problems 21−24, find an equation of the hyperbola that satisfies the given conditions.
21. Center (0, 0), one vertex (6, 0), and one focus (8, 0)
22. Foci (2, ±3), one vertex ![]()
23. Foci ![]() , asymptotes y = ±2x
, asymptotes y = ±2x
24. Vertices (−3,2) and (−3,4), one focus ![]()
In Problems 25 and 26, perform a suitable rotation of axes so that the resulting x′ y′-equation has no x′ y′-term. Sketch the graph.
25.xy = −8
26. 8x2 − 4xy + 5y2 = 36
27. Find an equation of the ellipse when the center of 4x2 + y2 = 4 is rigidly translated to the point (−5, 2).
28. Carefully describe the graphs of the given functions.
![]()
29. Distance from a Satellite A satellite orbits the planet Neptune in an elliptical orbit with the center of the planet at one focus. If the length of the major axis of the orbit is 2 × 10⁹ m and the length of the minor axis is 6 × 10⁸ m, find the maximum distance between the satellite and the center of the planet.
30. Find an equation of the ellipse (in red) inscribed in the auxiliary rectangle (dashed black) of the hyperbola shown in FIGURE 7.R.1.
31. Mirror, Mirror… A parabolic mirror has a depth of 7 cm at its center and the distance across the top of the mirror is 20 cm. Find the distance from the vertex to the focus.
32. Identify the conic section that appears in the drawing of a wooden pencil in FIGURE 7.R.2.
Find an equation of a sphere that has a diameter with endpoints (0, −4, 7) and (2, 12, −3).
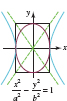
FIGURE 7.R.1 Graphs for Problem 30
FIGURE 7.R.2 Pencil in Problem 32
34. Find an equation of the plane such that the points (x, y, z) on the plane are equidistant from (1, −2, 3) and (2, 5, −1).
Find an equation of the parabola (blue) and of the ellipse (red) that have a common vertex (6, 0) and common focus (4, 0) as shown in FIGURE 7.R.3. Explain why this information does not determine a unique hyperbola (green). Find equations of two different hyperbolas that have a vertex (6, 0) and a focus (4, 0).

FIGURE 7.R.3 Graphs for Problem 35