

4 Trigonometric Functions
Chapter Outline
4.1 Angles and Their Measurement
4.2 The Sine and Cosine Functions
4.3 Graphs of Sine and Cosine Functions
4.4 Other Trigonometric Functions
4.5 Verifying Trigonometric Identities
4.6 Sum and Difference Formulas
4.7 Product-to-Sum and Sum-to-Product Formulas
4.8 Inverse Trigonometric Functions
4.11 ![]() The Limit Concept Revisited
The Limit Concept Revisited
Introduction We begin our study of trigonometry by discussing angles and two methods of measuring them: degrees and radians. As we will see it is the radian measure of an angle that enables us to define trigonometric functions on sets of real numbers.
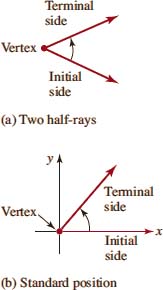
FIGURE 4.1.1 Initial and terminal sides of an angle
![]() Angles An angle is formed by two half-rays, or half-lines, which have a common endpoint, called the vertex. We designate one ray the initial side of the angle and the other the terminal side. It is useful to consider the angle as having been formed by a rotation from the initial side to the terminal side as shown in FIGURE 4.1.1(a). An angle is said to be in standard position if its vertex is placed at the origin of a rectangular coordinate system with its initial side coinciding with the positive x-axis, as shown in Figure 4.1.1(b).
Angles An angle is formed by two half-rays, or half-lines, which have a common endpoint, called the vertex. We designate one ray the initial side of the angle and the other the terminal side. It is useful to consider the angle as having been formed by a rotation from the initial side to the terminal side as shown in FIGURE 4.1.1(a). An angle is said to be in standard position if its vertex is placed at the origin of a rectangular coordinate system with its initial side coinciding with the positive x-axis, as shown in Figure 4.1.1(b).
![]() Degree Measure The degree measure of an angle is based on the assignment of 360 degrees (written 360°) to the angle formed by one complete counterclockwise rotation, as shown in FIGURE 4.1.2. Other angles are then measured in terms of a 360° angle, with a 1° angle being formed by
Degree Measure The degree measure of an angle is based on the assignment of 360 degrees (written 360°) to the angle formed by one complete counterclockwise rotation, as shown in FIGURE 4.1.2. Other angles are then measured in terms of a 360° angle, with a 1° angle being formed by ![]() of a complete rotation. If the rotation is counterclockwise, the measure will be positive; if clockwise, the measure is negative. For example, the angle in FIGURE 4.1.3(b) obtained by one-fourth of a complete counterclockwise rotation will be
of a complete rotation. If the rotation is counterclockwise, the measure will be positive; if clockwise, the measure is negative. For example, the angle in FIGURE 4.1.3(b) obtained by one-fourth of a complete counterclockwise rotation will be
![]()
Shown in Figure 4.1.3(b) is the angle formed by three-fourths of a complete clockwise rotation. This angle has measure
![]()
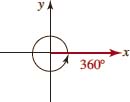
FIGURE 4.1.2 Angle of 360 degrees

FIGURE 4.1.3 Positive measure in (a); negative measure in (b)
![]() Coterminal Angles Comparison of Figure 4.1.3(a) with Figure 4.1.3(b) shows that the terminal side of a 90°angle coincides with the terminal side of a -270°angle. When two angles in standard position have the same terminal sides we say they are coterminal. For example, the angles θ, θ + 360°, and θ − 360° shown in FIGURE 4.1.4 are coterminal. In fact, the addition of any integer multiple of 360° to a given angle results in a coterminal angle. Conversely, any two coterminal angles have degree measures that differ by an integer multiple of 360°
Coterminal Angles Comparison of Figure 4.1.3(a) with Figure 4.1.3(b) shows that the terminal side of a 90°angle coincides with the terminal side of a -270°angle. When two angles in standard position have the same terminal sides we say they are coterminal. For example, the angles θ, θ + 360°, and θ − 360° shown in FIGURE 4.1.4 are coterminal. In fact, the addition of any integer multiple of 360° to a given angle results in a coterminal angle. Conversely, any two coterminal angles have degree measures that differ by an integer multiple of 360°
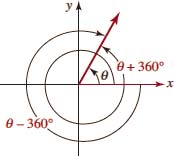
FIGURE 4.1.4 Three coterminal angles
EXAMPLE 1 Angles and Coterminal Angles
For a 960° angle:
(a) Locate the terminal side and sketch the angle.
(b) Find a coterminal angle between 0° and 360°
(c) Find a coterminal angle between −360° and 0°.
Solution (a) We first determine how many full rotations are made in forming this angle. Dividing 960 by 360 we obtain a quotient of 2 and a remainder of 240. Equivalently we can write
960=2(360)+240.
Thus, this angle is formed by making two counterclockwise rotations before completing ![]() of another rotation. As illustrated in FIGURE 4.1.5(a), the terminal side of 960° lies in the third quadrant.
of another rotation. As illustrated in FIGURE 4.1.5(a), the terminal side of 960° lies in the third quadrant.
(b) Figure 4.1.5(b) shows that the angle 240° is coterminal with a 960° angle.
(c) Figure 4.1.5(c) shows that the angle -120° is coterminal with a angle. 960°
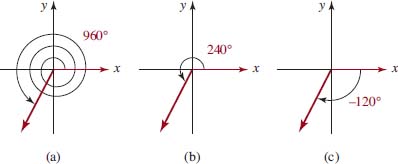
FIGURE 4.1.5 Angles in (b) and (c) are coterminal with the angle in (a)
![]() Minutes and Seconds With calculators it is convenient to represent fractions of degrees by decimals, such as 42.23°. Traditionally, however, fractions of degrees were expressed in minutes and seconds, where
Minutes and Seconds With calculators it is convenient to represent fractions of degrees by decimals, such as 42.23°. Traditionally, however, fractions of degrees were expressed in minutes and seconds, where
![]()
and
![]()
For example, an angle of 7 degrees, 30 minutes, and 5 seconds is expressed as 7°30′5″.Some calculators have a special DMS key for converting an angle given in decimal degrees to Degrees, Minutes, and Seconds (DMS notation), and vice versa. The following example shows how to perform these conversions by hand.
EXAMPLE 2 Using (1) and (2)
Convert:
(a) 86.23° to degrees, minutes, and seconds,
(b) 17°47′13″ to decimal notation.
Solution In each case we will use (1) and (2).
(a) Since 0.23° represents ![]() of 1° and 1°60′=60″, we have
of 1° and 1°60′=60″, we have
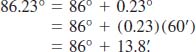
Now 13.8′ = 13′ + 0.8′, so we must convert 0.8′ to seconds. Since 0.8′ represents ![]() of 1′ and 1′, we have
of 1′ and 1′, we have
![]()
Hence, 86.23° = 86°13′48″.
(b) Since 1° =60′, it follows that ![]() Similarly,
Similarly, ![]() Thus we have
Thus we have
Thus we see that ![]()
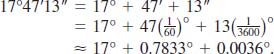
![]() Radian Measure Another measure for angles is radian measure, which is generally used in almost all applications of trigonometry that involve calculus. The radian measure of an angle θ is based on the length of an arc on a circle. If we place the vertex of the angle θ at the center of a circle of radius r, then θ ais called a central angle. As we know, an angle θ in standard position can be viewed as having been formed by the initial side rotating from the positive x-axis to the terminal side. The region formed by the initial and terminal sides with a central angle θ is called a sector of a circle. As shown in FIGURE 4.1.6(a), if the initial side of θ traverses a distance s along the circumference of the circle, then the radian measure of θ is defined by
Radian Measure Another measure for angles is radian measure, which is generally used in almost all applications of trigonometry that involve calculus. The radian measure of an angle θ is based on the length of an arc on a circle. If we place the vertex of the angle θ at the center of a circle of radius r, then θ ais called a central angle. As we know, an angle θ in standard position can be viewed as having been formed by the initial side rotating from the positive x-axis to the terminal side. The region formed by the initial and terminal sides with a central angle θ is called a sector of a circle. As shown in FIGURE 4.1.6(a), if the initial side of θ traverses a distance s along the circumference of the circle, then the radian measure of θ is defined by
![]()
A slice of pizza is an example of a circular sector

In the case when the terminal side of θ traverses an arc of length s along the circumference of the circle equal to the radius r of the circle, then we see from (3) that the measure of the angle θ is 1 radian. See Figure 4.1.6(b).

FIGURE 4.1.6 Central angle in (a); angle of 1 radian in (b)
The definition given in (3) does not depend on the size of the circle. To see this, all we need do is to draw another circle centered at the vertex of θ of radius r′ and subtended arc length s′ See FIGURE 4.1.7. Because the two circular sectors are similar the ratios s⁄r and s′⁄r′ are equal. Therefore, regardless of which circle we use, we obtain the same radian measure for θ
In equation (3) any convenient unit of length may be used for s and r, but the same unit must be used for both s and r. Thus,
![]()
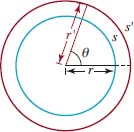
FIGURE 4.1.7 Concentric circles
appears to be a “dimensionless” quantity. For example, if s=4 in. and r=2 in., then the radian measure of the angle is
![]()
where 2 is simply a real number. This is the reason why sometimes the word radians is omitted when an angle is measured in radians. We will come back to this idea in Section 4.2.
One complete rotation of the initial side of will traverse an arc equal in length to the circumference of the circle 2πr It follows from (3) that
![]()
We have the same convention as before: An angle formed by a counterclockwise rotation is considered positive, whereas an angle formed by a clockwise rotation is negative. In FIGURE 4.1.8 we illustrate angles in standard position of ![]() and 3π radians, respectively. Note that the angle of π⁄2 radians shown in 4.1.8(a) is obtained by one-fourth of a complete counterclockwise rotation; that is
and 3π radians, respectively. Note that the angle of π⁄2 radians shown in 4.1.8(a) is obtained by one-fourth of a complete counterclockwise rotation; that is
![]()
The angle shown in Figure 4.1.8(b), obtained by one-fourth of a complete clockwise rotation, −π⁄2 is radians. The angle shown in Figure 4.1.8(c) is coterminal with the angle shown in Figure 4.1.8(d). In general, the addition of any integer multiple of 2π radians to an angle measured in radians results in a coterminal angle. Conversely, any two coterminal angles measured in radians will differ by an integer multiple of 2π.
FIGURE 4.1.8 Angles measured in radians
EXAMPLE 3 A Coterminal Angle
Find an angle between 0 and 2π radians that is coterminal with θ = 11π⁄4 radians. Sketch the angle.

FIGURE 4.1.9 Coterminal angles in Example 3
Solution Since ![]() we subtract the equivalent of one rotation, or 2π radians, to obtain
we subtract the equivalent of one rotation, or 2π radians, to obtain
![]()
Alternatively, we can proceed as in part (a) of Example 1 and divide: 11π⁄4 = 2π + 3π⁄4. Thus, an angle of 3π⁄4 radians is coterminal with θ, as illustrated in FIGURE 4.1.9.
![]() Conversion Formulas Although many scientific calculators have keys that convert between degree and radian measure, there is an easy way to remember the relationship between the two measures. Since the circumference of a unit circle is 2π, one complete rotation has measure 2π radians as well as 360° It follows that 360° =2π radians or
Conversion Formulas Although many scientific calculators have keys that convert between degree and radian measure, there is an easy way to remember the relationship between the two measures. Since the circumference of a unit circle is 2π, one complete rotation has measure 2π radians as well as 360° It follows that 360° =2π radians or
![]()
If we interpret (4) as 180(1°)= π(1 radian), then we obtain the following two formulas for converting between degree and radian measure.
Conversion between Degrees and Radians
![]()
![]()
Using a calculator to carry out the divisions in (5) and (6), we find that
![]()
EXAMPLE 4 Conversion Between Degrees and Radians
Convert:
(a)20° to radians
(b)7π⁄6 radians to degrees
(c) 2 radians to degrees.
Solution (a) To convert from degrees to radians we use (5):
![]()
(b) To convert from radians to degrees we use (6):
![]()
(c) We again use (6):
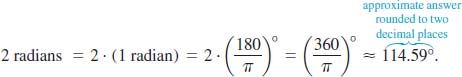
Table 4.1.1 provides the radian and degree measure of the most commonly used angles.
TABLE 4.1.1
![]()
![]() Terminology You may recall from geometry that a 90° angle is called a right angle and a 180° angle is called a straight angle. In radian measure, π⁄2 is a right angle and π is a straight angle. An acute angle has measure between 0° and 90° (or between 0 and π⁄2 radians); and an obtuse angle has measure between 90° and 180° (or between π⁄2 and π radians). Two acute angles are said to be complementary if their sum is 90° (or π/2 radians). Two positive angles are supplementary if their sum is 180° (or π radians). The angle 180°(or π radians) is a straight angle. An angle whose terminal side coincides with a coordinate axis is called a quadrantal angle. For example, 90° (or π⁄2 radians) is a quadrantal angle. A triangle that contains a right angle is called a right triangle. The lengths a, b, and c of the sides of a right triangle satisfy the Pythagorean theorem,
Terminology You may recall from geometry that a 90° angle is called a right angle and a 180° angle is called a straight angle. In radian measure, π⁄2 is a right angle and π is a straight angle. An acute angle has measure between 0° and 90° (or between 0 and π⁄2 radians); and an obtuse angle has measure between 90° and 180° (or between π⁄2 and π radians). Two acute angles are said to be complementary if their sum is 90° (or π/2 radians). Two positive angles are supplementary if their sum is 180° (or π radians). The angle 180°(or π radians) is a straight angle. An angle whose terminal side coincides with a coordinate axis is called a quadrantal angle. For example, 90° (or π⁄2 radians) is a quadrantal angle. A triangle that contains a right angle is called a right triangle. The lengths a, b, and c of the sides of a right triangle satisfy the Pythagorean theorem, ![]() where c is the length of the side opposite the right angle (the hypotenuse).
where c is the length of the side opposite the right angle (the hypotenuse).
EXAMPLE 5 Complementary and Supplementary Angles
(a) Find the angle that is complementary to θ= 74.23°.
(b) Find the angle that is supplementary to ø =π⁄3 radians.
Solution (a) Since two angles are complementary if their sum is 90°, we find the angle that is complementary to θ = 74.23° is
90°−θ = 90°−74.23° = 15.77°.
(b) Since two angles are supplementary if their sum is π radians, we find the angle that is supplementary to φ = π⁄3 radians is
![]()
![]() Arc Length In many applications it is necessary to find the length s of the arc sub-tended by a central angle θ in a circle of radius r. See FIGURE 4.1.10. From the definition of radian measure given in (3),
Arc Length In many applications it is necessary to find the length s of the arc sub-tended by a central angle θ in a circle of radius r. See FIGURE 4.1.10. From the definition of radian measure given in (3),
![]()
By multiplying both sides of the last equation by r we obtain the arc length formula s = rθ.We summarize the result.
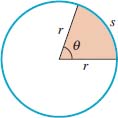
FIGURE 4.1.10 Length of arc s determined by a central angle θ
THEOREM 4.1.1 Arc Length Formula
For a circle of radius r, a central angle of θ radians subtends an arc of length
![]()
EXAMPLE 6 Finding Arc Length
Find the arc length subtended by a central angle of (a) 2 radians in a circle of radius 6 inches, (b) in a circle of radius 12 feet.
Solution (a) From the arc length formula (7) with θ = 2 radians and r = 6 inches, we have s = rθ = 2.6 = 12. So the arc length is 12 inches.
(b) We must first express 30° in radians. Recall 30° = π⁄6 that radians. Then from the arc length formula (7) we have s = rθ = (12)(π⁄6) = 2π. So the arc length is ![]() feet.
feet.
![]() Students often apply the arc length formula incorrectly by using degree measure. Remember s = rθ is valid only if θ is measured in radians.
Students often apply the arc length formula incorrectly by using degree measure. Remember s = rθ is valid only if θ is measured in radians.
4.1 Exercises Answers to selected odd-numbered problems begin on page ANS-12.
In Problems 1–16, draw the given angle in standard position. Bear in mind that the lack of a degree symbol (°) in an angular measurement indicates that the angle is measured in radians.
1. 60°
2. −120°
3. 135°
4. 150°
5. 1140°
6. −315°
7. −240°
8. −210°
9. ![]()
10. ![]()
11. ![]()
12. ![]()
13. ![]()
14. −3π
15. 3
16. 4
In Problems 17–20, express the given angle in decimal notation.
17. 10°39′17″
18. 143°7′2″
19. 5°10′
20. 10°25′
In Problems 21–24, express the given angle in terms of degrees, minutes, and seconds.
21. 210.78°
22. 15.45°
23. 30.81θ
24. 110.5°
In Problems 25–32, convert from degrees to radians.
25. 10°
26. 15°
27. 45°
28. 215°
29. 270°
30. −120°
31. −230°
32. 540°
In Problems 33–40, convert from radians to degrees.
33. ![]()
34. ![]()
35. ![]()
36. ![]()
37. ![]()
38. 7π
39. 3.1
40. 12
In Problems 41–44, find the angle between and that is coterminal with the given angle.
41. 875°
42. 400°
43. −610°
44. −150°
45. Find the angle between −360° and 0° that is coterminal with the angle in Problem 41.
46. Find the angle between−360° and 0° and that is coterminal with the angle in Problem 43.
In Problems 47–52, find the angle between 0 and 2π that is coterminal with the given angle.
47. ![]()
48. ![]()
49. 5.3π
50. ![]()
51. − 4
52. 7.5
53. Find the angle between −2π and 0 radians that is coterminal with the angle in Problem 47.
54. Find the angle between −2π and 0 radians that is coterminal with the angle in Problem 49.
In Problems 55–62, find an angle that is (a) complementary and (b) supplementary to the given angle, or state why no such angle can be found.
55. 48.25°
56. 93°
57. 98.4°
58. 63.08°
59. ![]()
60. ![]()
61. ![]()
62. ![]()
63. Find both the degree and the radian measures of the angle formed by (a) three-fifths of a counterclockwise rotation and (b) five and one-eighth clockwise rotations.
64. Find both the degree and the radian measures of the obtuse angle formed by the hands of a clock (a) at 8:00, (b) at 1:00, and (c) at 7:30.
65. Find both the degree and the radian measures of the angle through which the hour hand on a clock rotates in 2 hours.
66. Answer the question in Problem 65 for the minute hand.
67. The Earth rotates on its axis once every 24 hours. How long does it take the Earth to rotate through an angle of (a)240° and (b)π/6 radians?
68. The planet Mercury completes one rotation on its axis every 59 days. Through what angle (measured in degrees) does it rotate in (a) 1 day, (b) 1 hour, and (c) 1 minute?
69. Find the arc length subtended by a central angle of 3 radians in a circle of (a) radius 3 and (b) radius 5.
70. Find the arc length subtended by a central angle of 30° in a circle of (a) radius 2 and (b) radius 4.
71. Find the measure of a central angle θ in a circle of radius 5 if θ subtends an arc of length 7.5. Give θ in (a) radians and (b) degrees.
72. Find the measure of a central angle θ in a circle of radius 1 if θ subtends an arc of length π⁄6. Give θ in (a) radians and (b) degrees.
73. Show that the area A of a sector formed by a central angle of θ radians in a circle of radius r is given by ![]() See Figure 4.1.10. [Hint: Use the proportionality property from geometry that the ratio of the area A of a circular sector to the total area
See Figure 4.1.10. [Hint: Use the proportionality property from geometry that the ratio of the area A of a circular sector to the total area ![]() of the circle equals the ratio of the central angle θ to one complete revolution 2π.]
of the circle equals the ratio of the central angle θ to one complete revolution 2π.]
74. What is the area of the red shaded circular band shown in FIGURE 4.1.11 if θ is measured (a) in radians and (b) in degrees? [Hint: Use the result of Problem 73.]

Planet Mercury in Problem 68

FIGURE 4.1.11 Circular band in Problem 74

FIGURE 4.1.12 Satellite in Problem 75
Miscellaneous Applications
75. Angular and Linear Speed If we divide (7) by time t we get the relationship ![]() where v = s⁄t is called the linear speed of a point on the circumference of a circle and
where v = s⁄t is called the linear speed of a point on the circumference of a circle and ![]() is called the angular speed of the point. A communications satellite is placed in a circular geosynchronous orbit 35,786 km above the surface of the Earth. The time it takes the satellite to make one full revolution around the Earth is 23 hours, 56 minutes, 4 seconds and the radius of the Earth is 6378 km. See FIGURE 4.1.12.
is called the angular speed of the point. A communications satellite is placed in a circular geosynchronous orbit 35,786 km above the surface of the Earth. The time it takes the satellite to make one full revolution around the Earth is 23 hours, 56 minutes, 4 seconds and the radius of the Earth is 6378 km. See FIGURE 4.1.12.
(a) What is the angular speed of the satellite in rad⁄s?
(b) What is the linear speed of the satellite in km⁄s?
76. Pendulum Clock A clock pendulum is 1.3 m long and swings back and forth along a 15-cm arc. Find (a) the central angle and (b) the area of the sector through which the pendulum sweeps in one swing. [Hint: To answer part (b), use the result of Problem 73.]
77. Sailing at Sea A nautical mile is defined as the arc length subtended on the surface of the Earth by an angle of measure 1 minute. If the diameter of the Earth is 7927 miles, find how many statute (land) miles there are in a nautical mile.
78. Circumference of the Earth Around 230 B.C.E. Eratosthenes calculated the circumference of the Earth from the following observations. At noon on the longest day of the year, the Sun was directly overhead in Syene, while it was inclined 7.2° from the vertical in Alexandria. He believed the two cities to be on the same longitudinal line and assumed that the rays of the Sun are parallel. Thus he concluded that the arc from Syene to Alexandria was subtended by a central angle of 7.2° at the center of the Earth. See FIGURE 4.1.13. At that time the distance from Syene to Alexandria was measured as 5000 stades. If one stade = 559 feet, find the circumference of the Earth in (a) stades and (b) miles. Show that Eratosthenes’ data gives a result that is within 7% of the correct value if the polar diameter of the Earth is 7900 miles (to the nearest mile).
79. Circular Motion of a Yo-Yo A yo-yo is whirled around in a circle at the end of its 100-cm string.
(a) If it makes six revolutions in 4 seconds, find its rate of turning, or angular speed, in radians per second.
(b) Find the speed at which the yo-yo travels in centimeters per second; that is its linear speed.
80. More Yo-Yos If there is a knot in the yo-yo string described in Problem 79 at a point 40 cm from the yo-yo, find (a) the angular speed of the knot and (b) the linear speed.
81. Circular Motion of a Tire An automobile with 26-in. diameter tires is traveling at a rate of 55 mi/h
(a) Find the number of revolutions per minute that its tires are making.
(b) Find the angular speed of its tires in radians per minute.
82. Diameter of the Moon The average distance from the Earth to the Moon as given by NASA is 238,855 miles. If the angle subtended by the Moon at the eye of an observer on Earth is 0.52° then what is the approximate diameter of the Moon? FIGURE 4.1.14 is not to scale.
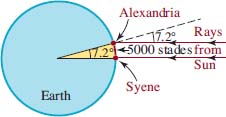
FIGURE 4.1.13 Earth in Problem 78 Yo-yo in Problems 79 and 80

Yo-yo in Problems 79 and 80
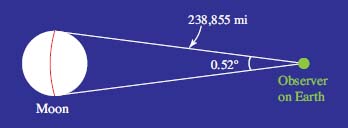
FIGURE 4.1.14 The curved red arc represents the approximate diameter of the Moon
Introduction Originally, the trigonometric functions were defined using angles in right triangles. A more modern approach, and one that is used in calculus, is to define the trigonometric functions on sets of real numbers. As we will see, the radian measure for angles is key in making these definitions.
![]() Trigonometric Functions For each real number t there corresponds an angle of t radians in standard position. As shown in FIGURE 4.2.1 we denote the point of intersection of the terminal side of the angle t with the unit circle by P(t). The x and y coordinates of this point give us the values of the six basic trigonometric functions. The y-coordinate of P(t) is called the sine of t, while the x-coordinate of P(t) is called the cosine of t.
Trigonometric Functions For each real number t there corresponds an angle of t radians in standard position. As shown in FIGURE 4.2.1 we denote the point of intersection of the terminal side of the angle t with the unit circle by P(t). The x and y coordinates of this point give us the values of the six basic trigonometric functions. The y-coordinate of P(t) is called the sine of t, while the x-coordinate of P(t) is called the cosine of t.
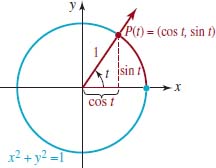
FIGURE 4.2.1 Coordinates of P(t) are (cost, sint)
DEFINITION 4.2.1 Sine and Cosine Functions
Let t be any real number and t be the point P(t) 5 (x, y) of intersection of the unit circle with the terminal side of the angle of t radians in standard position. Then, the sine of t, denoted sin t, and the cosine of t, denoted cos t, are
![]()
and
![]()
Since to each real number P (t) = (cost, sint), there corresponds a unique point we have just defined two functions – the sine function and the cosine function – each with domain the set R of real numbers. Four additional trigonometric functions are defined in terms of the coordinates of P(t) 5 (x, y).
DEFINITION 4.2.2 Tangent, Cotangent, Secant, and Cosecant Functions
The tangent, cotangent, secant, and cosecant functions of the real number t are

Using sin t = y and cos t = x in (3)–(6) of Definition 4.2.2 we obtain the important identities:
Because of the role played by the unit circle in Definitions 4.2.1 and 4.2.2, the six trigonometric functions are referred to as the circular functions.
For the remainder of this section and the next we are going to examine the sine and cosine functions in detail. We will come back to the tangent, cotangent, secant, and cosecant functions in Section 4.4.
A number of properties of the sine and cosine functions follow from the fact P(t) = (cos t, sin t) that lies on the unit circle. For instance, the coordinates of P(t) must satisfy the equation of the circle:
![]()
Substituting and gives an important relationship between the sine and the cosine called the Pythagorean identity:
(cos t)2 + (sin t)2 = 1.
From now on we will follow two standard practices in writing this identity: (cos t)2 and sin2 t will be written as cos t2 and sin2 t respectively, and the sin 2t term will be written first.
THEOREM 4.2.1 Pythagorean Identity
For all real numbers t,
![]()
Again, if P(x, y)denotes a point on the unit circle (9), it follows that the coordinates of P must satisfy the inequalities ![]() and
and ![]() . Because x = cost and y = sint we have the following bounds on the values of the sine and cosine functions.
. Because x = cost and y = sint we have the following bounds on the values of the sine and cosine functions.
THEOREM 4.2.2 Bounds on the Values of Sine and Cosine
For all real numbers t,
![]()
The foregoing inequalities can also be expressed as ![]() Thus, for example, there is no real number t such that sin
Thus, for example, there is no real number t such that sin ![]()
![]() Domain and Range From the preceding observations we have the sine and cosine functions f(t) = sint and gt = sint each with domain the set R of real numbers and range the interval[−1, 1].
Domain and Range From the preceding observations we have the sine and cosine functions f(t) = sint and gt = sint each with domain the set R of real numbers and range the interval[−1, 1].
![]() Signs of the Circular Functions The signs of the function values sin t and cos t are determined by the quadrant in which the point lies, and conversely. For example, if sint and cost are both negative, then the point and terminal side of the corresponding angle of t radians must lie in quadrant III. FIGURE 4.2.2 displays the signs of the cosine and sine functions in each of the four quadrants.
Signs of the Circular Functions The signs of the function values sin t and cos t are determined by the quadrant in which the point lies, and conversely. For example, if sint and cost are both negative, then the point and terminal side of the corresponding angle of t radians must lie in quadrant III. FIGURE 4.2.2 displays the signs of the cosine and sine functions in each of the four quadrants.
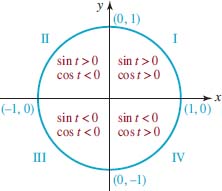
FIGURE 4.2.2 Algebraic signs of and in the four quadrants cos t
EXAMPLE 1 Using the Pythagorean Identity
Given that cos ![]() and that P(t) is a point in the fourth quadrant, find sin t.
and that P(t) is a point in the fourth quadrant, find sin t.
Solution Substitution of cos ![]() into the Pythagorean identity (10) gives
into the Pythagorean identity (10) gives ![]() Since sin t is the y-coordinate of P(t), a point in the fourth quadrant, we must take the negative square root for sin t:
Since sin t is the y-coordinate of P(t), a point in the fourth quadrant, we must take the negative square root for sin t:
![]()
EXAMPLE 2 Sine and Cosine of a Real Number
Use a calculator to approximate sin3 and cos3 and give a geometric interpretation of these values.
Solution From a calculator set in radian mode, we obtain ![]() and
and ![]() These values represent the x- and y-coordinates, respectively, of the point of intersection of the terminal side of the angle of 3 radians in standard position with the unit circle. As shown in FIGURE 4.2.3, this point lies in the second quadrant because π⁄2 <3<π. This would also be expected in view of Figure 4.2.2 since cos3, the x-coordinate, is negative and sin3, the y-coordinate, is positive.
These values represent the x- and y-coordinates, respectively, of the point of intersection of the terminal side of the angle of 3 radians in standard position with the unit circle. As shown in FIGURE 4.2.3, this point lies in the second quadrant because π⁄2 <3<π. This would also be expected in view of Figure 4.2.2 since cos3, the x-coordinate, is negative and sin3, the y-coordinate, is positive.
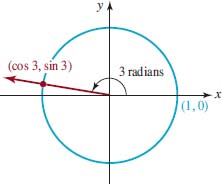
FIGURE 4.2.3 The point P(3)
![]() Values Corresponding to Unit Circle Intercepts As shown in Figure 4.2.4, the x- and y-intercepts of the unit circle give us the values of the sine and cosine functions for the real numbers corresponding to quadrantal angles listed next.
Values Corresponding to Unit Circle Intercepts As shown in Figure 4.2.4, the x- and y-intercepts of the unit circle give us the values of the sine and cosine functions for the real numbers corresponding to quadrantal angles listed next.
Values of the Sine and Cosine
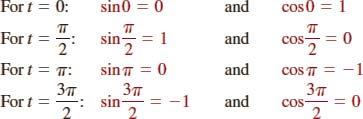

FIGURE 4.2.4 Sine and cosine values for quadrantal angles
![]() Periodicity In Section 4.1. we saw that for any real number t, the angles of radians and t ± 2π radians are coterminal. Thus they determine the same point on the unit circle. Therefore
Periodicity In Section 4.1. we saw that for any real number t, the angles of radians and t ± 2π radians are coterminal. Thus they determine the same point on the unit circle. Therefore
![]()
In other words, the sine and cosine functions repeat their values every 2π units. It also follows that for any integer n:
![]()
DEFINITION 4.2.3 Periodic Functions
A nonconstant function f is said to be periodic if there is a positive number p such that
![]()
for every t in the domain of f. If p is the smallest positive number for which (13) is true, then p is called the period of the function f.
The equations in (11) imply that the sine and the cosine functions are periodic with period p≤ 2π. To see that the period of is actually 2π, we observe that there is only one point on the unit circle with y-coordinate 1, namely, P(π⁄2) = (cos(π⁄2), sin(π⁄2)) = (0,1). Therefore,
![]()
and so on. Thus the smallest possible positive value of p is 2π.
THEOREM 4.2.3 Period of the Sine and Cosine
The sine and cosine functions are periodic with period 2π. Therefore,
![]()
for every real number t.
![]() Even–Odd Properties The symmetry of the unit circle endows the circular functions with several additional properties. For any real number t, the points P(t) and P(−t) on the unit circle are located on the terminal side of an angle of t and radians, respectively. These two points will always be symmetric with respect to the x-axis. FIGURE 4.2.5 illustrates the situation for a point P(t) lying in the first quadrant: The x-coordinates of the two points are identical; however, the y-coordinates have equal magnitudes but opposite signs. The same symmetries will hold regardless of which quadrant contains P(t). Thus, for any real number t, cos(−t) = cos t and sin(−t) = sin (−t) Applying the definitions of even and odd functions from Section 2.2. we have the following result.
Even–Odd Properties The symmetry of the unit circle endows the circular functions with several additional properties. For any real number t, the points P(t) and P(−t) on the unit circle are located on the terminal side of an angle of t and radians, respectively. These two points will always be symmetric with respect to the x-axis. FIGURE 4.2.5 illustrates the situation for a point P(t) lying in the first quadrant: The x-coordinates of the two points are identical; however, the y-coordinates have equal magnitudes but opposite signs. The same symmetries will hold regardless of which quadrant contains P(t). Thus, for any real number t, cos(−t) = cos t and sin(−t) = sin (−t) Applying the definitions of even and odd functions from Section 2.2. we have the following result.
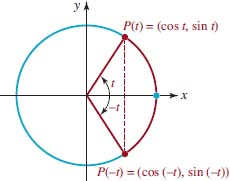
FIGURE 4.2.5 Coordinates of P(t) and P(–t)
THEOREM 4.2.4 Even and Odd Functions
The cosine function is even and the sine function is odd. That is, for every real number t,
![]()
The following additional properties of the sine and cosine functions can be verified by considering the symmetries of appropriately chosen points on the unit circle.
THEOREM 4.2.5 Additional Properties
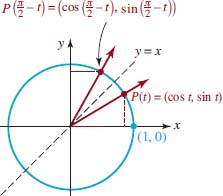
FIGURE 4.2.6 Geometric justification of (16) in Theorem 4.2.5
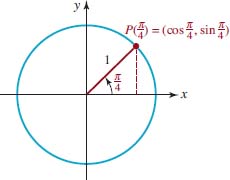
FIGURE 4.2.7 The point P(π⁄4)
For example, to justify the properties in (16) of Theorem 4.2.5 for 0 < t <π⁄2, consider FIGURE 4.2.6. Since the points P(t) and P(π⁄2 − t) are symmetric with respect to the line y = x, we can obtain the coordinates of P(π⁄2 − t), by interchanging the coordinates of P(t). Thus,
![]()
The special properties of the sine and cosine functions in Theorem 4.2.5 will become quite useful as soon as we determine additional values for and in the interval [0,2π). Using results from plane geometry we will now find the values of the sine and cosine functions for t − π⁄4, and t−π = 3.
![]() Finding sin (π⁄4) and cos(π⁄4) We draw an angle of π⁄4 radians (45°)in standard position and locate and label P(π⁄4) = (cos(π⁄4), sin(π⁄4))on the unit circle. As shown in FIGURE 4.2.7, we form a right triangle by dropping a perpendicular from P(π⁄4) to the x-axis. Since the sum of the angles in any triangle is π radians (180°), the third angle of this triangle is also π⁄4 radians hence, the triangle is isosceles. Therefore the coordinates of P(π⁄4) are equal; that is, cos(π⁄4) = sin(π⁄4). It follows from the Pythagorean identity (10)
Finding sin (π⁄4) and cos(π⁄4) We draw an angle of π⁄4 radians (45°)in standard position and locate and label P(π⁄4) = (cos(π⁄4), sin(π⁄4))on the unit circle. As shown in FIGURE 4.2.7, we form a right triangle by dropping a perpendicular from P(π⁄4) to the x-axis. Since the sum of the angles in any triangle is π radians (180°), the third angle of this triangle is also π⁄4 radians hence, the triangle is isosceles. Therefore the coordinates of P(π⁄4) are equal; that is, cos(π⁄4) = sin(π⁄4). It follows from the Pythagorean identity (10)
![]()
Dividing by 2 and taking the square root, we obtain cos(![]() SinceP(π⁄4) lies in the first quadrant, both coordinates must be positive. So we have found the (equal) coordinates of P(π⁄4):
SinceP(π⁄4) lies in the first quadrant, both coordinates must be positive. So we have found the (equal) coordinates of P(π⁄4):
![]()
![]() Finding sin (π⁄6)and cos (π⁄6) We construct two angles of (π⁄6) radians (30°)in the first and fourth quadrants, as shown in FIGURE 4.2.8, and label the points of intersection with the unit circleP(π⁄6) and Q, respectively. By drawing perpendicular line segments from P and Q to the x-axis, we obtain two congruent right triangles because each triangle has a hypotenuse of length 1 and angles of 30°, 60°, and 90°. Since the 90° angles form a straight angle, these two right triangles form an equilateral ΔPOQ triangle with sides of length 1. Since sin (π⁄6) is equal to half of the vertical side of ΔPOQ, we have
Finding sin (π⁄6)and cos (π⁄6) We construct two angles of (π⁄6) radians (30°)in the first and fourth quadrants, as shown in FIGURE 4.2.8, and label the points of intersection with the unit circleP(π⁄6) and Q, respectively. By drawing perpendicular line segments from P and Q to the x-axis, we obtain two congruent right triangles because each triangle has a hypotenuse of length 1 and angles of 30°, 60°, and 90°. Since the 90° angles form a straight angle, these two right triangles form an equilateral ΔPOQ triangle with sides of length 1. Since sin (π⁄6) is equal to half of the vertical side of ΔPOQ, we have
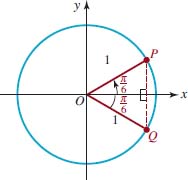
FIGURE 4.2.8 The point P(π⁄6)
From this result and the Pythagorean identity (10) we find the value of cos (π⁄6):
![]()
or
![]()
![]() Finding sin (π⁄3)and cos (π⁄3) We draw angles of (π⁄6) and (π⁄3) in standard position and locate and label the points P(π⁄6) and P(π⁄3), as shown in FIGURE 4.2.9. We then construct two congruent 30°−60°−90° triangles by dropping perpendiculars to the x- and y-axes, respectively. It follows from the congruence of these triangles that
Finding sin (π⁄3)and cos (π⁄3) We draw angles of (π⁄6) and (π⁄3) in standard position and locate and label the points P(π⁄6) and P(π⁄3), as shown in FIGURE 4.2.9. We then construct two congruent 30°−60°−90° triangles by dropping perpendiculars to the x- and y-axes, respectively. It follows from the congruence of these triangles that
![]()
The foregoing results also follow from (16) of Theorem 4.2.5 with t = (π⁄6).
We summarize the values of the sine and cosine functions corresponding to the basic fractional multiples of π that we have determined so far.
![]() We take the positive square root here because P(π⁄6) lies in the first quadrant.
We take the positive square root here because P(π⁄6) lies in the first quadrant.

FIGURE 4.2.9 The point P((π⁄3)
Values of the Sine and Cosine (Continued)

![]() Reference Angle As we noted at the beginning of this section, for each real number t there is a unique angle of t radians in standard position that determines the point P(t), with coordinates (cos t, sin t), on the unit circle. As shown in FIGURE 4.2.10, the terminal side of any angle of t radians (with P(t) not on an axis) will form an acute angle with the x-axis. We can then locate an angle of t′ radians in the first quadrant that is congruent to this acute angle. The angle of t′ radians is called the reference angle for t. Because of the symmetry of the unit circle, the coordinates of P(t′) will be equal in absolute value to the respective coordinates of P(t). Hence
Reference Angle As we noted at the beginning of this section, for each real number t there is a unique angle of t radians in standard position that determines the point P(t), with coordinates (cos t, sin t), on the unit circle. As shown in FIGURE 4.2.10, the terminal side of any angle of t radians (with P(t) not on an axis) will form an acute angle with the x-axis. We can then locate an angle of t′ radians in the first quadrant that is congruent to this acute angle. The angle of t′ radians is called the reference angle for t. Because of the symmetry of the unit circle, the coordinates of P(t′) will be equal in absolute value to the respective coordinates of P(t). Hence
![]()
As the following examples will show, reference angles can be used to find the trigonometric function values of any integer multiple of π⁄6, π⁄4, and π⁄3.
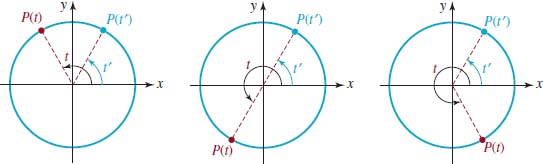
FIGURE 4.2.10 Reference angle t′ is an acute angle
EXAMPLE 3 Using Reference Angles
Find exact values of sint and cost for the given real number t.
(a) t = 5π⁄3 (b) t = −3π⁄4
Solution In each part we begin by finding the reference angle corresponding to the given value of t.
(a) From FIGURE 4.2.11 we find that an angle of t = 5π⁄3 radians determines a point P(5π⁄3) in the fourth quadrant and has the reference angle t′ = π⁄3 radians. After adjusting the signs of the coordinates of P(π⁄3) = (1⁄2, ![]() ) to obtain the fourth quadrant point P(5π⁄3) =
) to obtain the fourth quadrant point P(5π⁄3) = ![]() , we find that
, we find that
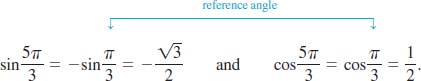
(b) The point P(−3π⁄4) lies in the third quadrant and has reference angle π⁄4, as shown in FIGURE 4.2.12. Therefore,
![]()
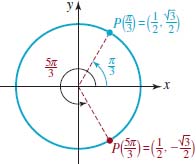
FIGURE 4.2.11 Reference angle in part (a) of Example 3

FIGURE 4.2.12 Reference angle in part (b) of Example 3
Sometimes, in order to find the trigonometric values of multiples of our basic fractions of π we must use periodicity or the even-odd function properties in addition to reference numbers.
EXAMPLE 4 Using Periodicity and a Reference Angle
Find exact values of sint and cost for t 5 29π⁄6.
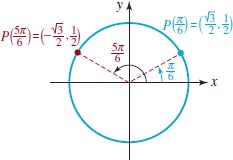
FIGURE 4.2.13 Reference angle in Example 4
Solution Since 29π⁄6 is greater than 2π, we rewrite 29π⁄6 as an integer multiple of 2π plus a number less than 2π:
![]()
From the periodicity equations (12) with n = 2 and t = 5π⁄6 we know that sin(29π⁄6) = sin(5π⁄6) and cos(29π⁄6) = cos(5π⁄6). Next we see from FIGURE 4.2.13 that the reference angle for 5π⁄6 is π⁄6. Since P(5π⁄6) is a second quadrant point, we have
![]()
and
![]()
EXAMPLE 5 Using the Even–Odd Properties
Find exact values of sint and cost for t = −π⁄6.
Solution Since sine is an odd function and cosine is an even function,
![]() See Theorem 4.2.4.
See Theorem 4.2.4.
![]()
This problem could also have been solved by using a reference angle.
![]() Trigonometric Functions of Angles In this section we have defined sine and cosine functions of the real number t by using the coordinates of a point P(t) on the unit circle. It is now possible to define the trigonometric functions of any angle θ. For any angle θ, we simply let
Trigonometric Functions of Angles In this section we have defined sine and cosine functions of the real number t by using the coordinates of a point P(t) on the unit circle. It is now possible to define the trigonometric functions of any angle θ. For any angle θ, we simply let
sinθ = sint and cosθ = cos t,
where the real number t is the radian measure of θ. As mentioned in Section 4.1., it is common to omit the word radians when measuring an angle. So we write sin(π⁄6) for both the sine of the real number π⁄6 and for the sine of the angle of π⁄6 radians. Furthermore, since the values of the trigonometric functions are determined by the coordinates of the point P(t) on the unit circle, it really does not matter whether θ is measured in radians or in degrees. For example, regardless of whether we are given θ = π⁄6 radians or θ = 30°, the point on the unit circle corresponding to this angle in standard position is ![]() Thus,
Thus,
![]()
4.2 Exercises Answers to selected odd-numbered problems begin on page ANS–12.
1. Given that ![]() and that P(t) is a point in the second quadrant, find sin t.
and that P(t) is a point in the second quadrant, find sin t.
2. Given that ![]() and that P(t) is a point in the second quadrant, find cos t.
and that P(t) is a point in the second quadrant, find cos t.
3. Given that ![]() and that P(t) is a point in the third quadrant, find cos t.
and that P(t) is a point in the third quadrant, find cos t.
4. Given that ![]() and that P(t) is a point in the fourth quadrant, find sin t.
and that P(t) is a point in the fourth quadrant, find sin t.
5. If ![]() find all possible values of cos t.
find all possible values of cos t.
6. If ![]() find all possible values of sin t.
find all possible values of sin t.
7. If cost = −0.2, find all possible values of sin t.
8. If sint = 0.4, find all possible values of cos t.
9. If 2sint − cost = 0, find all possible values of sint and cos t.
10. If 3sint − 2cost = 0, find all possible values of sint and cos t.
In Problems 11–14, find the exact value of (a) sint and (b) cost for the given value of t. Do not use a calculator.
11. t = −π⁄2
12. t = 3π
13. t = 8π
14. t = 23π⁄2
In Problems 15–26, for the given value of t determine the reference angle t′ and the exact values of sint and cos t. Do not use a calculator.
15. t = 2π⁄3
16. t = 4π⁄3
17. t = 5π⁄4
18. t = 3π⁄4
19. t = 11π⁄6
20. t = 7π⁄6
21. t = −π⁄4
22. t = −7π⁄4
23. t = −5π⁄6
24. t = −11π⁄6
25. t = −5π⁄3
26. t = −2π⁄3
In Problems 27–32, find the given trigonometric function value. Do not use a calculator.
27. sin(−11π⁄3)
28. cos(17π⁄6)
29. cos(−7π⁄4)
30. sin(−19π⁄2)
31. cos5π
32. sin(23π⁄3)
In Problems 33–38, justify the given statement with one of the properties of the trigonometric functions.
33. sinπ = sin3π
34. cos(π⁄4) = sin(π⁄4)
35. sin(−3 − p) = −sin(3 + π)
36. cos16.8π = cos14.8π
37. cos0.43 = cos(−0.43)
38. sin(2π⁄3) = sin(π⁄3)
In Problems 39–46, find the given trigonometric function value. Do not use a calculator.
39. sin135°
40. cos150°
41. cos210°
42. sin270°
43. cos330°
44. sin(−180°)
45. sin(−60°)
46. cos(−300°)
In Problems 47–50, find all angles t, where 0 ≤ t, < 2π, that satisfy the given condition.
47. sint = 0
48. cos t = −1
49. ![]()
50. ![]()
In Problems 51–54, find all angles θ, where 0° ≤ θ <, 360°, that satisfy the given condition.
51. ![]()
52. ![]()
53. ![]()
54. cosθ = 1
Miscellaneous Applications
55. Free Throw Under certain conditions the maximum height y attained by a basketball released from a height h at an angle α measured from the horizontal with an initial velocity v0 is given by ![]() where g is the acceleration due to gravity. Compute the maximum height reached by a free throw if h = 2.15 m, v0 = 8 m/s, α = 64.47°, and g = 9.81 m/s2.
where g is the acceleration due to gravity. Compute the maximum height reached by a free throw if h = 2.15 m, v0 = 8 m/s, α = 64.47°, and g = 9.81 m/s2.

Free throw
56. Putting the Shot The range of a shot put released from a height h above the ground with an initial velocity v0 at an angle a to the horizontal can be approximated by
![]()
where g is the acceleration due to gravity. If v0 = 13.7 m/s, α = 40°, and g = 9.81 m/s2, compare the ranges achieved for the release heights (a) h = 2.0 m and (b) h = 2.4 m. (c) Explain why an increase in h yields an increase in R if the other parameters are held fixed. (d) What does this imply about the advantage that height gives a shot-putter?
57. Acceleration Due to Gravity Because of its rotation, the Earth bulges at the equator and is flattened at the poles. As a result, the acceleration due to gravity is not a constant 980 cm/s2, but varies with latitude u. Satellite studies have shown that the acceleration due to gravity gsat is approximated by the function
![]()
(a) Find gsat at the equator (u = 0°), (b) at the North Pole, and (c) at 45° north latitude.
For Discussion
58. Discuss how it is possible to determine without a calculator that the point P(6) = (cos6, sin6) lies in the fourth quadrant.
59. Discuss how it is possible to determine without the aid of a calculator that both sin4 and cos4 are negative.
60. Is there a real number t satisfying 3sint = 5? Explain why or why not.
61. Is there an angle θ satisfying cosθ = −2? Explain why or why not.
62. Suppose f is a periodic function with period p. Show that F(x) = f(ax), a. > 0, is periodic with period p/a.
Introduction One way to further your understanding of the trigonometric functions is to examine their graphs. In this section we consider the graphs of the sine and cosine functions.
![]() Graphs of Sine and Cosine In Section 4.2. we saw that the domain of the sine function f(t) = sint is the set of real numbers (–∞, ∞) and the interval [−1, 1] is its range. Since the sine function has period 2π, we begin by sketching its graph on the interval [0, 2π]. We obtain a rough sketch of the graph given in FIGURE 4.3.1(b) by considering various positions of the point P(t) on the unit circle, as shown in Figure 4.3.1(a). As t varies from 0 to π⁄2, the value sint increases from 0 to its maximum value 1. But as t varies from π⁄2 to 3π⁄2, the value sint decreases from 1 to its minimum value −1. We note that sint changes from positive to negative at t = p. For t between 3π⁄2 and 2π, we see that the corresponding values of sint increase from − 1 to 0. The graph of any periodic function over an interval of length equal to its period is said to be one cycle of its graph. In the case of the sine function, the graph over the interval [0, 2π] in Figure 4.3.1(b) is one cycle of the graph of f(t) = sin t.
Graphs of Sine and Cosine In Section 4.2. we saw that the domain of the sine function f(t) = sint is the set of real numbers (–∞, ∞) and the interval [−1, 1] is its range. Since the sine function has period 2π, we begin by sketching its graph on the interval [0, 2π]. We obtain a rough sketch of the graph given in FIGURE 4.3.1(b) by considering various positions of the point P(t) on the unit circle, as shown in Figure 4.3.1(a). As t varies from 0 to π⁄2, the value sint increases from 0 to its maximum value 1. But as t varies from π⁄2 to 3π⁄2, the value sint decreases from 1 to its minimum value −1. We note that sint changes from positive to negative at t = p. For t between 3π⁄2 and 2π, we see that the corresponding values of sint increase from − 1 to 0. The graph of any periodic function over an interval of length equal to its period is said to be one cycle of its graph. In the case of the sine function, the graph over the interval [0, 2π] in Figure 4.3.1(b) is one cycle of the graph of f(t) = sin t.
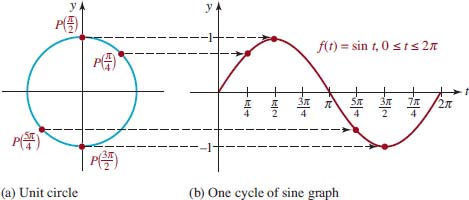
FIGURE 4.3.1 Points P(t) on a circle corresponding to points on the graph
From this point on we will revert to the traditional symbols x and y when graphing trigonometric functions. Thus,f(t ) = sint will either be written f(x) = sinx or simply y = sinx.
The graph of a periodic function is easily obtained by repeatedly drawing one cycle of its graph. In other words, the graph of y = sinx on, say, the intervals [ − 2 π, 0] and [2π, 4π] is the same as that given in Figure 4.3.1(b). Recall from Theorem 4.2.4 of Section 4.2. that the sine function is an odd function since f(− x) = sin( − x) = −sinx = −f(x). In other words, if (x, y) is a point on the graph off, then so is (−x, −y). Thus, from Theorem 2.2.1 it follows that the graph of y = sinx shown in FIGURE 4.3.2 is symmetric with respect to the origin.
![]() Note: Change of symbols
Note: Change of symbols

FIGURE 4.3.2 Graph of y = sinx
By working again with the unit circle we can obtain one cycle of the graph of the cosine function g(x) = cosxon the interval [0, 2π]. In contrast to the graph of f(x) = sinxwhere f(0) = f(2π) = 0, for the cosine function we have g(0) = g(2π) = 1.FIGURE 4.3.3 shows one cycle (in red) of y = cosx on [0, 2π], along with the extension of that cycle (in blue) to the adjacent intervals [22π, 0] and [2π, 4π]. We see from this figure that the graph of the cosine function is symmetric with respect to the y-axis. This is a consequence of gbeing an even function: g(2x) = cos(2x) = cosx = g(x).
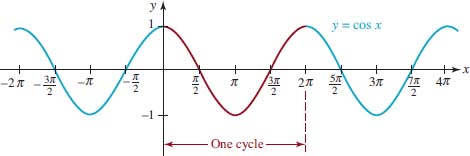
FIGURE 4.3.3 Graph of y = cosx
![]() Intercepts In this and subsequent courses in mathematics it is important that you know the x-coordinates of the x-intercepts of the sine and cosine graphs−in other words, the zeros of f(x) = sinx and g(x) = cosx. From the sine graph in Figure 4.3.2, we see that the zeros of the sine function, or the numbers for which sinx = 0, are x = 0, ±π, ±2π, ±3π,…. These numbers are integer multiples of π. From the cosine graph in Figure 4.3.3, we see that cos x = 0 when x = ±π⁄2, ±3π⁄2, ±5π⁄2,…. These numbers are odd-integer multiples of π⁄2.
Intercepts In this and subsequent courses in mathematics it is important that you know the x-coordinates of the x-intercepts of the sine and cosine graphs−in other words, the zeros of f(x) = sinx and g(x) = cosx. From the sine graph in Figure 4.3.2, we see that the zeros of the sine function, or the numbers for which sinx = 0, are x = 0, ±π, ±2π, ±3π,…. These numbers are integer multiples of π. From the cosine graph in Figure 4.3.3, we see that cos x = 0 when x = ±π⁄2, ±3π⁄2, ±5π⁄2,…. These numbers are odd-integer multiples of π⁄2.
If n represents an integer, then 2n 1 1 is an odd integer. Therefore the zeros of f(x) = sinx and g(x) = cosx can be written in a compact form.
Zeros of the Sine and Cosine Functions
Using the distributive law, the result in (2) is often written as x = π⁄2 + nπ.
As we did in Chapters 2 and 3, we can obtain variations of the basic sine and cosine graphs through rigid and nonrigid transformations. For the remainder of the discussion we will consider graphs of functions of the form
![]()
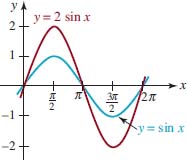
FIGURE 4.3.4 Vertical stretch of y = sinx
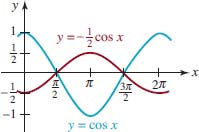
FIGURE 4.3.5 Graph of function in Example 1
![]() Graphs of y = A sinx + D and y = A cosx + D We begin by considering the special cases of (3):
Graphs of y = A sinx + D and y = A cosx + D We begin by considering the special cases of (3):
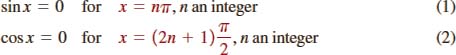
![]()
For A > 0, graphs of these functions are either a vertical stretch or a vertical compression of the graphs of y = sinx or y = cosx. For A < 0, the graphs are also reflected in the x-axis. For example, as FIGURE 4.3.4 shows, we obtain the graph of y = 2sinx by stretching the graph of y = sinx vertically by a factor of 2. Note that the maximum and minimum values of y = 2 sinx occur at the same x-values as the maximum and minimum values of y = sinx. In general, the maximum distance from any point on the graph of y = A sinx or y = Acosx to the x-axis is | A |. The number | A | is called the amplitude of the functions or of their graphs. The amplitude of the basic functions y = sinx and y = cosx is | A | = 1. In general, if a periodic function fis continuous, then over a closed interval of length equal to its period,f has both a maximum value M and a minimum value m. The amplitude is defined by
![]()
EXAMPLE 1 Vertically Compressed Cosine Graph
Graph ![]()
Solution The graph of ![]() is the graph of y = cos x compressed vertically by a factor of
is the graph of y = cos x compressed vertically by a factor of ![]() and then reflected in the x-axis. With the identification
and then reflected in the x-axis. With the identification ![]() , we see that the amplitude of the function is
, we see that the amplitude of the function is ![]() The graph of
The graph of ![]() cos x on the interval [0, 2π] is shown in red in FIGURE 4.3.5.
cos x on the interval [0, 2π] is shown in red in FIGURE 4.3.5.
The graphs of
![]()
are the graphs of y = Asinx and y = Acosx shifted vertically, up for D <. 0 and down for D <, 0. For example, the graph of y = 1 + 2sinx is the graph of y = 2sinx (Figure 4.3.4) shifted up 1 unit. The amplitude of the graph of either y = Asinx 1 D or y = Acosx 1 D is still | A |. Note that in FIGURE 4.3.6, the maximum of y = 1 + 2sinx is y = 3 at x = π⁄2 and the minimum is y = 21 at x = 3π⁄2. From (4), the amplitude of y = 1 + 2sinx is then ![]()
By interpreting x as a placeholder in (1) and (2), we can find the x-coordinates of the x-intercepts of the graphs of sine and cosine functions of the form y = AsinBx and y = AcosBx. (We consider this next.) For example, to solve sin2x = 0, we have from (1)
![]()

FIGURE 4.3.6 Graph of y = 2sinx shifted up 1 unit
that is, x = 0, ![]() and so on. See FIGURE 4.3.7.
and so on. See FIGURE 4.3.7.
![]() Graphs of y = AsinBx and y = AcosBx We now consider the graph of y = sin Bx for B | 0. The function has amplitude 1 since A = 1. Because the period of y = sin x is 2π, a cycle of the graph of y = sinBx begins at x = 0 and will start to repeat its values when Bx = 2π. In other words, a cycle of the function y = sinBx is completed on the interval defined by 0 ≤ Bx ≥ 2π. Dividing the last inequality by B shows that the period of the function y = sinBx is 2π⁄B and that the graph over the interval [0, 2π⁄B] is one cycle of its graph. For example, the period of y = sin2x is 2π⁄2 = p, and therefore one cycle of the graph is completed on the interval [0, π]. Figure 4.3.7 shows that two cycles of the graph of y = sin 2x (in red and blue) are completed on the interval [0, π], whereas the graph of y = sinx (in green) has completed only one cycle. In terms of transformations, we can characterize the cycle of y = sin 2x on [0, π] as a horizontal compression of the cycle of y = sin x on [0, 2π].
Graphs of y = AsinBx and y = AcosBx We now consider the graph of y = sin Bx for B | 0. The function has amplitude 1 since A = 1. Because the period of y = sin x is 2π, a cycle of the graph of y = sinBx begins at x = 0 and will start to repeat its values when Bx = 2π. In other words, a cycle of the function y = sinBx is completed on the interval defined by 0 ≤ Bx ≥ 2π. Dividing the last inequality by B shows that the period of the function y = sinBx is 2π⁄B and that the graph over the interval [0, 2π⁄B] is one cycle of its graph. For example, the period of y = sin2x is 2π⁄2 = p, and therefore one cycle of the graph is completed on the interval [0, π]. Figure 4.3.7 shows that two cycles of the graph of y = sin 2x (in red and blue) are completed on the interval [0, π], whereas the graph of y = sinx (in green) has completed only one cycle. In terms of transformations, we can characterize the cycle of y = sin 2x on [0, π] as a horizontal compression of the cycle of y = sin x on [0, 2π].
![]() Be careful here:
Be careful here: ![]()
FIGURE 4.3.7 Comparison of the graphs of y = sinx and y = sin2x
In summary, the graphs of
y = AsinBx and y = AcosBx
for B >. 0 each have amplitude 0 | A | and period 2π⁄B.
EXAMPLE 2 Horizontally Compressed Cosine Graph
Find the period of y = cos4x and graph the function.
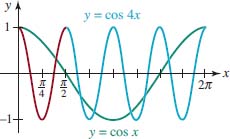
FIGURE 4.3.8 Graph of function in Example 2
Solution Since B = 4, we see that the period of y = cos4x is 2π⁄4 = π⁄2. We conclude that the graph of y = cos4x is the graph of y = cosx compressed horizontally. To graph the function, we draw one cycle of the cosine graph with amplitude 1 on the interval [0, π⁄2] and then use periodicity to extend the graph. FIGURE 4.3.8 shows four complete cycles of y = cos4x (the basic cycle in red and the extended graph in blue) and one cycle of y = cosx (in green) on [0, 2π]. Notice that y = cos4x attains its minimum at x = π⁄4 since cos4(π⁄4) = cosp = −1, and attains its maximum at x = π⁄2 since cos4(π⁄2) = cos2π = 1.
If B <, 0 in either y = Asin Bx or y = A cos Bx, we can use the even–odd properties (see (8) of Section 4.2.) to rewrite the function with positive B. This is illustrated in the next example.
EXAMPLE 3 Horizontally Stretched Sine Graph
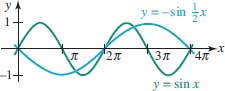
FIGURE 4.3.9 Graph of function in Example 3
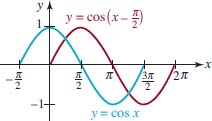
FIGURE 4.3.10 Horizontally shifted cosine graph
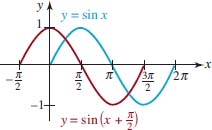
FIGURE 4.3.11 Horizontally shifted sine graph
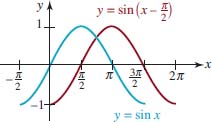
FIGURE 4.3.12 Horizontally shifted sine graph
Find the amplitude and period of ![]() Graph the function.
Graph the function.
Solution Since we require B >. 0, we use sin(−x) = −sin x. to rewrite the function as
![]()
With the identification A = −1, the amplitude is seen to be | A | = | −1 | = 1. Now with ![]() , we find that the period is
, we find that the period is ![]() Hence we can interpret the cycle of
Hence we can interpret the cycle of ![]() as a horizontal stretch and a reflection (in the x-axis because A, < 0) of the cycle of y = sinx on [0, 2π]. FIGURE 4.3.9 shows that on the interval [0, 4π], the graph of
as a horizontal stretch and a reflection (in the x-axis because A, < 0) of the cycle of y = sinx on [0, 2π]. FIGURE 4.3.9 shows that on the interval [0, 4π], the graph of ![]() (in blue) completes one cycle, whereas the graph of
(in blue) completes one cycle, whereas the graph of ![]() (in green) completes two cycles.
(in green) completes two cycles.
![]() Graphs of y = Asin(Bx + C) and y = Acos(Bx + C) We have seen that the basic graphs of y = sinx and y = cosx can be stretched or compressed vertically
Graphs of y = Asin(Bx + C) and y = Acos(Bx + C) We have seen that the basic graphs of y = sinx and y = cosx can be stretched or compressed vertically
![]()
shifted vertically
![]()
and stretched or compressed horizontally
![]()
The graphs of
![]()
are the graphs of y = AsinBx + D and y = AcosBx + D shifted horizontally.
In the remaining discussion we focus on the graphs of y = Asin(Bx + C) and y = Acos(Bx + C). For example, we know from Section 2.2. that the graph of y = cos(x − π⁄2) is the basic cosine graph shifted to the right. In FIGURE 4.3.10, the graph of y = cos(x − π⁄2) (in red) on the interval [0, 2π] is one cycle of y = cosx on the interval [−π/2, 3π⁄2] (in blue) shifted horizontally π⁄2 units to the right. Similarly, the graphs of y = sin(x + π⁄2) and y = sin(x − π⁄2) are the basic sine graphs shifted π⁄2 units to the left and to the right, respectively. See FIGURES 4.3.11 and 4.3.12.
By comparing the red graphs in Figures 4.3.10–4.3.12 with the graphs in Figures 4.3.2 and 4.3.3we see that
- the cosine graph shifted π⁄2 units to the right is the sine graph,
- the sine graph shifted π⁄2 units to the left is the cosine graph, and
- the sine graph shifted π⁄2 units to the right is the cosine graph reflected in the x-axis.
In other words, we have graphically verified the identities
![]()
We now consider the graph of y = Asin(Bx + C) for B > 0. Since the values of sin(Bx + C) range from −1 to 1, it follows that A sin(Bx + C) varies between −A and A. That is, the amplitude of y = Asin(Bx + C) is | A |. Also, as Bx + C varies from 0 to 2π, the graph will complete one cycle. By solving Bx + C = 0 and Bx + C = 2π, we find that one cycle is completed as x varies from = C/B to (2π − C)/B. Therefore, the function y = Asin(Bx + C) has the period
![]()
Moreover, if f(x) = AsinBx, then
![]()
The result in (6) shows that the graph of y = Asin(Bx + C) can be obtained by shifting the graph of f(x) = AsinBx horizontally a distance | C | /B. If C <, 0 the shift is to the right, whereas if C >. 0 the shift is to the left. The number | C | /B is called the phase shift of the graph of y = Asin(Bx + C).
EXAMPLE 4 Equation of a Shifted Cosine Graph
The graph of y = 10cos4x is shifted π⁄12 units to the right. Find its equation.
Solution By writing f(x) = 10cos4x and using (6), we find
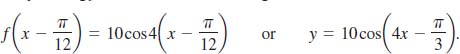
In the last equation we would identify C = −π⁄3. The phase shift is π⁄12.
![]() Note
Note
As a practical matter the phase shift of y = A sin(Bx + C) can be obtained by factoring the number B from Bx + C:
![]()
For convenience we summarize the preceding information.
Shifted Sine and Cosine Graphs
The graphs of
![]()
B > 0, are, respectively, the graphs of y = AsinBxand y = A cos Bx shifted horizontally by | C|/B. The shift is to the right if C < 0 and to the left if C > 0. The number |C | /B is called the phase shift. The amplitude of each graph is | A | and the period of each graph is 2π/B.
EXAMPLE 5 Horizontally Shifted Sine Graph
Graph y = 3 sin(2x − π⁄3).
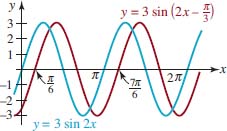
FIGURE 4.3.13 Graph of function in Example 5
Solution For purposes of comparison we will first graph y = 3sin2x. The amplitude of y = 3sin2x is | A | = 3 and its period is 2π/2 = π. Thus one cycle of y = 3sin2x is completed on the interval [0, π]. Then we extend this graph to the adjacent interval [π, 2π], as shown in blue in FIGURE 4.3.13. Next, we rewrite y = 3sin(2x − π⁄3) by factoring 2 from 2x − π⁄3:
![]()
From the last form we see that the phase shift is π⁄6. The graph of the given function, shown in red in Figure 4.3.13, is obtained by shifting the graph of y = 3sin2x to the right π⁄6 units. Remember, this means that if (x, y) is a point on the blue graph, then (x + π⁄6, y) is the corresponding point on the red graph. For example, x = 0 and x = π are the x-coordinates of two x-intercepts of the blue graph. Thus x = 0 + π⁄6 = π⁄6 and x = π + π⁄6 = 7π⁄6 are x-coordinates of the x-intercepts of the red or shifted graph. These numbers are indicated by the arrows in Figure 4.3.13.
EXAMPLE 6 Horizontally Shifted Graphs
Determine the amplitude, period, phase shift, and direction of horizontal shift for each of the following functions.
![]()
Solution (a) We first make the identifications A = 15, B = 5, and C = −3π⁄2. Thus the amplitude is | A | = 15and the period is 2π/B = 2π/5.The phase shift can be computed either by ( | −3π | /2)/5 = 3π/10 or by rewriting the function as
![]()
The last form indicates that the graph of y = 15cos(5x − 3π⁄2) is the graph of y = 15cos5x shifted 3π/10 units to the right.
(b) Since A = −8, the amplitude is | A | = | −8 | = 8. With B = 2 the period is 2π/2 = π. By factoring 2 from 2x + π⁄4, we see from
![]()
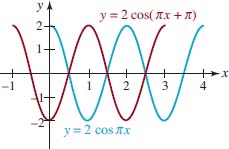
FIGURE 4.3.14 Graph of function in Example 7
![]()
that the phase shift is π⁄8. The graph of y = −8sin (2x + π4) is the graph of y = −8sin2x shifted π⁄8 units to the left.
EXAMPLE 7 Horizontally Shifted Cosine Graph
Graph y = 2cos(πx + π).
Solution The amplitude of y = 2cosπx is |A| = 2 and the period is 2π/π = −. Thus one cycle of y = −cosπx is completed on the interval [0, 2]. In FIGURE 4.3.14, two cycles of the graph of y = −cosπx (in blue) are shown. The x-intercepts of this graph correspond to the values of x for which cosπx = 0. By (2), this implies πx = (2n + 1)π⁄2 or x = (2n + 1)/2, n an integer. In other words, for n = 0, −1,1, −2, 2, −3,…, we get ![]() and so on. Now by rewriting the given funtion as
and so on. Now by rewriting the given funtion as
![]()
we see the phase shift is 1. The graph of y = 2cos(πx + π) (in red) in Figure 4.3.14 is obtained by shifting the graph of y = 2cosπx to the left 1 unit. This means that the x-intercepts are the same for both graphs.
EXAMPLE 8 Alternating Current
The current I (in amperes) in a wire of an alternating-current circuit is given by I(t) = 30sin 120πt, where t is time measured in seconds. Sketch one cycle of the graph. What is the maximum value of the current?
Solution The graph has amplitude 30 and period 2π/120π = ![]() . Therefore, we sketch one cycle of the basic sine curve on the interval
. Therefore, we sketch one cycle of the basic sine curve on the interval ![]() , as shown in FIGURE 4.3.15. From the figure it is evident that the maximum value of the current is I = 30 amperes and occurs at
, as shown in FIGURE 4.3.15. From the figure it is evident that the maximum value of the current is I = 30 amperes and occurs at ![]() since
since
![]()

FIGURE 4.3.15 Graph of current in Example 8
4.3 Exercises Answers to selected odd-numbered problems begin on page ANS–12.
In Problems 1–6, use the techniques of shifting, stretching, compressing, and reflecting to sketch at least one cycle of the graph of the given function.
1. ![]()
2. y = −1+cos x
3. y = 2−sin x
4. y = 3 + 3sinx
5. y = −2 + 4cosx
6. y = 1 − 2 sinx
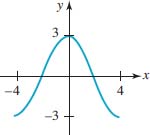
In Problems 7–10, the given figure shows one cycle of a sine or cosine graph. From the figure, determine A and D and write an equation of the form y = Asinx + D or y = Acosx + D for the graph.
7. 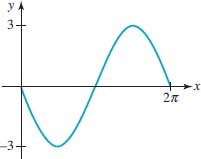
FIGURE 4.3.16 Graph for Problem 7
8. 
FIGURE 4.3.18 Graph for Problem 9
9. 
FIGURE 4.3.17 Graph for Problem 8
10. 
FIGURE 4.3.19 Graph for Problem 10
In Problems 11–16, use (1) and (2) of this section to find the x-intercepts for the graph of the given function. Do not graph.
11. y = sinπx
12. y = −cos2x
13. y = 10cos ![]()
14. y = 3sin(−5x)
15. y = ![]()
16. y = cos(2x − π)
In Problems 17 and 18, find the x-intercepts of the graph of the given function on the interval [0, 2π]. Then find all intercepts using periodicity.
17. y = −1 + sinx
18. y = 1− 2cosx
In Problems 19–24, the given figure shows one cycle of a sine or cosine graph. From the figure, determine A and B and write an equation of the form y = AsinBx or y = AcosBx for the graph.
19. 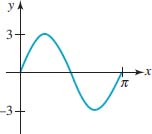
FIGURE 4.3.20 Graph for Problem 19
20. 
FIGURE 4.3.21 Graph for Problem 20
21. 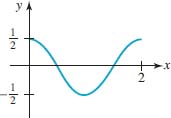
FIGURE 4.3.22 Graph for Problem 21
22. 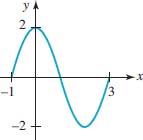
FIGURE 4.3.23 Graph for Problem 22
23. 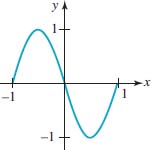
FIGURE 4.3.24 Graph for Problem 23
24. 
In Problems 25–32, find the amplitude and period of the given function. Sketch at least one cycle of the graph.
25. y = 4sinπx
26. ![]()
27. y = −3cos2πx
28. ![]()
29. y = 2−4sinx
30. y 2 − 2sinπx
31. ![]()
32. ![]()
In Problems 33–42, find the amplitude, period, and phase shift of the given function. Sketch at least one cycle of the graph.
33. ![]()
34. ![]()
35. ![]()
36. ![]()
37. ![]()
38. ![]()
39. ![]()
40. ![]()
41. ![]()
42. ![]()
In Problems 43 and 44, write an equation of the function whose graph is described in words.
43. The graph of y = cosx is vertically stretched up by a factor of 3 and shifted down by = units. One cycle of y = cosx on [0, 2π] is compressed to [0, π⁄3] and then the compressed cycle is shifted horizontally π⁄4 units to the left.
44. One cycle of y = sinx on [0, 2π] is stretched to [0, 8π] and then the stretched cycle is shifted horizontally π⁄12 units to the right. The graph is also compressed vertically by a factor of ![]() and then reflected in the x-axis.
and then reflected in the x-axis.
In Problems 45–48, find horizontally shifted sine and cosine functions so that each function satisfies the given conditions. Graph the functions.
45. Amplitude 3, period 2π⁄3, shifted by π⁄3 units to the right
46. Amplitude ![]() , period π, shifted by π⁄4 units to the left
, period π, shifted by π⁄4 units to the left
47. Amplitude 0.7, period 0.5, shifted by 4 units to the right
48. Amplitude ![]() , period 4, shifted by 1/2π units to the left
, period 4, shifted by 1/2π units to the left
In Problems 49 and 50, graphically verify the given identity.
49. cos(x+π) = −cosx
50. sin(x+π) = −sinx
Miscellaneous Applications
51. Pendulum The angular displacement θ of a pendulum from the vertical at time t seconds is given by θ(t) = θ0cosωt, where θ0 is the initial displacement at t = 0 seconds. See FIGURE 4.3.26. For ω = 2 rad/s and θ0 = π⁄10, sketch two cycles of the resulting function.
FIGURE 4.3.26 Pendulum in Problem 51
52. Current In a certain kind of electrical circuit, the current I measured in amperes at time t seconds is given by
![]()
Sketch two cycles of the graph of I as a function of time t.
53. Depth of Water The depth d of water at the entrance to a small harbor at time t is modeled by a function of the form
![]()
where A is one-half the difference between the high- and low-tide depths; 2π/B, B >. 0, is the tidal period; and C is the average depth. Assume that the tidal period is 12 hours, the depth at high tide is 18 feet, and the depth at low tide is 6 feet. Sketch two cycles of the graph of d.
54. Fahrenheit Temperature Suppose that
![]()
0 ≤ t ≤ 24, is a mathematical model of the Fahrenheit temperature at t hours after midnight on a certain day of the week.
(a) What is the temperature at 8 A.M.?
(b) At what time(s) does T(t) = 60?
(c) Sketch the graph of T.
(d) Find the maximum and minimum temperatures and the times at which they occur.
Calculator Problems
In Problems 55–58, use a calculator to investigate whether the given function is periodic.
55. ![]()
56. ![]()
57. ![]()
58. ![]()
For Discussion
In Problems 59 and 60, find the period of the given function.
59. ![]()
60. ![]()
In Problems 61 and 62, discuss and then sketch the graph of the given function.
61. f(x) = 0 sinx 0 62. f(x) = 0 cosx 0
61. ![]()
62. ![]()
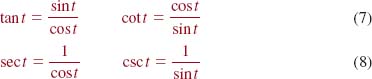
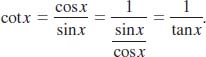
Introduction Recall that the remaining four trigonometric functions are the tangent, cotangent, secant, and cosecant functions and are denoted, in turn, as tan x, cot x, sec x, and csc x. We saw in Section 4.2. that by using (1) and (2) of Definition 4.2.1 in (3)–(6) of Definition 4.2.2 we can express these four new functions in terms of sinx and cosx:
![]() Domain and Range Because the functions in (1) and (2) are quotients, we know from Definition 2.6.1 that the domain of each function consists of the set of real numbers except those numbers for which the denominator is zero. We have seen in (2) of Section 4.3. that cosx = 0 for x = (2n + 1)π⁄2, n = 0, ±1, ±2,…., and so
Domain and Range Because the functions in (1) and (2) are quotients, we know from Definition 2.6.1 that the domain of each function consists of the set of real numbers except those numbers for which the denominator is zero. We have seen in (2) of Section 4.3. that cosx = 0 for x = (2n + 1)π⁄2, n = 0, ±1, ±2,…., and so
• the domain of tanx and of secx is ![]()
Similarly, from (1) of Section 4.3., sinx = 0 for x = nπ, n = 0, ±1, ±2,…., and so it follows that
• the domain of cotx and of cscx is ![]()
We know that the values of the sine and cosine are bounded, that is, | sin x | ≤ 1 and | cosx | ≤ 1. From these last inequalities we have
![]()
and
![]()
Recall that an inequality such as (3) means that secx $ 1 or secx ≥ −1. Hence the range of the secant function is (2∞, −1] U [1, ∞). The inequality in (4) implies that the cosecant function has the same range (−∞, −1] U [1, ∞). When we consider the graphs of the tangent and cotangent functions we will see that they have the same range: (−∞, ∞).
If we interpret x as an angle, then FIGURE 4.4.1 illustrates the algebraic signs of the tangent, cotangent, secant, and cosecant functions in each of the four quadrants. This is easily verified using the signs of the sine and cosine functions displayed in Figure 4.2.2.

FIGURE 4.4.1 Signs of tanx, cotx, secx, and cscx, in the four quadrants
EXAMPLE 1 Example = of Section 4.2. Revisited
Find tanx, cotx, secx, and cscx for x = 2π⁄6.
Solution In Example = of Section 4.2. we saw that
![]()
Therefore, by the definitions in (1) and (2):
Table 4.4.1 summarizes some important values of the tangent, cotangent, secant, and cosecant and was constructed using values of the sine and cosine from Section 4.2.. A dash in the table indicates that the trigonometric function is not defined at that particular value of x.
TABLE 4.4.1

![]() Identities The tangent is related to the secant by a useful identity. If we divide the Pythagorean identity
Identities The tangent is related to the secant by a useful identity. If we divide the Pythagorean identity
![]()
by cos2x, we see that
![]()
Similarly, dividing (5) by sin2 x yields an identity relating the cotangent with the cosecant:
![]()
Using the laws of exponents,
we see that (6) and (7) can be written in a simpler manner:
![]()
Since last two identities are direct consequences of sin2x + cos2x = 1 they too are called Pythagorean identities.
Finally, note that the tangent and cotangent function are related by the reciprocal identity
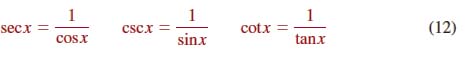
![]() Summary For future reference, especially for the work in the next section, we pause here to summarize a small collection of identities that are so basic to the study of trigonometry that they are known collectively as the fundamental identities. You should firmly commit these identities to memory.
Summary For future reference, especially for the work in the next section, we pause here to summarize a small collection of identities that are so basic to the study of trigonometry that they are known collectively as the fundamental identities. You should firmly commit these identities to memory.
Fundamental Trigonometric Identities
Pythagorean identities:
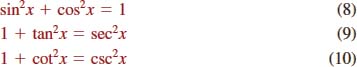
Quotient identities:
![]()
Reciprocal identities:
EXAMPLE 2 Using a Pythagorean Identity
Given that cscx = −5 and 3π⁄2, < x <, 2π, determine the values of tanx and cotx. Solution We first compute cot x. It follows from (10) that
![]()
For 3π⁄2, <x, <2π, we see from Figure 4.4.1 that cot x must be negative and so we take the negative square root:
![]()
Using cotx = 1/tanx, we have
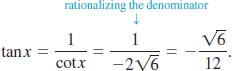
In Example 2, given the information cscx = −5and 3π⁄2, <x, <2π, we could easily find the values of the remaining five trigonometric functions. One way of proceeding would be to use cscx = 1/sinx to find sinx = 1/cscx ![]() . Then we use sin2 x + cos2 x = 1 to find cos x. After we have found cos x, the remaining three trigonometric functions can be obtained from (1) and (2).
. Then we use sin2 x + cos2 x = 1 to find cos x. After we have found cos x, the remaining three trigonometric functions can be obtained from (1) and (2).
![]() Periodicity Because the sine and cosine functions are 2π periodic, each of the functions in (1) and (2) have a period 2π. But from (17) of Theorem 4.2.5 we have
Periodicity Because the sine and cosine functions are 2π periodic, each of the functions in (1) and (2) have a period 2π. But from (17) of Theorem 4.2.5 we have
![]()
![]() Also see Problems 49 and 50 in Exercises 4.3.
Also see Problems 49 and 50 in Exercises 4.3.
Thus (13) implies that tanx and cotx are periodic with a period p ≤ π. In the case of the tangent function, tanx = 0 only if sinx = 0, that is, only if x = 0, ±π, ±2π, and so on. Therefore, the smallest positive number p for which tan(x + p) = tanx is p = π. The cotangent function has the same period since it is the reciprocal of the tangent function.
THEOREM 4.4.1 Period of the Tangent and Cotangent
The tangent and cotangent functions are periodic with period π. Therefore,
![]()
for every real number x for which the functions are defined.
THEOREM 4.4.2 Period of the Secant and Cosecant
The secant and cosecant functions are periodic with period 2π. Therefore,
![]()
for every real number x for which the functions are defined.
![]() Even-Odd Properties Because the cosine function is even and the sine function is odd, each of the remaining four trigonometric functions is either even or odd.
Even-Odd Properties Because the cosine function is even and the sine function is odd, each of the remaining four trigonometric functions is either even or odd.
THEOREM 4.4.3 Even and Odd Functions
The tangent, cotangent, and cosecant functions are odd functions, whereas the secant function is an even function. That is,
![]()
for every real number x for which the functions are defined,
![]() This is a good time to review (7) of Section 3.6.
This is a good time to review (7) of Section 3.6.
PROOF: We prove the first entries in (16) and (17). Because cos( = x) = cosx and sin( = x) = = sinx,
proves, in turn, that tanx is an odd function and secx is an even function.
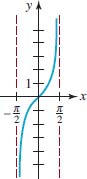
FIGURE 4.4.2 One cycle of the graph of y = tanx
![]() Graphs of y 5 tanx and y 5 cotx The numbers that make the denominators of tanx, cotx, secx, and cscx equal to zero correspond to vertical asymptotes of their graphs. For example, we encourage you to verify, using a calculator, that
Graphs of y 5 tanx and y 5 cotx The numbers that make the denominators of tanx, cotx, secx, and cscx equal to zero correspond to vertical asymptotes of their graphs. For example, we encourage you to verify, using a calculator, that
![]()
In other words, x = −π/2 and x = π⁄2 are vertical asymptotes. The graph of y = tanx on the interval (−π/2, π⁄2) given in FIGURE 4.4.2 is one cycle of the graph of y = tanx. Using periodicity we extend the cycle in Figure 4.4.2 to adjacent intervals of length π, as shown in FIGURE 4.4.3. The x-intercepts of the graph of the tangent function are (0, 0), (±π, 0), (±2π, 0),…., and the vertical asymptotes of the graph are x = ±π⁄2, ±3π⁄2, ±5π⁄2,….

FIGURE 4.4.3 Graph of y = tanx
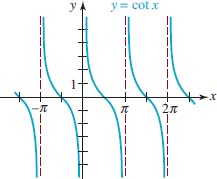
FIGURE 4.4.4 Graph of y = cotx
The graph of y = cotx is similar to the graph of the tangent function and is given in FIGURE 4.4.4. In this case, the graph of y = cotx on the interval (0, π) is one cycle of the graph of y = cotx. The x-intercepts of the graph of the cotangent function are (±π⁄2, 0), (±3π⁄2, 0), (±5π⁄2, 0),…., and the vertical asymptotes of the graph are x = 0, ±π, 62π, ±3π,…. Because y = tanx and y = cotx are odd functions, their graphs are symmetric with respect to the origin.
![]() Graphs of y 5 secx and y 5 cscx For both y = secx and y = cscx we know that | y ≤ | $ 1, and so no portion of their graphs can appear in the horizontal strip −1, <y <, 1 of the Cartesian plane. Hence the graphs of y = secx and y = cscx have no x-intercepts. Both y = secx and y = cscx have period 2π. The vertical asymptotes for the graph of y = secx are the same as y = tanx, namely, x = ±π⁄2, ±3π⁄2, ±5π⁄2,…. Because y = sec x is an even function, its graph is symmetric with respect to the y-axis. On the other hand, the vertical asymptotes for the graph of y = cscx are the same as y = cot x, namely, x = 0, ±π, ±2π, ±3π,…. Because y = csc x is an odd function, its graph is symmetric with respect to the origin. One cycle of the graph of y = sec x on [0, 2π] is extended to the interval [−2π, 0] by periodicity (or y-axis symmetry) in FIGURE 4.4.5. Similarly, in FIGURE 4.4.6 we extend one cycle of y = cscx on (0, 2π) to the interval (−2π, 0) by periodicity (or origin symmetry).
Graphs of y 5 secx and y 5 cscx For both y = secx and y = cscx we know that | y ≤ | $ 1, and so no portion of their graphs can appear in the horizontal strip −1, <y <, 1 of the Cartesian plane. Hence the graphs of y = secx and y = cscx have no x-intercepts. Both y = secx and y = cscx have period 2π. The vertical asymptotes for the graph of y = secx are the same as y = tanx, namely, x = ±π⁄2, ±3π⁄2, ±5π⁄2,…. Because y = sec x is an even function, its graph is symmetric with respect to the y-axis. On the other hand, the vertical asymptotes for the graph of y = cscx are the same as y = cot x, namely, x = 0, ±π, ±2π, ±3π,…. Because y = csc x is an odd function, its graph is symmetric with respect to the origin. One cycle of the graph of y = sec x on [0, 2π] is extended to the interval [−2π, 0] by periodicity (or y-axis symmetry) in FIGURE 4.4.5. Similarly, in FIGURE 4.4.6 we extend one cycle of y = cscx on (0, 2π) to the interval (−2π, 0) by periodicity (or origin symmetry).
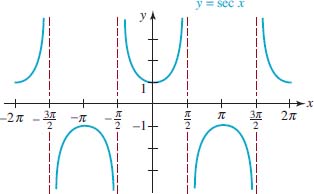
FIGURE 4.4.5 Graph of y = secx
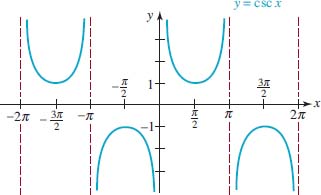
FIGURE 4.4.6 Graph of y = cscx
![]() Transformations and Graphs Similar to the sine and cosine graphs, rigid and nonrigid transformations can be applied to the graphs of y = tan x, y = cot x, y = sec x, and y = csc x. For example, a function such as y = Atan(Bx + C) + D can be analyzed in the following manner:
Transformations and Graphs Similar to the sine and cosine graphs, rigid and nonrigid transformations can be applied to the graphs of y = tan x, y = cot x, y = sec x, and y = csc x. For example, a function such as y = Atan(Bx + C) + D can be analyzed in the following manner:
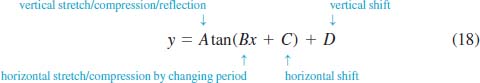
If B >. 0, then the period of
![]()
whereas the period of
![]()
As we see in (18), the number A in each case can be interpreted as either a vertical stretch or a compression of a graph. However, you should be aware of the fact that the functions in (19) and (20) have no amplitude, because none of the functions has a maximum and a minimum value.
![]() Of the six trigonometric functions, only the sine and cosine functions have an amplitude.
Of the six trigonometric functions, only the sine and cosine functions have an amplitude.
EXAMPLE 3 Comparison of Graphs
Find the period, x-intercepts, and vertical asymptotes for the graph of y = tan 2x. Graph the function on [0, π].
Solution With the identification B = 2, we see from (19) that the period is π⁄2. Since tan2x = sin2x/cos2x, the x-intercepts of the graph occur at the zeros of sin2x. From (1) of Section 4.3., sin2x = 0 for
![]()
That is, x = 0, ±π⁄2, ±2π/2 = π, ±3π⁄2, ±4π⁄2 = 2π, and so on. The x-intercepts are (0, 0), (±π⁄2, 0), (±π, 0), (±3π⁄2, 0),…. The vertical asymptotes of the graph occur at zeros of cos2x. From (2) of Section 4.3., the numbers for which cos 2x = 0 are found in the following manner:
![]()
That is, the vertical asymptotes are x = ±π⁄4, ±3π⁄4, ±5π⁄4,…. On the interval [0, π], the graph of y = tan 2x has three intercepts (0, 0), (π⁄2, 0), and (π, 0) and two vertical asymptotes x = π⁄4 and x = 3π⁄4. In FIGURE 4.4.7, we have compared the graphs of y = tan x and y = tan 2x on the interval. The graph of y = tan 2x is a horizontal compression of the graph of y = tanx.
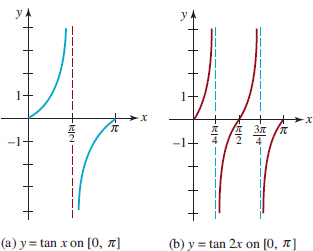
FIGURE 4.4.7 Graph of functions in Example 3
EXAMPLE 4 Comparison of Graphs
Compare one cycle of the graphs of y = tanx and y = tan(x − π⁄4).
Solution The graph of y = tan(x − π⁄4) is the graph of y = tanx shifted horizontally π⁄4 units to the right. The intercept (0, 0) for the graph of y = tanx is shifted to (π⁄4, 0) on the graph of y = tan(x − π⁄4). The vertical asymptotes x = −π/2 and x = π⁄2 for the graph of y = tan x are shifted to x = −π⁄4 and x = 3π⁄4 for the graph of y = tan(x − π⁄4). In FIGURES 4.4.8(a) and 4.4.8(b) we see, respectively, that a cycle of the graph of y = tanx on the interval (−π/2, π⁄2) is shifted to the right to yield a cycle of the graph of y = tan(x − π⁄4) on the interval (−π⁄4, 3π⁄4).
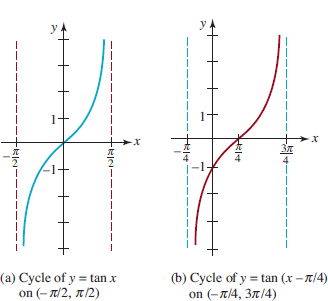
FIGURE 4.4.8 Graph of functions in Example 4
As we did in the analysis of the graphs of y = Asin(Bx + C) and y = Acos(Bx + C), we can determine the amount of horizontal shift for graphs of functions such as y = Atan(Bx + C) and y = Asec(Bx + C) by factoring the number B > 0 from Bx + C.
EXAMPLE 5 Two Shifts and Two Compressions
Graph ![]()
Solution Let’s break down the analysis of the graph into four parts, namely, by transformations.
(i) One cycle of the graph of y = sec x occurs on [0, 2π]. Since the period of y = sec 3x is 2π⁄3, one cycle of its graph occurs on the interval [0, 2π⁄3]. In other words, the graph of y = sec3x is a horizontal compression of the graph of y = secx. Since sec3x = 1/cos3x, the vertical asymptotes occur at the zeros of cos3x. Using (2) of Section 4.3., we find
![]()
Figure 4.4.9(a) shows two cycles of the graph y = sec3x; one cycle on [−2π⁄3, 0] and another on [0, 2π⁄3]. Within those intervals the vertical asymptotes are x = −π/2, x = −π⁄6, x = π⁄6, and x = π⁄2.
(ii) The graph of y = −![]() sec 3x is the graph of y = sec3x compressed vertically by a factor of
sec 3x is the graph of y = sec3x compressed vertically by a factor of ![]() and then reflected in the x-axis. See Figure 4.4.9(b).
and then reflected in the x-axis. See Figure 4.4.9(b).
(iii) By factoring 3 from 3x − π⁄2, we see from
![]()
that the graph of ![]() is the graph of y = −
is the graph of y = −![]() sec3xshifted π⁄6units to the right. By shifting the two intervals [−2π⁄3, 0] and [0, 2π⁄3] in Figure 4.4.9(b) to the right π⁄6 units, we see in Figure 4.4.9(c) two cycles of y = −
sec3xshifted π⁄6units to the right. By shifting the two intervals [−2π⁄3, 0] and [0, 2π⁄3] in Figure 4.4.9(b) to the right π⁄6 units, we see in Figure 4.4.9(c) two cycles of y = −![]() sec(3x − π⁄2) on the intervals [−π/2, π⁄6] and [π⁄6, 5π⁄6]. The vertical asymptotes x = −π/2, x = 2π⁄6, x = π⁄6, and x = π⁄2 shown in Figure 4.4.9(b) are shifted to x = −π⁄3, x = 0, x = π⁄3, and x = −π⁄3.Observe that the y-intercept (0, −
sec(3x − π⁄2) on the intervals [−π/2, π⁄6] and [π⁄6, 5π⁄6]. The vertical asymptotes x = −π/2, x = 2π⁄6, x = π⁄6, and x = π⁄2 shown in Figure 4.4.9(b) are shifted to x = −π⁄3, x = 0, x = π⁄3, and x = −π⁄3.Observe that the y-intercept (0, −![]() ) in Figure 4.4.9(b) is now moved to (π⁄6, −
) in Figure 4.4.9(b) is now moved to (π⁄6, −![]() ) in Figure 4.4.9(c).
) in Figure 4.4.9(c).
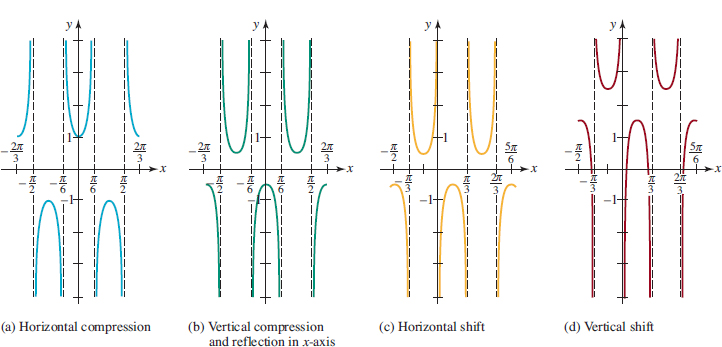
FIGURE 4.4.9 Graph of function in Example 5
(iv) Finally, we obtain the graph y = 2 − ![]() sec(3x − π⁄2) in Figure 4.4.9(d) by shifting the graph of y = −
sec(3x − π⁄2) in Figure 4.4.9(d) by shifting the graph of y = −![]() sec(3x − π/2) in Figure 4.4.9(c) two units upward.
sec(3x − π/2) in Figure 4.4.9(c) two units upward.
4.4 Exercises Answers to selected odd-numbered problems begin on page ANS-13.
In Problems 1 and 2, complete the given table.
1.
2.
In Problems 3–18, find the indicated value without the use of a calculator.
3.![]()
4.
5.![]()
6. sec 7π
7.![]()
8.![]()
9.![]()
10.![]()
11.![]()
12.![]()
13.![]()
14.![]()
15.![]()
16.![]()
17.![]()
18.![]()
In Problems 19–26, use the given information to find the values of the remaining five trigonometric functions.
19.tanx = −2, π/2 < x <π
20.![]()
21.![]()
22.secx = −2, π/2 < x <π
23.![]()
24.![]()
25.![]()
26.![]()
27. If 3 cosx = sinx, find all values of tanx, cotx, secx, and cscx.
28. If cscx = secx, find all values of tanx, cotx, sinx, and cosx.
In Problems 29–36, find the period, x-intercepts, and the vertical asymptotes of the given function. Sketch at least one cycle of the graph.
29.y = tanπx
30.![]()
31.y = cos2x
32.![]()
33.![]()
34.![]()
35.y = −1 = +cot πx
36.![]()
In Problems 37–44, find the period and the vertical asymptotes of the gi Sketch at least one cycle of the graph.
37. y = −secx
38.![]()
39.y = 3cscπx
40.![]()
41.![]()
42.y = csc(4x + π)
43.![]()
44.y = −1 + sec(x − 2π)
In Problems 45 and 46, use the graphs of y = tanx and y = secx to find numbers A and C for which the given equality is true.
45.cotx = Atan(x + C)
46.cscx = Asec(x + C)
Calculator Problems
47. Using a calculator in radian mode, compare the values of tan1.57 and tan1.58. Explain the difference in these values.
48. Using a calculator in radian mode, compare the values of cot 3.14 and cot 3.15.
For Discussion
49. Can 9 cscx = 1 for any real number x?
50. Can 7 + 10secx = 0 for any real number x?
51. For which real numbers x is (a) sinx ≤cscx? (b) sinx <, cscx?
52. For which real numbers x is (a) secx ≤cosx? (b) secx, < cosx?
53. Discuss and then sketch the graphs of y = | secx | and y = | cscx |.
Introduction There are many identities involving trigonometric functions; in this section we will illustrate how to verify some of them.
A trigonometric identity is an equation or formula involving only trigonometric functions that is valid for all angles measured in degrees or radians or for real numbers for which both sides of the equality are defined. To verify a trigonometric identity we use
• the fundamental trigonometric identities, (8)−(12) in Section 4.4.
• the even-odd properties, ![]()
• and basic arithmetic and algebraic operations.
For example,
![]()
is an identity for all real numbers for which tan x is defined and tan x ≠ 0. To verify the identity we start on one side of the equation and deduce through valid manipulations the equivalence with the other side. In the case of (1) we will start on the left-hand side:
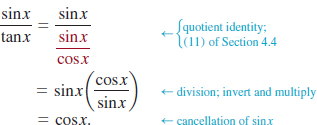
EXAMPLE 1 Using a Reciprocal Identity
Write sinxsecx as a single trigonometric function.
Solution Using the reciprocal identity secx = 1/cosx, we find
![]()
EXAMPLE 2 Simplification
Simplify (1 + sinx)(1 + sin(−x)).
Solution First we recall that the sine is an odd function, that is, sin(−x) = −sinx. Then from algebra we know (a + b) (a − b) = a2 2 b2. With the identifications a = 1 and b = sinx we can write
(1 + sinx)(1 + sin(−x)) = (1 + sinx)(1 − sinx) = 1 − sin2x.
Finally, the Pythagorean identity sin2x + cos2x = 1 implies 1 − sin2x = cos2x. Therefore,
![]()
EXAMPLE 3 Verification
Verify the identity sec2t + csc2t = sec2t csc2t.
Solution We begin with the left-hand side of the equation:
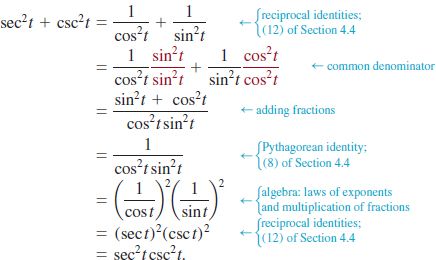
Implicit in Example 3 is the assumption that the identity is valid only for those values of t for which both sides of the identity are defined. In Example 3, for t a real number, we must require that t ≠ nπ and t ≠ (2n + 1)π⁄2, where n is an integer. In the remaining examples, we will not mention the restrictions on the variable.
![]() Suggestions In order to verify a trigonometric identity, we are required to show that the given expressions are equivalent. In the preceding example, we worked with the expression on the left-hand side of the equation to show that that side was equivalent to the other. Starting on one side of an equation and deducing the other side is standard practice in verifying trigonometric identities. But often we can perform correct work on one side of an equation and reach a point where that side is simplified but appears to be not identical to the other side. This does not mean the identity is false; sometimes we must reduce each side of an equation separately to the same expression. However, the same algebraic operations should not be performed on both sides of the equation simultaneously. In other words, do not treat a trigonometric equation as an identity until after you have proven that it is really true. Although there is no general method for demonstrating that a trigonometric equation is an identity, we list below a few suggestions that may be useful.
Suggestions In order to verify a trigonometric identity, we are required to show that the given expressions are equivalent. In the preceding example, we worked with the expression on the left-hand side of the equation to show that that side was equivalent to the other. Starting on one side of an equation and deducing the other side is standard practice in verifying trigonometric identities. But often we can perform correct work on one side of an equation and reach a point where that side is simplified but appears to be not identical to the other side. This does not mean the identity is false; sometimes we must reduce each side of an equation separately to the same expression. However, the same algebraic operations should not be performed on both sides of the equation simultaneously. In other words, do not treat a trigonometric equation as an identity until after you have proven that it is really true. Although there is no general method for demonstrating that a trigonometric equation is an identity, we list below a few suggestions that may be useful.
EXAMPLE 4 Verification
Verify the identity

Solution In this example we show that the right-hand side of the equation is equivalent to the left-hand side. You should be able to supply a justification for each step of the solution.
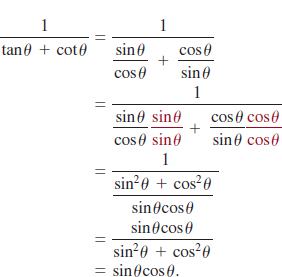
EXAMPLE 5 Verification
Verify the identity
![]()
Solution Because the left-hand side of the equation looks a bit more complicated than the right-hand side, we begin there:

Because we have arrived at such a simple expression, we now try to reduce the right-hand side to the same quantity:
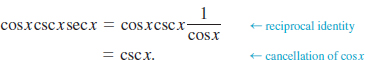
Since both sides of the original equation are equivalent to cscx, they are equivalent to each other. Therefore, the equation is an identity.
EXAMPLE 6 Verification
Verify the identity
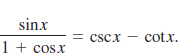
Solution If we multiply numerator and denominator of the left-hand side of the equation by the conjugate factor of the denominator we can use a Pythagorean identity:
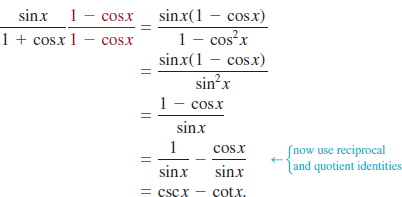
![]() Trigonometric Substitutions In a calculus course it is often useful to make use of a trigonometric substitution using a sine, cosine, or tangent function to change the form of an algebraic expression involving a radical into a trigonometric expression with no radical. Generally, this is done using one of the Pythagorean identities. The following example illustrates the technique.
Trigonometric Substitutions In a calculus course it is often useful to make use of a trigonometric substitution using a sine, cosine, or tangent function to change the form of an algebraic expression involving a radical into a trigonometric expression with no radical. Generally, this is done using one of the Pythagorean identities. The following example illustrates the technique.
EXAMPLE 7 Rewriting a Radical
Rewrite ![]() as a trigonometric expression without a radical by means of the substitution x = asinθ, a >. 0 and −π/2 ≤ θ ≤ π⁄2.
as a trigonometric expression without a radical by means of the substitution x = asinθ, a >. 0 and −π/2 ≤ θ ≤ π⁄2.
Solution If x = asinθ, then
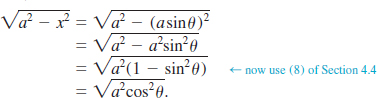
The restriction of the variable θ enables us to take the foregoing square root without recourse to absolute values. In other words, since a >. 0 and cosθ $ 0 for −π/2 ≤ θ ≤ π⁄2, the original radical is the same as
![]()
4.5 Exercises Answers to selected odd-numbered problems begin on page ANS–14.
In Problems 1–10, use the fundamental identities and the even-odd identities to simplify each expression.
1. sectcost −.
2. tanα cosα
3. ![]()
4. ![]()
5. tan2t−sec2t
6. 1+tan2 (−θ)
7.sin(−t)+sin t
8. ![]()
9.sec(−x)cosx
10. ![]()
In Problems 11–22, reduce the given expression to a single trigonometric function. sint + sint cos t
11. ![]()
12. cosx + cosx tan2x
13. ![]()
14. ![]()
15. sinx + cosx cotx
16. sinθ tanθ csc2θ−sinθ tanθ
17. ![]()
18. ![]()
19. sint cost tant sect cott
20. ![]()
21. ![]()
22. (sin2x − 1)(cot2x + 1)
In Problems 23–64, verify the given identity.
23. ![]()
24. ![]()
25. 1 − cos4θ = (2 − sin2θ)sin2θ
26. ![]()
27. 1 − 2sin2t = 2cos2>t − 1
28. tan2β−sin2β = sin2βtan2β
29. ![]()
30. ![]()
31. ![]()
32. ![]()
33. sin2xcot2x+cos2xtan2x = 1
34. ![]()
35. ![]()
36. ![]()
37. ![]()
38. ![]()
39. ![]()
40. ![]()
41. ![]()
42. ![]()
43. ![]()
44. ![]()
45. ![]()
46. ![]()
47. 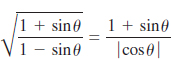
48. ![]()
49. ![]()
50. ![]()
51. ![]()
52. ![]()
53. ![]()
54. ![]()
55. ![]()
56. ![]()
57. ![]()
58. sin6t+ = 1−3sin2tcos2t
59. csc2t −csc2t = cot2t +cot2t
60. ![]()
61. ![]()
62. ![]()
63. ![]()
64. ![]()
In Problems 65–74, rewrite the given expression as a trigonometric expression without radicals by making the indicated substitution. Assume that a. 0.
65. ![]()
66. ![]()
67. ![]()
68. ![]()
69. ![]()
70. ![]()
71. ![]()
72. ![]()
73. ![]()
74. ![]()
For Discussion
In Problems 75 and 76, show that the given expression is not an identity.
75. ![]()
76. (sinx+cosx)2 = sin2x+cos2x
![]() Introduction In this section we continue our examination of trigonometric identities. But this time we are going to develop only those identities that are of particular importance in courses in mathematics and science.
Introduction In this section we continue our examination of trigonometric identities. But this time we are going to develop only those identities that are of particular importance in courses in mathematics and science.
![]() Sum and Difference Formulas The sum and difference formulas for the cosine and sine functions are identities that reduce cos(x1 + x2), cos(x1 − x2), sin(x1 + x2), and sin(x1 − x2) to expressions that involve cosx1, cosx2, sinx1, and sin x2. We will derive the formula for cos(x1 − x2) first, and then we will use that result to obtain the others.
Sum and Difference Formulas The sum and difference formulas for the cosine and sine functions are identities that reduce cos(x1 + x2), cos(x1 − x2), sin(x1 + x2), and sin(x1 − x2) to expressions that involve cosx1, cosx2, sinx1, and sin x2. We will derive the formula for cos(x1 − x2) first, and then we will use that result to obtain the others.
For convenience, let us suppose that x1 and x2 represent angles measured in radians. As shown in Figure 4.6.1(a), let d denote the distance between P(x1) and P(x2). If we place the angle x1 − x2 in standard position as shown in Figure 4.6.1(b), then d is also the distance between P(x1 − x2) and P(0). Equating the squares of these distances gives
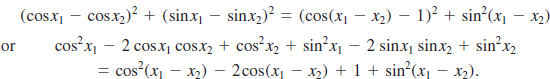
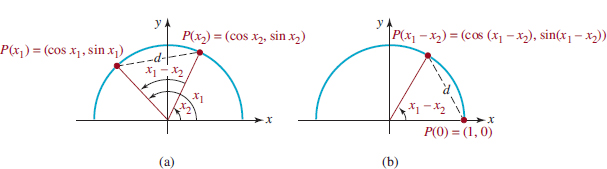
FIGURE 4.6.1 The difference of two angles
In view of (8), of Section 4.4.,
cos2x1 + sin2x1 = 1, cos2x2 + sin2x2 = 1, cos2(x1 − x2) + sin2(x1 − x2) = 1,
and so the preceding equation simplifies to
cos(x1 − x2) = cosx1 cosx2 + sinx1 sinx2.
This last result can be put to work immediately to find the cosine of the sum of two angles. Since x1 + x2 can be rewritten as the difference x1 − (−x2),
![]()
By the even–odd identities, cos(−x2) = cos x2 and sin(−x2) = −sin x2, it follows that the last line is the same as
cos(x1 + x2) = cosx1 cosx2 − sinx1sinx2.
The two results just obtained are summarized in the next theorem.
THEOREM 4.6.1 Sum and Difference Formulas for the Cosine
For all real numbers x1 and x2,
![]()
EXAMPLE 1 Cosine of a Sum
Evaluate cos(7π⁄12).
Solution We have no way of evaluating cos(7π⁄12) directly. However, observe that
![]()
Because 7p/12 radians is a second-quadrant angle, we know that the value of cos(7π⁄12) is negative. Proceeding, the sum formula (1) of the Theorem 4.6.1 gives

Using ![]() this result can also be written as cos(7π⁄12) =
this result can also be written as cos(7π⁄12) = ![]() Since
Since ![]() we see that cos(7π⁄12) < 0, as expected.
we see that cos(7π⁄12) < 0, as expected.
To obtain the corresponding sum/difference identities for the sine function we will make use of two identities:
![]()
![]() See (5) in Section 4.3.
See (5) in Section 4.3.
These identities were first discovered in Section 4.3. by shifting the graphs of the cosine and sine. However, both results in (3) can now be proved using (2):
Now from the first equation in (3), the sine of the sum x1 + x2 can be written
The last line is traditionally written as
sin(x1 + x2) = sinx1cosx2 + cosx1sinx2.
To obtain the sine of the difference x1 − x2, we use again cos(−x2) = cosx2 and sin(−x2) = −sinx2:
![]()
THEOREM 4.6.2 Sum and Difference Formulas for the Sine
For all real numbers x1 and x2,
![]()
EXAMPLE 2 Sine of a Sum
Evaluate sin(7π⁄12).
Solution We proceed as in Example 1, except we use the sum formula (4) of Theorem 4.6.2:
As in Example 1, the result can be rewritten as sin(7π⁄12) = ![]()
Since we know the value of cos(7π⁄12) from Example 1, we can also compute the value of sin(7π⁄12) using the Pythagorean identity (8) of Section 4.4.:
![]()
We solve for sin(7π⁄12) and take the positive square root:
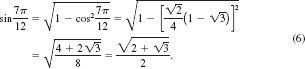
Although the number in (6) does not look like the result obtained in Example 2, the values are the same. See Problem 72 in Exercises 4.6.
There are sum and difference formulas for the tangent function as well. We can derive the sum formula using the sum formulas for the sine and cosine as follows:
![]()
We now divide the numerator and denominator of (7) by cosx1cosx2 (assuming that x1 and x2 are such that cosx1cosx2 ≠ 0),
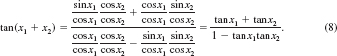
The derivation of the difference formula for tan(x1 − x2) is obtained in a similar manner. We summarize the two results.
THEOREM 4.6.3 Sum and Difference Formulas for the Tangent
For real numbers x1 and x2 for which the functions are defined,

EXAMPLE 3 Tangent of a Difference
Evaluate tan(π⁄12).
Solution If we think of π⁄12 as an angle in radians, then
![]()
It follows from formula (10) of Theorem 4.6.3:
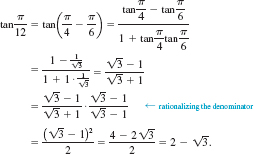
![]() You should rework this example using π/12 = π⁄3 − π/4 to see that the result is the same.
You should rework this example using π/12 = π⁄3 − π/4 to see that the result is the same.
Strictly speaking, we really do not need the identities for tan(x1 ± x2), since we can always compute sin(x1 ± x2) and cos(x1 ± x2) using (1), (2), (4), (5) and then proceed as in (7), that is, form the quotient sin(x1 ± x2)/cos(x1 ± x2).
![]() Double-Angle Formulas Many useful trigonometric formulas can be derived from the sum and difference formulas. The double-angle formulas for the cosine and sine functions express the cosine and sine of 2x in terms of the cosine and sine of x.
Double-Angle Formulas Many useful trigonometric formulas can be derived from the sum and difference formulas. The double-angle formulas for the cosine and sine functions express the cosine and sine of 2x in terms of the cosine and sine of x.
If we set x1 = x2 = x in (1) and use cos(x + x) = cos2x, then
cos2x = cosxcosx − sinxsinx = cos2x − sin2x.
Similarly, by setting x1 = x2 = x in (4) and using sin(x + x) = sin2x, then
![]()
We summarize the last two results along with the double-angle formula for the tangent function.
THEOREM 4.6.4 Double-Angle Formulas
For any real number x,
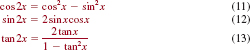
EXAMPLE 4 Using the Double-Angle Formulas
If ![]() find the exact values of cos2x and sin2x.
find the exact values of cos2x and sin2x.
Solution First, we compute cosx using sin2x + cos2x = 1. Since π, < x, < 3π⁄2, cosx, < 0, and so we choose the negative square root:
![]()
From the double-angle formula (11) of Theorem 4.6.4,
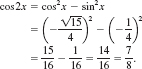
Finally, from the double-angle formula (12),
![]()
The formula in (11) has two useful alternative forms. By (8) of Section 4.4., we know that sin2x = 1 − cos2x. Substituting the last expression into (11) yields cos 2x = cos2x − (1 − cos2x) or
![]()
On the other hand, if we substitute cos2x = 1 2 sin2x into (11) we get
![]()
![]() Half-Angle Formulas The alternative forms (14) and (15) of the double-angle formula (11) are the source of two half-angle formulas. Solving (14) and (15) for cos2 x and sin2x gives, respectively,
Half-Angle Formulas The alternative forms (14) and (15) of the double-angle formula (11) are the source of two half-angle formulas. Solving (14) and (15) for cos2 x and sin2x gives, respectively,
![]()
By replacing the symbol x in (16) by x/2 and using 2(x/2) = x, we obtain the half-angle formulas for the cosine and sine functions.
THEOREM 4.6.5 Half-Angle Formulas
For any real number x,
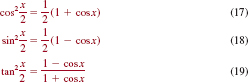
EXAMPLE 5 Using the Half-Angle Formulas
Find the exact values of cos(5π/8) and sin(5π/8).
Solution If we let x = 5π⁄4, then x/2 = 5π/8 and formulas (17) and (18) of Theorem 4.6.5 yield, respectively,
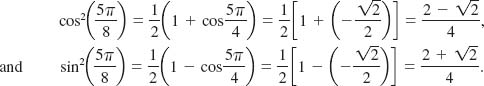
Because 5π/8 radians is a second-quadrant angle, cos(5π/8) <, 0 and sin(5π/8) > 0. Therefore, we take the negative square root for the value of the cosine,
![]()
and the positive square root for the value of the sine,
![]()
If want the exact value of, say, tan(5π/8) we can use the results of Example = or formula (19) with x = 5π⁄4. Either way, the result is the same
![]()
NOTES FROM THE CLASSROOM
(i) Should you memorize all the identities presented in this section? You should consult your instructor about this, but in the opinion of the authors, you should at the very least memorize formulas (1), (2), (4), (5), (11) and (12).
(ii) When you enroll in a calculus course, check the title of your text. If it has the words Early Transcendentals in its title, then your knowledge of the graphs and properties of the trigonometric functions will come into play almost immediately.
(iii) As discussed in Sections 2.9 and 3.7, the principal topics of study in calculus are derivatives and integrals of functions. The sum identities (1) and (4) are used to find the derivatives of sin x and cos x. See Section 4.11.. Identities are especially useful in integral calculus. Replacing a radical by a trigonometric function as illustrated in Example 7 of Section 4.5. is a standard technique for evaluating some types of integrals. Also, to evaluate integrals of cos2 x and sin2 x you would use the half-angle formulas in the form given in (16):
![]()
At some point in your study of integral calculus you may be required to evaluate integrals of products such as
sin2xsin5x and sin10xcos4x.
One way of doing this is to use the sum/difference formulas to devise an identity that converts these products into either a sum of sines or a sum of cosines. This will be the topic of discussion in the next section.
4.6 Exercises Answers to selected odd-numbered problems begin on page ANS–14.
In Problems 1–22, use a sum or difference formula to find the exact value of the given trigonometric function. Do not use a calculator.
1. ![]()
2. ![]()
3. sin 75°
4. cos 75°
5. ![]()
6. ![]()
7. ![]()
8. ![]()
9. ![]()
10. ![]()
11. ![]()
12. ![]()
13. cos 165°
14. sin 165°
15. tan 195°
16. cos 195°
17. sin 195°
18. tan 195°
19. cos 345°
20. sin 345°
21. ![]()
22. ![]()
In Problems 23–28, use a double-angle formula to write the given expression as a single trigonometric function of twice the angle.
23. 2cosβsinβ
24. cos22t − sin2 2t
25. ![]()
26. ![]()
27. ![]()
28. ![]()
In Problems 29–34, use the given information to find (a) cos 2x, (b) sin 2x, and (c) tan 2x.
29. ![]()
30. ![]()
31. ![]()
32. cscx = −3, π<x <3π/2
33. ![]()
34. ![]()
In Problems 35–44, use a half-angle formula to find the exact value of the given trigonometric function. Do not use a calculator.
35. cos(π⁄12)
36. sin(π/8)
37. sin(3π/8)
38. tan(π⁄12)
39. cos67.5°
40. sin15°
41. tan105°
42. cot157.5°
43. csc(13π/12)
44. sec(−3π/8)
In Problems 45–50, use the given information to find (a) cos(x/2), (b) sin(x/2), and (c) tan(x/2).
45. ![]()
46. ![]()
47. tan x = 2,π<x <3π/2
48. cscx = 9, 0, < x, π⁄2
49. ![]()
50. ![]()
In Problems 51–60, verify the given identity.
51. cos 3x = 4 cos3x = 4cos3x−3 cosx
53. sin 4x = 4 cosx(sin3 x−2sinx)
52. (sinx+cosx)2 = 1+sin 2x
54. cos 2x = cos4x−sin4x
55. ![]()
56. ![]()
57. ![]()
58. ![]()
59. ![]()
60. ![]()
In Problems 61–64, rewrite the given function as a single trigonometric function involving no products or squares. Give the amplitude and period of the function.
61. y = 4 cos2x−2
62. y = sin(x/2)cos(x/2)
63. y = 2 sin 2xcos 2x
64. y = 5 cos 2 4x−5 sin 2 4x
65. If P(x1) and P(x2) are points in quadrant II on the terminal side of the angles x1and x2, respectively, with cosx1 = ![]() and sinx2 =
and sinx2 = ![]() , find (a) sin(x1 + x2), (b) cos(x1 + x2), (c) sin(x1 − x2), and (d) cos(x1 − x2).
, find (a) sin(x1 + x2), (b) cos(x1 + x2), (c) sin(x1 − x2), and (d) cos(x1 − x2).
66. If x1 is a quadrant II angle, x2 is a quadrant III angle, sinx1 = ![]() , and tanx2 =
, and tanx2 = ![]() find (a) sin(x1 + x2), (b) sin(x1 − x2), (c) cos(x1 + x2), and (d) cos(x1 − x2).
find (a) sin(x1 + x2), (b) sin(x1 − x2), (c) cos(x1 + x2), and (d) cos(x1 − x2).
Miscellaneous Applications
67. Mach Number The ratio of the speed of an airplane to the speed of sound is called the Mach number M of the plane. If M > 1, the plane makes sound waves that form a (moving) cone, as shown in FIGURE 4.6.2. A sonic boom is heard at the intersection of the cone with the ground. If the vertex angle of the cone is θ, then
![]()
If θ = π⁄6, find the exact value of the Mach number.

FIGURE 4.6.2 Airplane in Problem 67
68. Cardiovascular Branching A mathematical model for blood flow in a large blood vessel predicts that the optimal values of the angles u1 and u2, which represent the (positive) angles of the smaller daughter branches (vessels) with respect to the axis of the parent branch, are given by
![]()
where A0 is the cross-sectional area of the parent branch and A1and A2 are the cross-sectional areas of the daughter branches. See FIGURE 4.6.3. Let Ψ = θ1 + θ2be the junction angle, as shown in the figure.

FIGURE 4.6.3 Branching of a large blood vessel in Problem 68
(a) Show that
![]()
(b) Show that for the optimal values of θ1 and θ2, the cross-sectional area of the daughter branches, A1 + A2, is greater than or equal to that of the parent branch. Therefore, the blood must slow down in the daughter branches.
69. Area of a Triangle Show that the area of an isosceles triangle with equal sides of length x is
![]()
where θ is the angle formed by the two equal sides. See FIGURE 4.6.4. [Hint: Consider θ/2 as shown in the figure.]

FIGURE 4.6.4 Isosceles triangle in Problem 69
70. Putting the Shot If a projectile, such as a shot put, is released from a height h, upward at an angle ø with velocity v0, the range R at which it strikes the ground is given by
![]()
where g is the acceleration due to gravity. See FIGURE 4.6.5. It can be shown that the maximum range Rmax is achieved if the angle f satisfies the equation
![]()
Show that
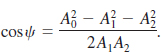
by using the expressions for R and cos2ω and the half-angle formulas for the sine and the cosine with t = 2f.

FIGURE 4.6.5 Projectile in Problem 70
For Discussion
71. Discuss: Why would you expect to get an error message from your calculator when you try to evaluate
![]()
72. In Example 2 we showed that sin(7π⁄12) = ![]() Following the example, we then showed that sin(7π⁄12) =
Following the example, we then showed that sin(7π⁄12) = ![]() Demonstrate that these two answers are equivalent.
Demonstrate that these two answers are equivalent.
73. Discuss: How would you find a formula that expresses sin3θ in terms of sinθ? Carry out your ideas.
74. In Problem 65, in what quadrants do P(x1 + x2) and P(x1 − x2) lie?
75. In Problem 66, in which quadrant does the terminal side of x1 + x2 lie? The terminal side of x1 − x2?
Introduction There are instances, especially in integral calculus, where it is necessary to convert a product of sine and cosine functions to a sum of these functions. Moreover, in solving trigonometric equations we may find it convenient to convert a sum of sine and cosine functions into a product of these functions. In the discussion that follows we establish trigonometric identities or formulas that do the job.
![]() Reduction of a Product to a Sum The product-to-sum formulas given in the next theorem are direct consequences of the sum and difference formulas for the cosine and sine functions in Section 4.6.
Reduction of a Product to a Sum The product-to-sum formulas given in the next theorem are direct consequences of the sum and difference formulas for the cosine and sine functions in Section 4.6.
THEOREM 4.7.1 Product-to-Sum Formulas
For all real number x1 and x2,
![]()
PROOF: To prove (1), we use (1) and (2) of Theorem 4.6.1:
![]()
Subtracting (5) from (4) yields
cos(x1 − x2) − cos(x1 − x2) = 2sinx1sinx2.
And so,
![]()
which is (1). Similarly, by adding (4) and (5) we get
cos(x1 − x2) + cos(x1 + x2) = 2cosx1cosx2,
which in turn, yields formula (2):
![]()
Formula (3) follows analogously by adding the sum and difference formulas for the sine, (4) and (5) in Theorem 4.6.2 of Section 4.6..
Although we do not feel that it is necessary to memorize (1)–(3) in Theorem 4.7.1, you should listen to what your instructor requires. By remembering the procedure just illustrated in the proof of Theorem 4.7.1 each of these formulas can be derived on the spot.
EXAMPLE 1 Using (2) of Theorem 4.7.1
Use a product-to-sum formula to rewrite the product cos2θ cos3θ as a sum.
Solution From formula (2) of Theorem 4.7.1 with the identifications x1 = 2θ and x2 = 3θ, we obtain
![]()
EXAMPLE 2 Using (3) of Theorem 4.7.1
Use a product-to-sum formula to find the exact value of the product sin45°cos15°.
Solution Using formula (3) of Theorem 4.7.1 with x1 = 45° and x2 = 15°, we have
![]()
Because ![]() we observe that the exact value of the given product is
we observe that the exact value of the given product is
![]()
![]() Reduction of a Sum to a Product The results in Theorem 4.7.1 can now be used to derive the sum-to-product formulas.
Reduction of a Sum to a Product The results in Theorem 4.7.1 can now be used to derive the sum-to-product formulas.
THEOREM 4.7.2 Sum-to-Product Formulas
For all real number x1 and x2,
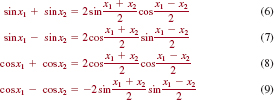
PROOF: By replacing, in turn, the symbols x1 and x2 in (1) of Theorem 4.7.1 by
![]()
we get
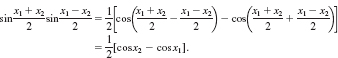
Multiplying the last expression by 22 yields
![]()
which is the formula (9). In a similar manner, each of the remaining product-to-sum formulas together with the substitutions in (10) yields one of the sum-to-product formulas.
EXAMPLE 3 Using (9) of Theorem 4.7.2
Use a sum-to-product formula to rewrite the sum cost − cos5t as a product.
Solution We use formula (9) of Theorem 4.7.2 with x1 = t and x2 = 5t:
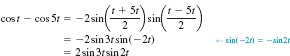
EXAMPLE 4 Using (6) of Theorem 4.7.2
Use a sum-to-product formula to find the exact value of the sum sin75° 1 sin15°.
Solution In this case we use formula (6) of Theorem 4.7.2 with x1 = 75° and x2 = 15°:
![]()
Because sin45° = ![]() and cos30° =
and cos30° = ![]() the exact value of the given sum
the exact value of the given sum
![]()
4.7 Exercises Answers to selected odd-numbered problems begin on page ANS–14.
In Problems 1–12, use a product-to-sum formula in Theorem 4.7.1 to write the given product as a sum of cosines or a sum of sines.
1. cos4θ cos3θ
2. ![]()
3. sin2x sin5x
4. sin10x cos4x
5. ![]()
6. −sint sin2t
7. sin8xcos12x
8. sinπθ cos7πθ
9. 2cos3βsinβ
10. 6sinαsin4α
11. ![]()
12. ![]()
In Problems 13–18, use a product-to-sum formula to find the exact value of the expression. Do not use a calculator.
13. ![]()
14. ![]()
15. sin75°sin15°
16. cos15° cos45°
17. sin97.5° sin52.5°
18. sin105°cos195°
In Problems 19–30, use a sum-to-product-formula in Theorem 4.7.2 to write the given sum as a product of cosines, a product of sines, or a product of a sine and a cosine.
19. siny − sin5y
20. cos3θ − cosθ
21. ![]()
22. ![]()
23. cos2x + cos6x
24. sin5t + sin3t
25. sinω1t + sinω2t
26. ![]()
27. ![]()
28. sin(θ+π)+sin(θ−π)
29. ![]()
30. ![]()
In Problems 31–36, use a sum-to-product-formula to find the exact value of the expression. Do not use a calculator.
31. ![]()
32. ![]()
33. cos 105°−cos 15°
34. cos 15°+cos 75°
35. sin195° + sin105°
36. 2cos195° − 2cos105°
Miscellaneous Applications
37.Sound Wave A note produced by a certain musical instrument results in a sound wave described by
f(t) = 0.03sin500πt + 0.03sin1000πt,
where f(t) is the difference between atmospheric pressure and air pressure in dynes per square centimeter at the eardrum after t seconds. Express f as the product of a sine and a cosine function.
38. Beats If two piano wires struck by the same key are slightly out of tune, the difference between the atmospheric pressure and air pressure at the eardrum can be represented by the function
f(t) = acos2πb1t + acos2πb2t,
where the value of the constant b1 is close to the value of constant b2. The variations in loudness that occur are called beats. See FIGURE 4.7.1. The two strings can be tuned to the same frequency by tightening one of them while sounding both until the beats disappear.
(a) Use a sum formula to write f(t) as a product.
(b) Show that f(t)can be considered a cosine function with period 2/(b1 + b2) and variable amplitude 2acosπ(b1 − b2)t.
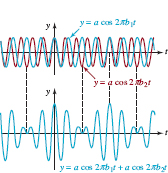
FIGURE 4.7.1 Graph for Problem 38
(c) Use a graphing utility to obtain the graph of f in the case
2πb1 = 5, 2πb2 = 4, and a = ![]() .
.
39. Alternating Current The term sinωtsin(φt + ω) is encountered in the deriva tion of an expression for the power in an alternating-current circuit. Show that this term can be written as ![]() [cosω 2 cos(2ωt + ω)].
[cosω 2 cos(2ωt + ω)].
For Discussion
40. If x1 + x2 + x3 = π, then show that
sin2x1 + sin2x2 + sin2x3 = 4sinx1sinx2sinx3.
41. Write as a product of cosines: 1 + cos2t + cos4t + cos6t.
42. Simplify: 2cos2t cost − cos3t.
Introduction Although we can find the values of the trigonometric functions of real numbers or angles, in many applications we must do the reverse: Given the value of a trigonometric function, find a corresponding angle or number. This suggests we consider inverse trigonometric functions. Before we define the inverse trigonometric functions, let’s recall from Section 2.7. some of the properties of a one-to-one function f and its inverse f−1.
![]() Properties of Inverse Functions If y = f(x) is a one-to-one function, then there is a unique inverse function f −1 with the following properties:
Properties of Inverse Functions If y = f(x) is a one-to-one function, then there is a unique inverse function f −1 with the following properties:
![]() Recall, a function f is one-to-one if every y in its range corresponds to exactly one x in its domain.
Recall, a function f is one-to-one if every y in its range corresponds to exactly one x in its domain.
Inspection of the graphs of the various trigonometric functions clearly shows that none of these functions are one-to-one. In Section 2.7. we discussed the fact that if a function f is not one-to-one, it may be possible to restrict the function to a portion of its domain where it is one-to-one. Then we can define an inverse for f on that restricted domain. Normally, when we restrict the domain, we make sure to preserve the entire range of the original function.
![]() See Example 8 in Section 2.7.
See Example 8 in Section 2.7.
![]() Arcsine Function From Figure 4.8.1(a) we see that the function y = sin x on the closed interval [2π/2, π⁄2] takes on all values in its range [−1, 1]. Notice that any horizontal line drawn to intersect the red portion of the graph can do so at most once. Thus the sine function on this restricted domain is one-to-one and has an inverse. There are two commonly used notations to denote the inverse of the function shown in Figure 4.8.1(b):
Arcsine Function From Figure 4.8.1(a) we see that the function y = sin x on the closed interval [2π/2, π⁄2] takes on all values in its range [−1, 1]. Notice that any horizontal line drawn to intersect the red portion of the graph can do so at most once. Thus the sine function on this restricted domain is one-to-one and has an inverse. There are two commonly used notations to denote the inverse of the function shown in Figure 4.8.1(b):
arcsin x or sin−1x,
and are read arcsine of x and inverse sine of x, respectively.

FIGURE 4.8.1 Restricting the domain of y = sin x to produce a one-to-one function
In FIGURE 4.8.2(a) we have reflected the portion of the graph of y = sin x on the interval [−π/2, π⁄2] (the red graph in Figure 4.8.1(b)) about the line y = x to obtain the graph of y = arcsin x (in blue). For clarity, we have reproduced this blue graph in Figure 4.8.2(b). As this curve shows, the domain of the arcsine function is [−1, 1] and the range is [−π/2, π⁄2].
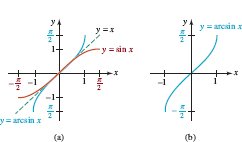
FIGURE 4.8.2 Graph of y = arcsin x is the blue curve
DEFINITION 4.8.1 Arccosine Function
The arcsine function, or inverse sine function, is defined by
y = arcsin x if and only if x = sin y,
where −1 ≤ x ≤1 and −π/2 ≤ y ≤π⁄2.
In other words:
The arcsine of the number x is that number y (or radian-measured angle) between 2p/2 and p/2 whose sine is x.
When using the notation sin− 1x it is important to realize that “–1” is not an exponent; rather, it denotes an inverse function. The notation arcsinx has an advantage over the notation sin−1x in that there is no “ − 1” and hence no potential for misinterpretation; moreover, the prefix “arc” refers to an angle—the angle whose sine is x. But since y = arcsinx and y = sin−1x are used interchangeably in calculus and in applications, we will continue to alternate their use so that you become comfortable with both notations.
![]() Note of Caution:
Note of Caution: ![]()
EXAMPLE 1 Evaluating the Inverse Sine Function
Find (a) arcsin ![]() , (b) sin −1(−
, (b) sin −1(−![]() ), and (c) sin−1(−1).
), and (c) sin−1(−1).
Solution (a) If we let y = arcsin ![]() then by (1) we must find the number y (or radian measured angle) that satisfies sin y =
then by (1) we must find the number y (or radian measured angle) that satisfies sin y = ![]() and −π/2 ≤ y ≤π⁄2. Since sin (π⁄6) =
and −π/2 ≤ y ≤π⁄2. Since sin (π⁄6) = ![]() and π⁄6. satisfies the inequality −π/2 ≤ y ≥ π/2 it follows that y = π/6.
and π⁄6. satisfies the inequality −π/2 ≤ y ≥ π/2 it follows that y = π/6.
(b) if we let y = sin−2 (−![]() ), then sin y = −
), then sin y = −![]() . Since we must choose y such that and π⁄6 satisfies the inequality 2π/2 ≤ y
. Since we must choose y such that and π⁄6 satisfies the inequality 2π/2 ≤ y
(c) Letting y = sin−1(−1), we have that sin y = −1 and −π/2 ≤ y ≤π/2.
Hence y = 2π/2.
In parts (b) and (c) of Example 1 we were careful to choose y so that −π/2 ≤ y ≤π⁄2. For example, it is a common error to think that because sin(3π⁄2) = −1, then necessarily sin−1(−1) can be taken to be 3π⁄2. Remember: If y = sin−1x, then y is subject to the restriction −π/2 ≤ y ≤π⁄2 and 3π⁄2 does not satisfy this inequality.
![]() Read this paragraph several times.
Read this paragraph several times.
EXAMPLE 2 Evaluating a Composition
Without using a calculator, find tan![]()
Solution We must find the tangent of the angle of t radians with sine equal to ![]() , that is, tan t, where t =
, that is, tan t, where t = ![]() The angle t is shown in FIGURE 4.8.3. Since
The angle t is shown in FIGURE 4.8.3. Since
![]()
we want to determine the value of cos t. From Figure 4.8.3 and the Pythagorean identity sin2t + cos2t = 1, we see that
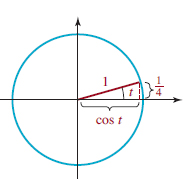
FIGURE 4.8.3 The angle t = sin−1 ![]() in Example 2
in Example 2
Hence we have

and so
![]()
![]() Arccosine Function If we restrict the domain of the cosine function to the closed interval [0, π], the resulting function is one-to-one and thus has an inverse. We denote this inverse by
Arccosine Function If we restrict the domain of the cosine function to the closed interval [0, π], the resulting function is one-to-one and thus has an inverse. We denote this inverse by
arccosx or cos−1x,
which gives us the following definition.
DEFINITION 4.8.2 Arccosine Function
The arccosine function, or inverse cosine function, is defined by
![]()
where −1 ≤ x ≤1 and 0 ≤ y
The graphs shown in FIGURE 4.8.4 illustrate how the function y = cos x restricted to the interval [0, π] becomes a one-to-one function. The inverse of the function shown in Figure 7.5.4(b) is y = arccosx.
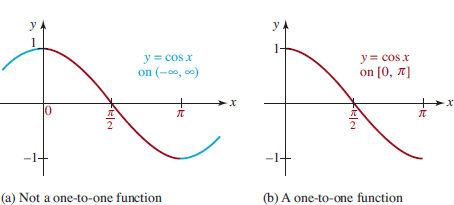
FIGURE 4.8.4 Restricting the domain of y = cos x to produce a one-to-one function
By reflecting the graph of the one-to-one function in Figure 4.8.4(b) in the line y = x we obtain the graph of y = arccos x shown in FIGURE 4.8.5.
Note that the figure clearly shows that the domain and range of y = arccosx are [−1, 1] and [0, π], respectively.
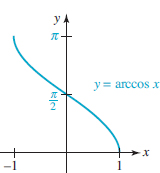
FIGURE 4.8.5 Graph of y = arccosx

FIGURE 4.8.6 The angle t = cos−1x in Example 4
EXAMPLE 3 Evaluating the Inverse Cosine Function
Find (a) arccos ![]() (b)
(b) ![]()
Solution (a) If we let y = arccos ![]() , then cos y =
, then cos y = ![]() and 0 ≤ y ≤π. Thus y = π⁄4.
and 0 ≤ y ≤π. Thus y = π⁄4.
(b) Letting y = cos−1![]() , we have that cos y =
, we have that cos y = ![]() , and we must find y such that 0 ≤ y ≤p. Therefore, y = 5π⁄6 since cos (5π⁄6) =
, and we must find y such that 0 ≤ y ≤p. Therefore, y = 5π⁄6 since cos (5π⁄6) = ![]()
EXAMPLE 4 Evaluating the Compositions of Functions
Write sin(cos−1x) as an algebraic expression in x.
Solution In FIGURE 4.8.6 we have constructed an angle of t radians with cosine equal to x. Then t = cos−1x, or x = cos t, where 0 ≤ t ≤π. Now to find sin (cos−1x) = sin t, we use the identity sin2t + cos2t = 1. Thus

We use the positive square root of 1 − x2, since the range of cos−1x is [0, π], and the sine of an angle t in the first or second quadrant is positive.
![]() Arctangent Function If we restrict the domain of tanx to the open interval (2π/2, π/2), then the resulting function is one-to-one and thus has an inverse. This inverse is denoted by
Arctangent Function If we restrict the domain of tanx to the open interval (2π/2, π/2), then the resulting function is one-to-one and thus has an inverse. This inverse is denoted by
arctan x or tan−1x.
DEFINITION 4.8.3 Arctangent Function
The arctangent, or inverse tangent, function is defined by
y = arctan x if and only if x − tan y,
where 2∞, <x, < ∞ and −π/2, <y, <π/2.
The graphs shown in FIGURE 4.8.7 illustrate how the function y − tan x restricted to the open interval (−π/2, π/2) becomes a one-to-one function.
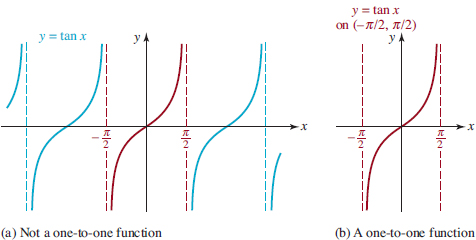
FIGURE 4.8.7 Restricting the domain of y − tan x to produce a one-to-one function
By reflecting the graph of the one-to-one function in Figure 4.8.7(b) in the line y − x we obtain the graph of y − arctan x shown in FIGURE 4.8.8. We see in the figure that the domain and range of y − arctan x are, in turn, the intervals (−∞, ∞) and (−π/2, π/2).
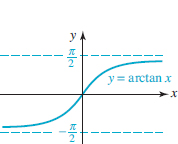
FIGURE 4.8.8 Graph of y − arctan x
EXAMPLE 5 Evaluating the Inverse Tangent Function
Find tan−1(21).
Solution If tan−1(−1) = y, then tan y = −1, where −π/2 < < y< π/2. It follows that tan−1 = −π/4.
EXAMPLE 6 Evaluating the Compositions of Functions
Without using a calculator, find sin ![]()
Solution If we let t − arctan![]() , then tan t −
, then tan t − ![]() . The Pythagorean identity 1 + tan2t − sec2t can be used to find sect:
. The Pythagorean identity 1 + tan2t − sec2t can be used to find sect:
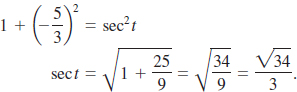
In the preceding line we take the positive square root because t − arctan![]() is in the interval (−π/2, π/2) (the range of the arctangent function) and the secant of an angle t in the first or fourth quadrant is positive. Also, from sec t −
is in the interval (−π/2, π/2) (the range of the arctangent function) and the secant of an angle t in the first or fourth quadrant is positive. Also, from sec t − ![]() we find the value of cos t from the reciprocal identity:
we find the value of cos t from the reciprocal identity:

Finally, we can use the identity tan t − sin t/cos t in the form sin t − tan tcos t to compute sin ![]() It follows that
It follows that
![]()
![]() Properties of the Inverses Recall from Section 2.7. that f−1( f(x)) = x and f( f−1 (x ) ) = x hold for any function f and its inverse under suitable restrictions on x. Thus for the inverse trigonometric functions, we have the following properties.
Properties of the Inverses Recall from Section 2.7. that f−1( f(x)) = x and f( f−1 (x ) ) = x hold for any function f and its inverse under suitable restrictions on x. Thus for the inverse trigonometric functions, we have the following properties.
THEOREM 4.8.1 Properties of Inverse Trigonometric Functions
(i) arcsin(sinx) − sin−1(sin x) = x if −π/2 ≤ x ≤ π/2
(ii) sin(arcsin x) = sin(sin−1x) = x if −1 ≤ x ≤ 1
(iii) arccos(cos x) = cos−1(cosx) = x if 0≤x≤π
(iv) cos(arccos x) = cos(cos−1x) = x if −1 ≤ x ≤ 1
(v) arctan(tan x) = tan−1(tan x) = x if −π/2, x, π/2
(vi) tan(arctan x) = tan(tan−1x) = x if −∞, x, ∞
EXAMPLE 7 Using the Inverse Properties
Without using a calculator, evaluate:
(a) ![]() (b)
(b) ![]() (c)
(c) ![]()
Solution In each case we use the properties of the inverse trigonometric functions given in Theorem 4.8.1.
(a) Because π/12 satisfies −π/2 ≤ x ≤ π/2 it follows from property (i) that
![]()
(b) By property (iv), cos ![]()
(c) In this case we cannot apply property (v), since 3π/4 is not in the interval (−π/2, π/2). If we first evaluate tan(3π/4) = −1, then we have
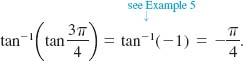
In the next section we illustrate how inverse trigonometric functions can be used to solve trigonometric equations.
![]() Postscript−The Other Inverse Trig Functions The functions cot x, sec x, and csc x also have inverses when their domains are suitably restricted. See Problems 49–51 in Exercises 4.8. Because these functions are not used as often as arctan, arccos, and arc-sin, most scientific calculators do not have keys for them. However, any calculator that computes arcsin, arccos, and arctan can be used to obtain values for arccsc, arcsec, and arccot. Unlike the fact that sec x ≠ 1/cos x, we note that sec−1x − 1/cos−1x; rather, sec−1x − cos−1(1/x) for | x | > 1. Similar relationships hold for csc−1x and cot−1 x. See Problems 56–58 in Exercises 4.8.
Postscript−The Other Inverse Trig Functions The functions cot x, sec x, and csc x also have inverses when their domains are suitably restricted. See Problems 49–51 in Exercises 4.8. Because these functions are not used as often as arctan, arccos, and arc-sin, most scientific calculators do not have keys for them. However, any calculator that computes arcsin, arccos, and arctan can be used to obtain values for arccsc, arcsec, and arccot. Unlike the fact that sec x ≠ 1/cos x, we note that sec−1x − 1/cos−1x; rather, sec−1x − cos−1(1/x) for | x | > 1. Similar relationships hold for csc−1x and cot−1 x. See Problems 56–58 in Exercises 4.8.
4.8 Exercises Answers to selected odd-numbered problems begin on page ANS-14.
In Problems 1–14, find the exact value of the given trigonometric expression. Do not use a calculator.
1. sin−10
2.![]()
3. arccos(−1)
4.arcsin![]()
5.arccos![]()
6.arctan![]()
7. sin−1![]()
8. cos−1![]()
9. tan−1
10. sin−1![]()
11. arctan
12. arccos![]()
13. sin−1![]()
14. arctan 0
In Problems 15–32, find the exact value of the given trigonometric expression. Do not use a calculator.
15. sin![]()
16. cos![]()
17. tan![]()
18. sin![]()
19. cos(arctan (−2))
20. ![]()
21. csc![]()
22. sec![]()
23. sin![]()
24. cos![]()
25. tan(tan−11.2)
26. sin(arcsin 0.75)
27. arcsin ![]()
28. arcsin ![]()
29. tan−1(tan π)
30. sin−1 ![]()
31. cos−1 ![]()
32. arctan ![]()
In Problems 33–40, write the given expression as an algebraic expression in x.
33. sin(tan−1x)
34. cos(tan−1x)
35. tan(arcsin x)
36. sec(arccos x)
37. cot(sin−1x)
38. cos(sin−1x)
39. csc(arctan x)
40. tan(arccos x)
In Problems 41–48, sketch the graph of the given function.
41. y = arctan | x |
42. y = ![]() − arctan x
− arctan x
43. y = | arcsin x |
44. y = sin−1(x + 1)
45. y = 2cos−1x
46. y = cos−12x
47. y = arccos(x − 1)
48. y = cos(arcsin x)
49. The arccotangent function can be defined by y = arccotx (or y = cot−1x) if and only if x − cot y, where 0, < y, < π. Graph y = arccot x, and give the domain and the range of this function.
50. The arccosecant function can be defined by y = arccsc x(or y = csc−1x) if and only if x − cscy, where −π/2 ≤ y ≤ π/2 and y ≠ 0. Graph y = arccscx, and give the domain and the range of this function.
51. One definition of the arcsecant function is y = arcsec x (or y = sec−1x) if and only if x = secy, where 0 ≤ y ≤ π and y ≠ π/2. (See Problem 52 for an alternative definition.) Graph y = arcsec x, and give the domain and the range of this function.
52. An alternative definition of the arcsecant function can be made by restricting the domain of the secant function to [0, π/2) U [π, 3π/2). Under this restriction, define the arcsecant function. Graph y = arcsec x, and give the domain and the range of this function.
53. Using the definition of the arccotangent function from Problem 49, for what values of x is it true that (a) cot(arccot x) = x and (b) arccot (cot x) = x?
54. Using the definition of the arccosecant function from Problem 50, for what values of x is it true that (a) csc(arccsc x) = x and (b) arccsc(csc x) = x?
55. Using the definition of the arcsecant function from Problem 51, for what values of x is it true that (a) sec(arcsec x) = x and (b) arcsec(sec x) = x?
56. Verify that arccot ![]() for all real numbers x.
for all real numbers x.
57. Verify that arccsc x = arcsin (1/x) for | x | ≥ 1.
58. Verify that arcsec x = arccos (1/x) for | x | ≥ 1.
In Problems 59–64, use the results of Problems 56–58 and a calculator to find the indicated value.
59. cot−1 0.75
60. csc−1(−1.3)
61. arccsc(−1.5)
62. arccot(−0.3)
63. arcsec(−1.2)
64. sec−12.5
Miscellaneous Applications
65. Projectile Motion The departure angle u for a bullet to hit a target at a distance R (assuming that the target and the gun are at the same height) satisfies
![]()
where v0 is the muzzle velocity and g is the acceleration due to gravity. If the target is 800 ft from the gun and the muzzle velocity is 200 ft/s, find the departure angle. Use g − 32 ft/s2. [Hint: There are two solutions.]
66. Olympic Sports For the Olympic event, the hammer throw, it can be shown that the maximum distance is achieved for the release angle u (measured from the horizontal) that satisfies
![]()
where h is the height of the hammer above the ground at release, v0 is the initial velocity, and g is the acceleration due to gravity. For v0 = 13.7 m/s and h − 2.25 m, find the optimal release angle. Use g − 9.81 m/s2.

FIGURE 4.8.9 Banked curve in Problem 67
67. Highway Design In the design of highways and railroads, curves are banked to provide centripetal force for safety. The optimal banking angle u is given by tan θ = v2/Rg, where v is the speed of the vehicle, R is the radius of the curve, and g is the acceleration due to gravity. See FIGURE 4.8.9. As the formula indicates, for a given radius there is no one correct angle for all speeds. Consequently, curves are banked for the average speed of the traffic over them. Find the correct banking angle for a curve of radius 600 ft on a country road where speeds average 30 mi/h. Use g − 32 ft/s2. [Hint: Use consistent units.]
68. Highway Design−Continued If μ is the coefficient of friction between the car and the road, then the maximum velocity vm that a car can travel around a curve without slipping is given by v2m = gRtan (θ 1 tan−1μ), where u is the banking angle of the curve. Find vm for the country road in Problem 67 if μ = 0.26.

Volcanic cone
69. Geology Viewed from the side, a volcanic cinder cone usually looks like an isosceles trapezoid. See FIGURE 4.8.10. Studies of cinder cones less than 50,000 years old indicate that cone height Hco and crater width Wcr are related to the cone width Wco by the equations Hco = 0.18Wco and Wcr = 0.40Wco. If Wco = 1.00, use these equations to determine the base angle ϕ of the trapezoid in Figure 4.8.10.
For Discussion
70. Using a calculator set in radian mode, evaluate arctan (tan 1.8), arccos (cos 1.8), and arcsin (sin 1.8). Explain the results.
71. Using a calculator set in radian mode, evaluate tan−1(tan (−1)), cos−1(cos (−1)), and sin−1(sin (−1)). Explain the results.
72. In Section 4.3. we saw that the graphs of y = sin x and y = cos x are related by shifting and reflecting. Justify the identity
![]()
for all x in [21, 1], by finding a similar relationship between the graphs of y = arcsin x and y = arccos x.
FIGURE 4.8.10 Volcanic cinder cone in Problem 69
73. With a calculator set in radian mode determine which of the following inverse trigonometric evaluations result in an error message: (a) sin−1(−2), (b) cos−1(−2), (c) tan−1(−2). Explain.
74. Discuss: Can any periodic function be one-to-one?
75. Show that ![]() [Hint: See (4) of Section 4.6..]
[Hint: See (4) of Section 4.6..]
Introduction In Section 4.5., 4.6, and 4.7 we considered trigonometric identities, which are equations involving trigonometric functions that are satisfied by all values of the variable for which both sides of the equality are defined. In this section we examine conditional trigonometric equations, that is, equations that are true for only certain values of the variable. We discuss techniques for finding those values of the variable (if any) that satisfy the equation.
We begin by considering the problem of finding all real numbers x that satisfy sin x = ![]() . Interpreted as the x-coordinates of the points of intersection of the graphs of y = sin x and y =
. Interpreted as the x-coordinates of the points of intersection of the graphs of y = sin x and y = ![]() , FIGURE 4.9.1 shows that there exists infinitely many solutions of the equation sin x =
, FIGURE 4.9.1 shows that there exists infinitely many solutions of the equation sin x = ![]() :
:
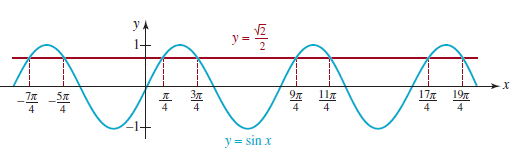
FIGURE 4.9.1 Graphs of y = sin x and y = ![]()
Note that in each of the lists (1) and (2), two successive solutions differ by 2π = 8π/4. This is a consequence of the periodicity of the sine function. It is common for trigonometric equations to have an infinite number of solutions because of the periodicity of the trigonometric functions. In general, to obtain solutions of an equation such as sin x = ![]() , it is more convenient to use a unit circle and reference angles rather than a graph of the trigonometric function. We illustrate this approach in the following example.
, it is more convenient to use a unit circle and reference angles rather than a graph of the trigonometric function. We illustrate this approach in the following example.
EXAMPLE 1 Using the Unit Circle
Find all real numbers x satisfying sin x = ![]()
Solution If sin x = ![]() , the reference angle for x is π/4 radian. Since the value of sinx is positive, the terminal side of the angle x lies in either the first or second quadrant. Thus, as shown in FIGURE 4.9.2, the only solutions between 0 and 2π are
, the reference angle for x is π/4 radian. Since the value of sinx is positive, the terminal side of the angle x lies in either the first or second quadrant. Thus, as shown in FIGURE 4.9.2, the only solutions between 0 and 2π are
![]()
Since the sine function is periodic with period 2p, all of the remaining solutions can be obtained by adding integer multiples of 2π to these solutions. The two solutions are
![]()

FIGURE 4.9.2 Unit circle in Example 1
where n is an integer The numbers that you see in (1) and (2) correspond, respectively, to letting n − −1, n − 0, n − 1, and n − 2 in the first and second formulas in (3).
When we are faced with a more complicated equation, such as
4sin2x − 8sin x + 3 = 0,
the basic approach is to solve for a single trigonometric function (in this case, it would be sin x) by using methods similar to those for solving algebraic equations.
EXAMPLE 2 Solving a Trigonometric Equation by Factoring
Find all solutions of 4sin2x − 8sin x + 3 = 0.
Solution We first observe that this is a quadratic equation in sin x, and that it factors as
(2sin x − 3)(2sin x − 1) = 0.
This implies that either
![]()
The first equation has no solution since | sin x | ≤ 1. As we see in FIGURE 4.9.3 the two angles between 0 and 2π for which sin x equals ![]() are
are
![]()
Therefore, by the periodicity of the sine function, the solutions are
![]()
where n is an integer.
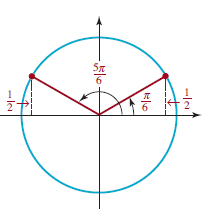
FIGURE 4.9.3 Unit circle in Example 2
EXAMPLE 3 Checking for Lost Solutions
Find all solutions of
sin x = cos x.
Solution In order to work with a single trigonometric function, we divide both sides of the equation by cos x to obtain
tanx−1. (5)
Equation (5) is equivalent to (4) provided that cos x ≠ 0. We observe that if cos x = 0, then as we have seen in Section 4.3., x = (2n + 1)π/2 = π/2 + nπ, for n an integer. By the sum formula for the sine,
we see that these values of x do not satisfy the original equation. Thus we will find all the solutions to (4) by solving equation (5).
Now tan x = 1 implies that the reference angle for x is π/4 radian. Since tan x = 1. > 0, the terminal side of the angle of x radians can lie either in the first or in the third quadrant, as shown in FIGURE 4.9.4. Thus the solutions are
![]()
![]() cos 0 = 1, cos π = −1 cos 2π = 1, cos 3π = π1, and so on. In general cos np = (−1)n, where n is an integer
cos 0 = 1, cos π = −1 cos 2π = 1, cos 3π = π1, and so on. In general cos np = (−1)n, where n is an integer

FIGURE 4.9.4 Unit circle in Example 3
where n is an integer. We can see from Figure 4.9.4 that these two sets of numbers can be written more compactly as
![]()
![]() This also follows from the fact that tanx is p-periodic.
This also follows from the fact that tanx is p-periodic.
where n is an integer.
![]() Losing Solutions When solving an equation, if you divide by an expression containing a variable, you may lose some solutions of the original equation. For example, in algebra a common mistake in solving equations such as x2 = x is to divide by x to obtain x = 1. But by writing x2 = x as x2 − x = 0 or x(x − 1) = 0 we see that in fact x = 0 or x = 1. To prevent the loss of a solution you must determine the values that make the expression zero and check to see whether they are solutions of the original equation. Note that in Example 3, when we divided by cos x, we took care to check that no solutions were lost.
Losing Solutions When solving an equation, if you divide by an expression containing a variable, you may lose some solutions of the original equation. For example, in algebra a common mistake in solving equations such as x2 = x is to divide by x to obtain x = 1. But by writing x2 = x as x2 − x = 0 or x(x − 1) = 0 we see that in fact x = 0 or x = 1. To prevent the loss of a solution you must determine the values that make the expression zero and check to see whether they are solutions of the original equation. Note that in Example 3, when we divided by cos x, we took care to check that no solutions were lost.
Whenever possible, it is preferable to avoid dividing by a variable expression. As illustrated with the algebraic equation x2 = x, this can frequently be accomplished by collecting all nonzero terms on one side of the equation and then factoring (something we could not do in Example 3). Example 4 illustrates this technique.
EXAMPLE 4 Solving a Trigonometric Equation by Factoring
Solve
![]()
Solution To avoid dividing by cos x, we write the equation as
![]()
and factor:
![]()
Thus either
![]()
FIGURE 4.9.5 Unit circle in Example 4
![]() See (12) in Section 4.6..
See (12) in Section 4.6..
Since the cosine is zero for all odd multiples of π/2, the solutions of cos x = 0 are
![]()
where n is an integer.
In the second equation we replace 2sin xcos x by sin 2x from the double-angle formula for the sine function to obtain an equation with a single trigonometric function:
![]()
Thus the reference angle for 2x is π/3. Since the sine is negative, the angle 2x must be in either the third quadrant or the fourth quadrant. As FIGURE 4.9.5 illustrates, either
![]()
Dividing by 2 gives
![]()
Therefore, all solutions of (6) are
![]()
where n is an integer.
In Example 4 had we simplified the equation by dividing by cos x and not checked to see whether the values of x for which cos x = 0 satisfied equation (6), we would have lost the solutions x = π/2 1 nπ, where n is an integer.
EXAMPLE 5 Using a Trigonometric Identity
Solve 3cos2x 2 cos 2x = 1.
Solution We observe that the given equation involves both the cosine of x and the cosine of 2x. Consequently, we use the double-angle formula for the cosine in the form
![]()
to replace the equation by an equivalent equation that involves cos x only. We find that
3cos2x − (2cos2x − 1) = 1 becomes cos2x = 0.
Therefore, cos x = 0, and the solutions are
![]()
where n is an integer.
We are often interested in finding roots of an equation only in a specified interval.
EXAMPLE 6 Using a Trigonometric Identity
Find all solutions of the equation cost − cos5t − 0 in the interval [0, 2π).
Solution In this case it is helpful to use a sum-to-product formula. In Example 3 of Section 4.7. we saw that by identifying x1 5 tand x2 5 5t, (9) of Theorem 4.7.2 gives
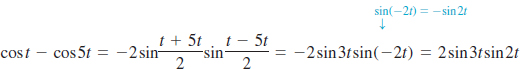
Replacing the sum cost 2 cos5t in the given equation by the product 2sin3t sin2t gives the equivalent equation 2 sin3t sin2t − 0, or
sin3tsin2t − 0.
The last equation is satisfied if either sin3t − 0or sin2t − 0. Then from (1) in Section 4.3. we see that sin3t − 0 implies
![]()
whereas sin2t − 0 implies
![]()
If you think in terms of angles measured in radians and the unit circle, then the only angles satisfying the condition that t be in the interval [0, 2p) correspond to n = 1, 2, 3,4, = in (7) and n = 1,2, 3 in (8):
t − 0, π/3, 2π/3, π, 4π/3, 5π/3,
or
t − π/2, π, 3π/2.
The solution set of the original equation is then the union of the two sets defined by the numbers in (9) and (10), that is
![]()
So far in this section we have viewed the variable in the trigonometric equation as representing either a real number or an angle measured in radians. If the variable represents an angle measured in degrees, the technique for solving is the same.
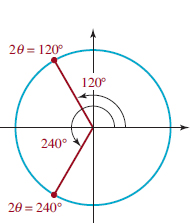
FIGURE 4.9.6 Unit circle in Example 7
EXAMPLE 7 Equation When the Angle Is in Degrees
Solve cos 2θ = − ![]() , where θ is an angle measured in degrees.
, where θ is an angle measured in degrees.
Solution Since cos 2θ = −, the reference angle for 2θ is 60° and the angle 2θ must be in either the second or the third quadrant. FIGURE 4.9.6 illustrates that either 2θ = 120° or 2θ = 240°. Any angle that is coterminal with one of these angles will also satisfy cos 2θ = −![]() . These angles are obtained by adding any integer multiple of 360° to 120° or to 240°:
. These angles are obtained by adding any integer multiple of 360° to 120° or to 240°:
2θ = 120° + 360°n or 2θ = 240° + 360°n,
where n is an integer. Dividing by 2 the last line yields the two solutions
θ = 60° + 180°n and θ = 120° + 180°n.
![]() Extraneous Solutions The next example shows that by squaring a trigonometric equation we may introduce extraneous solutions. In other words, the resulting equation after squaring may not be equivalent to the original.
Extraneous Solutions The next example shows that by squaring a trigonometric equation we may introduce extraneous solutions. In other words, the resulting equation after squaring may not be equivalent to the original.
EXAMPLE 8 Extraneous Roots
Find all solutions of 1 θ tan α = sec α, where a is an angle measured in degrees.
Solution The equation does not factor, but we see that if we square both sides, we can use a fundamental identity to obtain an equation involving a single trigonometric function:
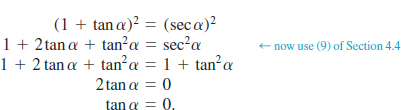
The values of a for 0° ≤ α, 360° at which tan a = 0 are
α = 0° and α = 180°.
Since we squared each side of the original equation, we may have introduced extraneous solutions. Therefore, it is important that we check all solutions in the original equation. Substituting α = 0° into 1 + tan α = seca, we obtain the true statement 1 + 0 = 1. But after substituting α = 180°, we obtain the false statement 1 + 0 = −1. Therefore, 180° is an extraneous solution and α = 0° is the only solution satisfying 0° ≤ α < 360° Thus, all the solutions of the equation are given by
α = 0° + 360°n = 360°n,
where n is an integer. For n ≠ 0, these are the angles that are coterminal with 0°.
Recall from Section 2.1. that to find the x-intercepts of the graph of α function y = f(x) we find the zeros of f, that is, we must solve the equation f(x) = 0. The following example makes use of this fact.
EXAMPLE 9 Intercepts of α Graph
Find the first three x-intercepts of the graph of f(x) = sin 2xcos x on the positive x-axis.
Solution We must solve f(x) = 0, that is, sin 2x cos x = 0. It follows that either sin 2x = 0 or cos x = 0.
From sin 2x = 0, we obtain 2x = nπ, where n is an integer, or x = nπ/2, where n is an integer. From cos x = 0, we find x = π/2 + nπ, where n is an integer. Then for n = 2, x = nπ/2 gives x = π, whereas for n = 0 and n = 1, x = π/2 + nπ gives x = π/2 and x = 3π/2, respectively. Thus the first three x-intercepts on the positive x-axis are (π/2, 0), (π, 0), and (3π/2, 0).
![]() Using Inverse Functions So far all of the trigonometric equations have had solutions that were related by reference angles to the special angles 0, π/6, π/4, π/3, or π/2. If this is not the case, we will see in the next example how to use inverse trigonometric functions and α calculator to find solutions.
Using Inverse Functions So far all of the trigonometric equations have had solutions that were related by reference angles to the special angles 0, π/6, π/4, π/3, or π/2. If this is not the case, we will see in the next example how to use inverse trigonometric functions and α calculator to find solutions.
EXAMPLE 10 Solving Equations Using Inverse Functions
Find the solutions of 4cos2x − 3cos x − 2 = 0 in the interval [0, π].
Solution We recognize that this is α quadratic equation in cosx. Since the left-hand side of the equation does not readily factor, we apply the quadratic formula to obtain
![]()
At this point we can discard the value (3 + ![]() )/8 ≈ 1.18, because cos x cannot be greater than 1. We then use the inverse cosine function (and the aid of α calculator) to solve the remaining equation:
)/8 ≈ 1.18, because cos x cannot be greater than 1. We then use the inverse cosine function (and the aid of α calculator) to solve the remaining equation:
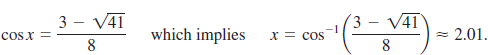
Of course in Example 10, had we attempted to compute cos−1[(3 + ![]() )/8] with α calculator, we would have received an error message.
)/8] with α calculator, we would have received an error message.
4.9 Exercises Answers to selected odd-numbered problems begin on page ANS-15.
In Problems 1-6, find all solutions of the given trigonometric equation if x represents an angle measured in radians.
1. sinx = ![]() /2
/2
2. cosx = − ![]() /2
/2
3. secx = ![]()
4. tanx = − 1
5. cotx = − ![]()
6. cscx = 2
In Problems 7-12, find all solutions of the given trigonometric equation if x represents a real number.
7. cosx = − 1
8. 2sinx = − 1
9. tanx = 0
10. ![]() secx = 2
secx = 2
11. −cscx = 1
12. ![]() cotx = 1
cotx = 1
In Problems 13-18, find all solutions of the given trigonometric equation if θ represents an angle measured in degrees.
13. csc θ = 2![]() /3
/3
14. 2sinθ = ![]()
15. 1 + cotθ = 0
16. ![]() sinθ = cosθ
sinθ = cosθ
17. secθ = −2
18. 2cosθ + ![]() = 0
= 0
In Problems 19–46, find all solutions of the given trigonometric equation if x is α real number and u is an angle measured in degrees.
19. cos2x − 1 = 0
20. 2sin2x − 3 sinx + 1 = 0
21. 3sec2x = secx
22. tan2x + (![]() − 1)tanx −
− 1)tanx − ![]() = 0
= 0
23. 2cos2θ − 3cosθ − 2 = 0
24. 2sin2θ − sinθ − 1 = 0
25. cot2θ + cotθ = 0
26. 2sin2θ + (2 − ![]() )sinθ −
)sinθ − ![]() = 0
= 0
27. cos2x = − 1
28. sec2x = 2
29. 2 sin 3θ = 1
30. tan 4θ = − 1
31. cot(x/2) = 1
32. csc (θ/3) = − 1
33. sin2x + sinx = 0
34. cos2x + sin2x = 1
35. cos2θ = sinθ
36. sin2θ + 2sinθ − 2cosθ = 2
37. sin4x − 2sin2x + 1 = 0
38. tan4θ − 2sec2 θ + 3 = 0
39. secx sin2x = tanx
40. ![]()
41. sin θ + cos θ = 1
42. sinx + cosx = 0
43. ![]()
44. ![]()
45. ![]()
46. ![]()
In Problems 47-52, use a sum-to-product formula (as in Example 6) to solve the given equation on the indicated interval.
47. sin6t − sin4t = 0, [0, 2π)
48. cos2t + cos3t = 0, [0, 2π)
49. cosθ − cos4θ = 0, [2π, π)
50. sin5α + sin3α = 0, [0, 2π)
51. sin7x − sinx − 2sin3x = 0, (−π, π)
52. sinx + cos2x − sin3x = 0, [0, 3π)
In Problems 53–60, find the first three x-intercepts of the graph of the given function on the positive x-axis.
53. f(x) = sin (3x + π)
54. ![]()
55. ![]()
56. f(x) = 1 + cosπx
57. f(x) = sin x + tan x
58. ![]()
59. f(x) = sin x − sin 2x
60. f(x) = cos x + cos 3x
[Hint: Write 3x = x 1 2x.]
In Problems 61–64, by graphing determine whether the given equation has any solutions.
61. tan x = x [Hint: Graph y = tan x and y = x on the same set of axes.]
62. sinx = x
63. cotx − x = 0
64. cosx + x + 1 = 0
In Problems 65–70, using α inverse trigonometric function find the solutions of the given equation in the indicated interval. Round your answers to two decimal places.
65. 20cos2 x + cos x − 1 = 0, [0, π]
66. 3sin2x − 8sinx + 4 = 0, [2θ/2,π/2]
67. tan2 x − tanx − 1 = 0, (2π/2,π/2)
68. 3sin 2x + cos x = 0, [2π/2,π/2]
69. 5cos3x − 3cos2x − cos x = 0, [0, π]
70. tan4x − 3tan2x + 1 = 0, (2π/2,π/2)
Miscellaneous Applications
71. Isosceles Triangle From Problem 69 in Exercises 4.6, the area of the isosceles triangle with vertex angle θ as shown in Figure 4.6.4 is given by A = ![]() x2sinθ. If the length x is 4, what value of θ will give α triangle with area 4?
x2sinθ. If the length x is 4, what value of θ will give α triangle with area 4?
72. Circular Motion An object travels in a circular path centered at the origin with constant angular speed. The y-coordinate of the object at any time t seconds is given by y = 8cos (πt − π/12).At what time(s) does the object cross the x-axis?
73. Mach Number Use Problem 67 in Exercises 4.6 to find the vertex angle of the cone of sound waves made by an airplane flying at Mach 2.
74. Alternating Current An electric generator produces a 60-cycle alternating current given by I(t) = 30sin 120π(t − ![]() ) where I(t) is the current in amperes at t seconds. Find the smallest positive value of t for which the current is 15 amperes.
) where I(t) is the current in amperes at t seconds. Find the smallest positive value of t for which the current is 15 amperes.
75. Electrical Circuits If the voltage given by V = V0sin (ωt + α) is impressed on a series circuit, an alternating current is produced. If V0 = 110 volts, ω = 120π radians per second, and α = 2π/6, when is the voltage equal to zero?
76. Refraction of Light Consider a ray of light passing from one medium (such as air) into another medium (such as α crystal). Let ø be the angle of incidence and θ the angle of refraction. As shown in FIGURE 4.9.7, these angles are measured from a vertical line. According to Snell’s law, there is a constant c that depends on the two mediums, such that ![]() Assume that for light passing from air into a crystal, c = 1.437. Find ø and θ such that the angle of incidence is twice the angle of refraction.
Assume that for light passing from air into a crystal, c = 1.437. Find ø and θ such that the angle of incidence is twice the angle of refraction.
71. Snow Cover On the basis of data collected from 1966 to 1980, the extent of snow cover S in the northern hemisphere, measured in millions of square kilometers, can be modeled by the function
![]()
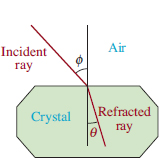
FIGURE 4.9.7 Light rays in Problem 76
where w is the number of weeks past January 1.
(a) How much snow cover does this formula predict for April Fool’s Day? (Round w to the nearest integer.)
(b) In which week does the formula predict the least amount of snow cover?
(c) What month does this fall in?
Introduction Many physical objects vibrate or oscillate in a regular manner, repeatedly moving back and forth over a definite time interval. Some examples are clock pendulums, a mass on a spring, sound waves, strings on a guitar when plucked, the human heart, tides, and alternating current. In this section we will focus on mathematical models of the undamped oscillatory motion of a mass on a spring.
Before proceeding with the main discussion we need to discuss the graph of the sum of constant multiples of cos Bx and sin Bx, that is, y = c1cos Bx + c2sin Bx, where c1 and c2 are constants.
![]() Addition of Two Sinusoidal Functions In Section 4.3. we examined the graphs of horizontally shifted sine and cosine graphs. It turns out that any linear combination of a sine function and a cosine function of the form
Addition of Two Sinusoidal Functions In Section 4.3. we examined the graphs of horizontally shifted sine and cosine graphs. It turns out that any linear combination of a sine function and a cosine function of the form
![]()
where c1 and c2 are constants, can be expressed either as a shifted sine function y = Asin(Bx + φ), B > 0, or as a shifted cosine function y = Acos(Bx + φ). Note that in (1) the sine and cosine functions have the same period 2π/B.
EXAMPLE 1 Addition of α Sine and α Cosine
Graph the function y = cos2x − ![]() sin2x.
sin2x.
Solution Using a graphing utility we have shown in FIGURE 4.10.1 four cycles of the graphs of y = cos2x (in red) and y = −![]() sin 2x (in green). It is apparent in FIGURE 4.10.2 that the period of the sum of these two functions is π, the common period of cos 2x and sin 2x. Also apparent is that the blue graph is a horizontally shifted sine (or cosine) function. Although FIGURE 4.10.2 suggests that the amplitude of the function y = cos 2x −
sin 2x (in green). It is apparent in FIGURE 4.10.2 that the period of the sum of these two functions is π, the common period of cos 2x and sin 2x. Also apparent is that the blue graph is a horizontally shifted sine (or cosine) function. Although FIGURE 4.10.2 suggests that the amplitude of the function y = cos 2x − ![]() sin 2x is 2, the exact phase shift of the graph is certainly is not apparent.
sin 2x is 2, the exact phase shift of the graph is certainly is not apparent.
FIGURE 4.10.1 Superimposed graphs of y = cos2x and y = −![]() sin2x in Example 1
sin2x in Example 1
FIGURE 4.10.2 Graph of the sum y = cos2x − ![]() sin2xin Example 1
sin2xin Example 1
![]() The sine form y = Asin(Bx + φ) is slightly easier to use than the cosine form y = Acos(Bx 4 φ).
The sine form y = Asin(Bx + φ) is slightly easier to use than the cosine form y = Acos(Bx 4 φ).
![]() Reduction to a Sine Function We examine only the reduction of (1) to the form y = Asin(Bx + φ), B > 0.
Reduction to a Sine Function We examine only the reduction of (1) to the form y = Asin(Bx + φ), B > 0.
THEOREM 4.10.1 Reduction of (1) to (2)
For real numbers c1, c2, B, and x,
![]()
where A and φ are defined by
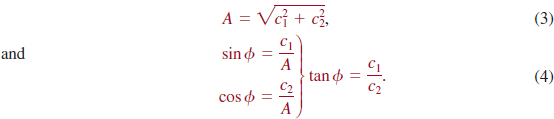
PROOF: To prove (2), we use the sum formula (4) of Section 4.6.:
Asin(Bx 1 φ) = AsinBxcosφ + AcosBxsinφ
= (Asin φ)cos Bx + (Acos φ)sinBx
= c1cosBx + c2sinBx
and identify Asinφ = c1, Acosφ = c2. Thus, ![]()
EXAMPLE 2 Example 1 Revisited
Express y = cos2x − ![]() sin2x as a single sine function.
sin2x as a single sine function.
Solution With the identifications c1 = 1, c2 = −![]() , and B = 2, we have from (3) and (4),
, and B = 2, we have from (3) and (4),
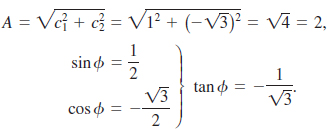
Although tan φ = −1/![]() we cannot blindly assume that φ = tan−1(−1/
we cannot blindly assume that φ = tan−1(−1/![]() ). The angle we take for φ must be consistent with the algebraic signs of sin φ and cos φ. Because sin φ > 0 and cos φ < 0 the terminal side of the angle φ lies in the second quadrant. But since the range of the inverse tangent function is the interval (2π/2, π/2), tan−1(−1/
). The angle we take for φ must be consistent with the algebraic signs of sin φ and cos φ. Because sin φ > 0 and cos φ < 0 the terminal side of the angle φ lies in the second quadrant. But since the range of the inverse tangent function is the interval (2π/2, π/2), tan−1(−1/![]() ) = 2π/6 is a fourth-quadrant angle. The correct angle is found by using the reference angle π/6 for tan−1(−1/
) = 2π/6 is a fourth-quadrant angle. The correct angle is found by using the reference angle π/6 for tan−1(−1/![]() ) to find the second-quadrant angle
) to find the second-quadrant angle
![]()
Therefore y = cos2x − ![]() sin2x can be rewritten as
sin2x can be rewritten as
![]()
Hence the graph of y = cos2x − ![]() sin2x is the graph of y = 2sin2x, which has amplitude 2, period 2π/2 = π, and is shifted 5π/12 units to the left.
sin2x is the graph of y = 2sin2x, which has amplitude 2, period 2π/2 = π, and is shifted 5π/12 units to the left.
![]() Simple Harmonic Motion Consider the motion of a mass on a spring as shown in FIGURE 4.10.3. In the absence of frictional or damping forces, a mathematical model for the displacement (or directed distance) of the mass measured from a position called the equilibrium position is given by the function
Simple Harmonic Motion Consider the motion of a mass on a spring as shown in FIGURE 4.10.3. In the absence of frictional or damping forces, a mathematical model for the displacement (or directed distance) of the mass measured from a position called the equilibrium position is given by the function
![]()
Oscillatory motion modeled by the function (5) is said to be simple harmonic motion. More precisely, we have the following definition.
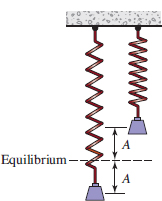
FIGURE 4.10.3 An undamped spring/mass system exhibits simple harmonic motion
DEFINITION 4.10.1 Simple Harmonic Motion
A point moving on a coordinate line whose position at time t is given by
![]()
where A, ω > 0, and φ are constants, is said to exhibit simple harmonic motion.
Special cases of the trigonometric functions in (6) are y(t) = A sin ωt, y(t) = Acos ωt, and y(t) = c1cos ωt + c2sin ωt.
![]() Terminology The function (5) is said to be the equation of motion of the mass. Also, in (5), ω =
Terminology The function (5) is said to be the equation of motion of the mass. Also, in (5), ω = ![]() , where k is the spring constant (an indicator of the stiffness of the spring), m is the mass attached to the spring (measured in slugs or kilograms), y0 is the initial displacement of the mass (measured above or below the equilibrium position), v0 is the initial velocity of the mass, t is time measured in seconds, and the period p of motion is p = 2π/ω seconds. The number f = 1/p = 1/(2π/ω) = ω/2π is called the frequency of motion. The frequency indicates the number of cycles completed by the graph per unit time. For example, if the period of (5) is, say, p = 2 seconds, then we know that one cycle of the function is complete in 2 seconds. The frequency f = 1/p =
, where k is the spring constant (an indicator of the stiffness of the spring), m is the mass attached to the spring (measured in slugs or kilograms), y0 is the initial displacement of the mass (measured above or below the equilibrium position), v0 is the initial velocity of the mass, t is time measured in seconds, and the period p of motion is p = 2π/ω seconds. The number f = 1/p = 1/(2π/ω) = ω/2π is called the frequency of motion. The frequency indicates the number of cycles completed by the graph per unit time. For example, if the period of (5) is, say, p = 2 seconds, then we know that one cycle of the function is complete in 2 seconds. The frequency f = 1/p = ![]() means one-half of a cycle is complete in 1 second.
means one-half of a cycle is complete in 1 second.
In the study of simple harmonic motion it is convenient to recast the equation of motion (5) as a single expression involving only the sine function:
![]()
The reduction of (5) to the sine function (7) can be done in exactly the same manner as illustrated in Example 2. In this situation we make the following identifications between (2) and (5):
![]()
EXAMPLE 3 Equation of Motion
(a) Find the equation of simple harmonic motion (5) for a spring mass system if m = slug, ![]()
(b) Find the period and frequency of motion.
Solution (a) We begin with the simple harmonic motion equation (5). Since ![]() therefore (5) becomes
therefore (5) becomes
![]()
(b) The period of motion is 2π/8 per second; the frequency is 4/π ≈ 1.27 cycles per second.
EXAMPLE 4 Example 3 Continued
Express the equation of motion (8) as a single sine function (7).
Solution With ![]() we find the amplitude of motion is
we find the amplitude of motion is
![]()
Then from
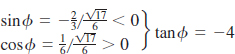
we can see from algebraic signs sin φ < 0 and cos φ > 0 that the terminal side of the angle φ lies in the fourth quadrant. Hence the correct value of φ is tan−1(−4) ≈ −1.3258. The equation of motion is then ![]() sin (8t − 1.3258). As shown in FIGURE 4.10.4, the amplitude of motion is
sin (8t − 1.3258). As shown in FIGURE 4.10.4, the amplitude of motion is ![]() Since we are assuming that that is motion in Example 4 no resistance to the motion, once the spring/mass system is set in motion the model indicates it stays in motion bouncing back and forth between its maximum displacement
Since we are assuming that that is motion in Example 4 no resistance to the motion, once the spring/mass system is set in motion the model indicates it stays in motion bouncing back and forth between its maximum displacement ![]() feet above the equilibrium position and α minimum of −
feet above the equilibrium position and α minimum of − ![]() feet below the equilibrium position.
feet below the equilibrium position.

FIGURE 4.10.4 Graph of the equation of motion in Example 4
Only in the two cases, c1 > 0, c2 > 0 or c1 < 0, c2 > 0, can we use tan φ in (4) to write φ = tan−1(c1/c2). (Why?) Correspondingly, φ is a first or a fourth-quadrant angle.
4.10 Exercises Answers to selected odd-numbered problems begin on page ANS-15.
In Problems 1–6, proceed as in Example 2 and reduce the given trigonometric expression to the form y = Asin(Bx + φ). Sketch the graph and give the amplitude, the period, and the phase shift.
1. y = cosπx − sinπx
2. y = sin![]()
3. y = ![]() sin2x + cos2x
sin2x + cos2x
4. y = ![]() cos4x − sin4x
cos4x − sin4x
5. ![]()
6. y = sinx + cosx
In Problems 7–10, proceed as in Examples 3 and 4 and use the given information to express the equation of simple harmonic motion (5) for a spring/mass system in the trigonometric form (7). Give the amplitude, period, and frequency of motion.
7. ![]()
8. ![]()
9. ![]()
10. ![]()
11. The equation of simple harmonic motion of a spring/mass system is ![]() Determine the initial displacement y0 and initial velocity v0 of the mass. [Hint: Use (5).]
Determine the initial displacement y0 and initial velocity v0 of the mass. [Hint: Use (5).]
12. Use the equation of simple harmonic motion of the spring/mass system given in Problem 11 to find the times for which the mass passes through the equilibrium position y = 0.
13. Find the first three x-intercepts of the function y = cos2x − ![]() sin2x on the positive x-axis. See Figure 4.10.2.
sin2x on the positive x-axis. See Figure 4.10.2.
Miscellaneous Applications
14. Electrical Circuits Under certain conditions the current I(t) in an electrical circuit at time t is given by I(t) = I0[sin(ωt + θ) cos φ + cos(ωt + θ) sin φ]. Express I(t) as a single sine function of the form given in (7). [Hint: Review the sum formula in (4) of Theorem 4.6.2.]
 Introduction As we saw in Section 2.9., the fundamental motivating problem of differential calculus, find a tangent line to the graph of the function, is answered by the concept of a limit. In that section we purposely kept the discussion about limits at an intuitive level; our emphasis was on reviewing the appropriate algebra, such as factoring and rationalization, necessary to be able to compute a limit analytically. In the study of the calculus of the trigonometric functions you will, of course, be expected to compute limits involving trigonometric functions. As the examples in this section will illustrate, computation of trigonometric limits entail both algebraic manipulations and knowledge of basic trigonometric identities.
We begin with a fundamental limit result for the sine function.
![]() An Important Trigonometric Limit To do the calculus of the trigonometric functions, sinx, cos x, tanx, and so on, it is important to realize that the variable x is a real number or an angle x measured in radians. With that in mind, consider the numerical values of (sinx)/x as x approaches 0 from the right (x → 0+) given in the table that follows.
An Important Trigonometric Limit To do the calculus of the trigonometric functions, sinx, cos x, tanx, and so on, it is important to realize that the variable x is a real number or an angle x measured in radians. With that in mind, consider the numerical values of (sinx)/x as x approaches 0 from the right (x → 0+) given in the table that follows.
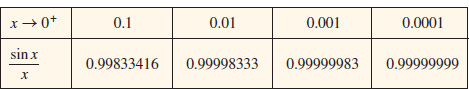
It is easy to see that the same results given in the table hold as x → 0−. Because sinx is an odd function, for x > 0 and −x, 0 we have sin(−x) = −sinx and as a consequence ![]() In other words, when the value of x is small in absolute value
In other words, when the value of x is small in absolute value
![]()
![]() Important
Important
While numerical calculations such as this do not constitute a proof, they do suggest that![]() Using the limit symbol, we have motivated the following result
Using the limit symbol, we have motivated the following result
![]()
See Problem 26 in Exercises 5.1 for a guided tour through the basic steps of a proof of (1) that is usually presented in calculus.
In this discussion we make the same assumption that we did in Sections 1.5 and 2.9, namely, that all limits under consideration actually exist. Everything that we do−algebraic manipulations, taking limits of products and quotients in the examples in this section−is predicated on this assumption.
Other limits of importance are
lxiSmasinx = sina, limcosx = cosa.
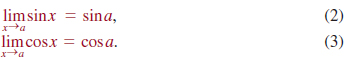
The results (2) and (3) are immediate consequences of the fact that f(x) = sinx and g(x) = cosx are continuous functions for all x. As we have seen in Section 4.3. the graphs of sinx and cosx are smooth and unbroken. For example, from (2),

Also, from (3),
![]()
The results in (1), (2), and (3) are used often to compute other limits. As in Section 1.5. many of the limits considered in this section are limits of fractional expressions where both the numerator and the denominator are approaching 0. Recall, these kinds of limits are said to have the indeterminate form 0⁄0. Note that the limit (1) is of this indeterminate form.
EXAMPLE 1 Using (1)
Find ![]()
Solution We rewrite the fractional expression as two fractions with the same denominator x:
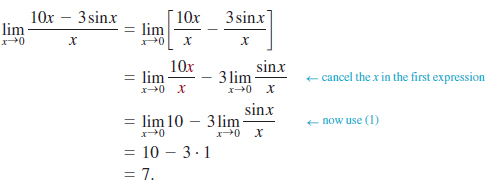
EXAMPLE 2 Using the Double-Angle Formula
Find ![]()
Solution To evaluate the given limit, we make use of the double-angle formula sin2x = 2sinxcosx of Section 4.5. and the results in (1) and (5):
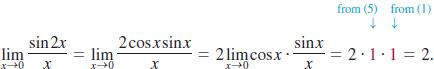
![]()
![]() Using a Substitution We are often interested in limits similar to that considered in Example 2. But if we wish to find, say,
Using a Substitution We are often interested in limits similar to that considered in Example 2. But if we wish to find, say, ![]() the procedure employed in Example 2 breaks down at a practical level since we have not developed a trigonometric identity for sin5x. There is an alternative procedure that allows us to quickly find
the procedure employed in Example 2 breaks down at a practical level since we have not developed a trigonometric identity for sin5x. There is an alternative procedure that allows us to quickly find ![]() , where k ≠ 0 is any real constant, by simply changing the variable by means of a substitution. If we let t = kx, then x = t/k. Notice that as x → 0 then necessarily t → 0. Thus we can write
, where k ≠ 0 is any real constant, by simply changing the variable by means of a substitution. If we let t = kx, then x = t/k. Notice that as x → 0 then necessarily t → 0. Thus we can write
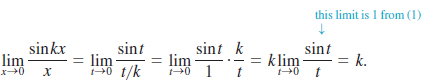
Thus we have proved the general result
![]()
Hence  See Problem 25 in Exercises 4.11.
EXAMPLE 3 Trigonometric Limit
Find ![]()
Solution Using the definition tanx = sinx/cosx we can write

From (5) and (1) we know that cos x → 1 and (sin x)/x → 1 as x → 0, and so the preceding line becomes
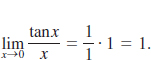
EXAMPLE 4 Using a Pythagorean Identity
Find ![]()
Solution To compute this limit we start with a bit of algebraic cleverness by multiplying the numerator and denominator by the conjugate factor of the numerator. Next we use the fundamental Pythagorean identity sin2x + cos2x = 1 in the form 1 − cos2x = sin2x:
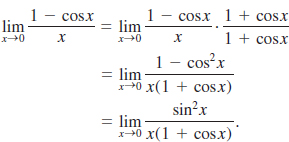
For the next step we resort back to algebra to rewrite the fractional expression as a product, then use the results in (1), (4), and (5):
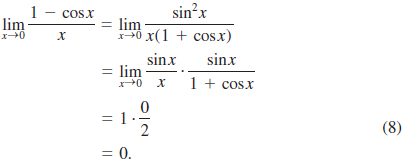
That is, ![]()
From (8) we obtain a limit result that is used in calculus to find the derivatives of the sine and cosine functions. Since the limit in (8) is equal to 0, we can write
![]()
Dividing by −1 then gives
![]()
![]() The Calculus Connection In Section 2.9. we saw that the derivative of a function y = f(x) is the function f′(x) defined by a limit of a difference quotient:
The Calculus Connection In Section 2.9. we saw that the derivative of a function y = f(x) is the function f′(x) defined by a limit of a difference quotient:
![]()
In computing this limit we shrink h to zero but x is held fixed. Recall too, if a number x = a is in the domains of f and f′, then f(a) is the y-coordinate of the point of tangency (a, f(a)) and f′(a) is the slope of the tangent line at that point.
![]() Derivatives of ƒ(x) = sinx and ƒ(x) = cosx To find the derivative of f(x) = sin x we use the four-step process illustrated in Example 3 of Section 2.9.. In the first step we use from Section 4.6. the sum formula for the sine function:
Derivatives of ƒ(x) = sinx and ƒ(x) = cosx To find the derivative of f(x) = sin x we use the four-step process illustrated in Example 3 of Section 2.9.. In the first step we use from Section 4.6. the sum formula for the sine function:
![]()
(i) With x and h playing the parts of x1 and x2, we have from (11):
f(x + h) = sin(x + h) = sinxcosh + cosxsinh.
(ii) f(x + h) − f(x) = sinxcosh + cosxsinh − sinx
= sinx(cosh − 1) + cosxsinh
As we see in the next line, we cannot cancel the h’s in the difference quotient but we can rewrite the expression to make use of the limit results in (1) and (9).
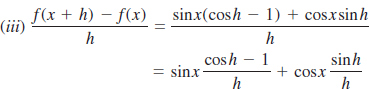
(iv) In this line, the symbol h plays the part of the symbol x in (1) and (9):
![]()
From the limit results in (1) and (9), the last line is the same as
![]()
In summary:
![]()
It is left to you, the student, to show that
![]()
See Problems 23 and 24 in Exercises 4.11.
EXAMPLE 5 Equation of a Tangent Line
Find an equation of the tangent line to the graph of f(x) = sinx at x = 4π/3.
Solution We start by finding the point of tangency. From
![]()
we see that the point of tangency is (4π/3, − ![]() /2). The slope of the tangent line at that point is the derivative of f(x) = sinx evaluated at the x-coordinate. From (12) we know that f′(x) = cosx and so the slope at (4π/3, −
/2). The slope of the tangent line at that point is the derivative of f(x) = sinx evaluated at the x-coordinate. From (12) we know that f′(x) = cosx and so the slope at (4π/3, − ![]() /2) is
/2) is
![]()
From the point-slope form of a line, an equation of the tangent line is
![]()
FIGURE 4.11.1 Tangent line in Example 5

See FIGURE 4.11.1.
4.11 Exercises Answers to selected odd-numbered problems begin on page ANS-16.
In Problems 1–18, use the results in (1), (2), (3), (7), and (9) to find the indicated limit.
1. ![]()
2. ![]()
3. 
4. ![]()
5. ![]()
6. ![]()
7. ![]()
8. ![]()
9. ![]()
10. ![]()
11. ![]()
12. ![]()
13. ![]()
14. ![]()
15. ![]()
16. ![]()
17. ![]()
18. ![]()
In Problems 19–22, proceed as in Example = to find an equation of the tangent line to the graph of f(x) = sinx at the indicated value of x.
19. x = 0
20. x = π/2
21. x = π/6
22. x = 2π/3
23. Proceed as on page 271–272 and find the derivative of f(x) = cosx.
24. Use the result of Problem 23 to find an equation of the tangent line to the graph of f(x) = cosx at x = π/3.
25. Use the facts that
![]()
to find the derivative of f(x) = sin5x.
26. Use the result of Problem 25 to find an equation of the tangent line to the graph of f(x) = sin5x at x = π.
Calculator/Computer Problems
In Problems 27 and 28, use a calculator or computer to estimate the given limit by completing each table. Round the entries in each table to eight decimal places.
27. ![]()
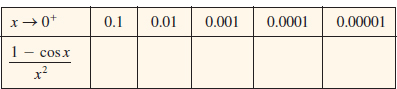
Explain why we do not have to consider x → 0−.
28. ![]()
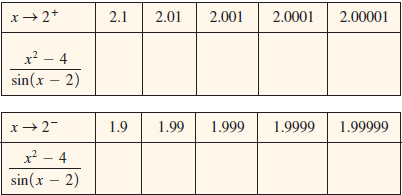
For Discussion
In Problems 29–36, discuss how to use the result in (1) along with some clever algebra, trigonometry, or a substitution to find the given limit.
29. ![]()
30. ![]()
31. ![]()
32. ![]()
33. ![]()
34. ![]()
35. ![]()
36. ![]()
37. Using what you have learned in Problems 29 and 36, find the limit
![]()
without the aid of the numerical table in Problem 28.
38. (a) Use a calculator to complete the following table.

(b) Find the limit  using the method given in Example 4.
(c) Discuss any differences that you observe between parts (a) and (b).
A. Fill in the Blanks__________________________________
In Problems 1–25, fill in the blanks.
1. π/5 radians = _______ degrees.
2. 10 degrees = _______ radians.
3. The exact values of the coordinates of the point P(t) on the unit circle corresponding to t = 5π/6 are _______.
4. The reference angle for 4π/3 radians is _______ radians.
5. ![]() .
.
6. In standard position, the terminal side of the angle 8π/5 radians lies in the _______ quadrant.
7. If ![]() and θ is in quadrant IV, then secθ = _______.
and θ is in quadrant IV, then secθ = _______.
8. If tant = 2 and t is in quadrant III, then cos t = _______.
9. The y-intercept for the graph of the function y = 2sec(x + π) is _______.
10. The values of t in the interval [0, 2π] that satisfy sin2t = ![]() are _______.
are _______.
11.If ![]() , 0 < u < π/2, and cosv = 1/
, 0 < u < π/2, and cosv = 1/![]() , 3π/2 < v < 2π, then cos(u + v) = _______.
, 3π/2 < v < 2π, then cos(u + v) = _______.
12. If ![]()
13. A sine function with period 1 is _______.
14. The first vertical asymptote for the graph of ![]() to the right of the y-axis is _______.
to the right of the y-axis is _______.
15. ![]()
16. 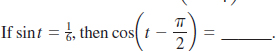
17. The amplitude of ![]()
18. ![]()
19. The exact value of arccos ![]()
20. The period of the function ![]()
21. The amplitude of the function y = sinx + 2![]() cosx is _______.
cosx is _______.
22. If ![]() is a point on the unit circle, then sin2t = _______.
is a point on the unit circle, then sin2t = _______.
23. The fifth x-intercept of the graph of y = sinπx on the positive x-axis is _______.
24. The exact value of cos70°cos40° + sin70°sin40° is _______.
25. ![]()
B. True/False _______________________________
In Problems 1-25, answer true or false.
1. cos2 θ − sin2θ = 1 − 2sin2θ _______
2. sin255° + sin235° = 1 _______
3. ![]()
4. There is no angle t such that sec t = ![]()
5. sin(2π − t) = − sin t _______
6. 1 + sec2θ = tan2θ _______
7. ![]() is an x-intercept of the graph of y = 3cosπx._______
is an x-intercept of the graph of y = 3cosπx._______
8. (2π/3, − 1/![]() .) is a point on the graph of y = cotx. _______
.) is a point on the graph of y = cotx. _______
9. The range of the function y = cscxis ( − ∞, −1] U [1,∞)._______
10. The graph of y = cscx does not intersect the y-axis._______
11. The line x = π/2 is a vertical asymptote for the graph of y = tanx._______
12. If tan(x + π) = 0.3, then tanx = 0.3._______
13. For the sine function y = −2sinxwe have −2 ≤y ≤ 2._______
14. sin6x = 2sin3xcos3x _______
15. The graph of y = sin(2x − π/3) is the graph of y = sin2x shifted π/3 units to the right._______
16. Since tan(5π/4) = 1, then arctan (1) = 5π/4._______
17. arccos ![]()
18. f(x) = arcsinx is not periodic._______
19. f(x) = xsinx is 2π periodic._______
20. f(x) = sin(cosx) is an even function._______
21. tan8π = tan5π _______
22. The graph of ![]() passes through the origin. _______
passes through the origin. _______
23. cos215° − sin215° = ![]() _______
_______
24. If cos210° = ![]()
25. If 0 < x < π, then necessarily ![]()
C. Review Exercises ________________________________
In Problems 1–4, give two examples of the indicated trigonometric function such that each has the given properties.
1. sine function with period 4 and amplitude 6
2. cosine function with period π, amplitude 4, and phase shift ![]()
3. sine function with period π/2, amplitude 3, and phase shift π/4
4. tangent function whose graph completes one cycle on the interval (−π/8, π/8)
In Problems 5–14, find all t in the interval [0, 2π] that satisfy the given equation.
5. cos tsin t − cos t + sin t − = 0
6. cos t − sin t = 0
7. 4sin2t − 1 = 0
8. sin t = 2tant
9. cos4x = −1
10. tant − 3cott = 2
11. −sin2t + sin4t = 0
12. cos9t − cos3t = 0
13. sin tcos t = ![]()
14. tant = 4
In Problems 15–22, find the indicated value without using a calculator.
15. ![]()
16. arcsin(−1)
17. ![]()
18. ![]()
19. sin−1(sinπ)
20. cos(arccos 0.42)
21. ![]()
22. arctan(cosπ)
In Problems 23 and 24, write the given expression as an algebraic expression in x.
23. sin(arccosx)
24. sec(tan−1x)
In Problems 25–28, the given graph can be interpreted as a rigid/nonrigid transformation of the graph of y = sinx and of the graph of y = cosx. Find an equation of the graph using the sine function. Then find an equation of the same graph using the cosine function.
25. 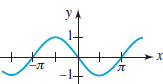
FIGURE 4.R.1 Graph for Problem 25
26. 
FIGURE 4.R.2 Graph for Problem 26
27. 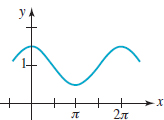
FIGURE 4.R.3 Graph for Problem 27
28. 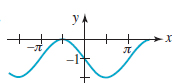
FIGURE 4.R.4 Graph for Problem 28
In Problems 29 and 30, verify the given trigonometric identity.
29. ![]()
30. cos4t + 1 − sin4t = 2cos2t
*The use of the number 60 as a base dates back to the Babylonians. Another example of the use of this base in our culture in the measurement of time (1 hour = 60 minutes and 1 minute = 60 seconds).