
7
Agile Tracking and Reporting
This chapter discusses tracking and reporting requirements in the agile environment.* At the end of the iterations, certain information is of particular interest to stakeholders. A review of several of these items follows.
• Product Backlog: The backlog includes all product requirements. These user stories are selected for development based on the priority levels assigned by the customer. High-priority items are developed first and those that have a low priority may be postponed for later iterations.
• Iteration Backlog (e.g., Sprint Backlog): These items include the list of user stories that the developers have agreed to complete for a particular iteration. The items in the iteration backlog cannot be changed once the iteration has begun.
We have identified some of the information that stakeholders have interest in and now we need to determine how these data points should best be presented. In the agile environment, a best practice is to use a task board that visually displays relevant project information. A task board helps with the delivery of value on the agile project. It offers benefits such as the perceived improvement of the project data accuracy and removal of roadblocks to stakeholder interactions. The reader should remember that agile is about simplicity. The task board is a simple tool that supports increased visibility on the agile project. The task board can be used to display information for the (1) overall project, (2) a release, or (3) the current iteration. In addition, the author believes that the number of defects can be reported on a task board. Information is typically displayed in three columns: to do, in progress, and done. User stories are displayed in each column with their assigned story points (See Figure 7.1 for details).
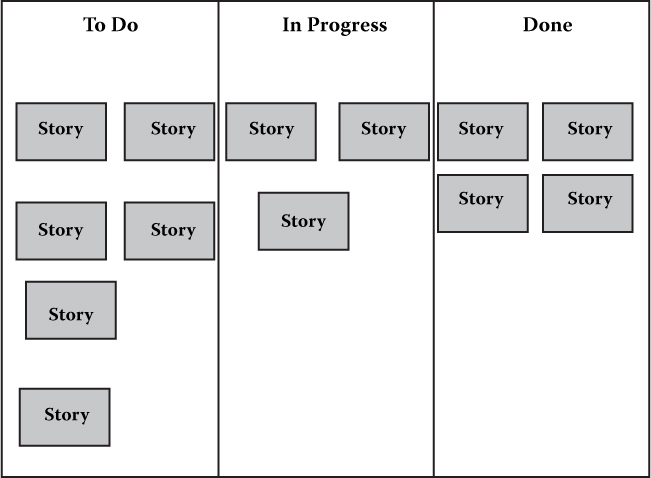
FIGURE 7.1
Agile task board.
Additional information that is reported in the agile environment includes but is not limited to the following:
• Burndown Chart: This particular chart is used to show when the project is expected to be completed. The level of effort that is remaining on the project can be shown in terms of story points or hours. Recall from Chapter 3, Figure 3.2, the Burndown Chart example.
• Team Velocity: The development team’s velocity is denoted by a number that indicates how many user stories they can develop into functionality during the iterations. Velocity is recorded for all iterations and this determines when a project is expected to be completed. For example, if a team has an average of 40 story points per iteration, the product backlog has 400 story points remaining; then we divide 400/40 and we get 10. This means that in 10 additional iterations, the project is expected to be completed.* See Figure 7.2 for an illustration of team velocity information. The data can be graphed and visually displayed using MS Excel.
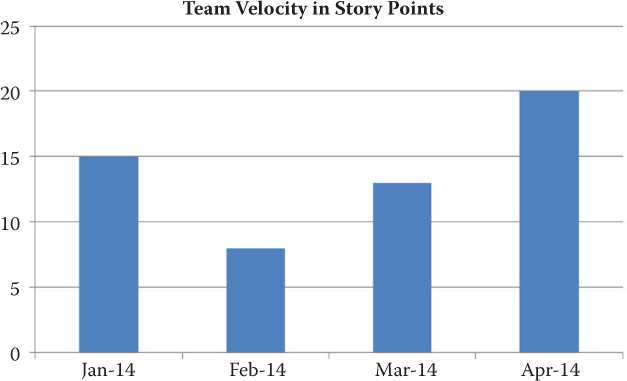
FIGURE 7.2
Team velocity example.
The example above shows the team’s velocity on a monthly basis. Another option is to show the team’s velocity on an iteration basis. When tracking team velocity over several iterations, this information can be used to determine when the actual project is forecast to be completed. During the early iterations, it is expected that team velocity will vary and then become consistent later in the project. This is normal because of the newness of the environment to the agile team.
EARNED VALUE ON AGILE PROJECTS
Story points are a good measurement of the volume of work planned and completed. This information can be used for calculating earned value. According to the PMI (2013), earned value management (EVM)* is a method that uses scope, schedule, and resources to evaluate project performance and progress. We have provided an overview of EVM formulas and definitions below:
Planned Value (PV): The approved budget for the scheduled work.
Earned Value (EV): The measure of the work performed based on the approved budget.
Actual Cost (AC): The actual costs incurred for the work that has been performed on an activity during an explicit time period.
Schedule Variance (SV): A measure of the schedule performance calculated as the difference between the earned value and the planned value. Formula: SV = EV – PV
Interpretation of results:
Positive = Ahead of schedule (good)
Neutral (0) = On schedule (okay)
Negative = Behind schedule (not good)
Cost Variance (CV): The amount of budget shortfall or leftover at a specific point in time calculated as the difference between earned value and the actual cost. Formula: CV = EV – AC
Interpretation of results:
Positive = Under planned costs (good)
Neutral (0) = At planned costs (okay)
Negative = Over planned costs (not good)
Schedule Performance Index (SPI): A measure of the schedule efficiency calculated as the ratio of earned value to planned value. Formula: SPI = EV/PV
Interpretation of results:
>1.0 = Ahead of schedule (good)
Exactly 1.0 = On schedule (okay)
Less than 1.0 = Behind schedule (not good)
Cost Performance Index (CPI): A measure of the cost efficiency of the budgeted resources calculated as a ratio of earned value to actual cost. Formula: CPI = EV/AC
Interpretation of results:
>1.0 = Under planned costs (good)
Exactly 1.0 = At planned costs (okay)
<1.0 = Over planned costs (not good)
In order to calculate earned value on the agile project, we would need to consider the following:
• The number of story points for a release, an iteration, or the prioritized product backlog for the project. This number is used to measure the amount of planned work. This will be the foundation for all of the earned value calculations.
• The number of planned iterations.
• 15
• The number of story points planned in the backlog.
• 100
• The budget planned for the entire backlog.
• $100,000
• The start date of the project.
• This date is 01/13/2014 and each iteration is 2 weeks long.
• Current date is 04/01/2014; 12 weeks have passed; 6 iterations completed.
• The number of iterations that have been completed.
• This is a measurement of the expected percent complete (EPC) calculated by dividing the number of iterations completed by the total number of planned iterations.
• Sample data: 6 iterations completed/15 total planned iterations
• Expected percent complete = 6/15 = 40%
We calculate the schedule performance index (SPI) for a fictitious project.
• SPI = Completed story points/planned story points
• For example, Completed story points = 60 and planned story points = 60
• Velocity = 10 story points per iteration (10 × 6 = 60); Recall that 6 iterations have been completed and velocity is 10 per iteration.
• SPI = 60/60
• SPI = 1.0 (on schedule)
Calculate the cost performance index (CPI):
• CPI = EV/AC
• Let’s say the 60 story points were budgeted at $60,000 and actual costs are $75,000.
• CPI = $60,000/75,000
• CPI =.80 (Over the planned costs)
Calculate the schedule variance (SV):
• SV = EV – PV
• Let’s say the EV = $60,000 from our example above.
• PV = $60,000
• SV = $60,000 – $60,000
• SV = $0 (on schedule)
Calculate the cost variance (CV):
• CV = EV – AC
• Let’s say the EV = $60,000.
• AC = $75,000
• CV = $60,000 – $75,000
• CV = -$15,000 (over the planned cost by this amount)
It must be clear that EVM has its place on the agile project. We should be cautious with the interpretation of the results, however. The project may be on track in terms of schedule, costs, and scope, but the main objective on the agile project is to deliver value to the customer. What we actually need to track and report on is value. Earned value is not the same as business value. We must never lose our focus on delivering business value for the customer! To further clarify, earned value is a measure of work that has been completed whereas business value (discussed in Chapter 1) describes the well-being of a business. This includes economic profits and other forms of tangible and intangible value including but not limited to employee or customer value.
CUMULATIVE FLOW DIAGRAMS
Another type of graph that is used on the agile project is known as a cumulative flow diagram. This is a graphical representation of the total number of features that have been completed and are in progress based on a particular time frame. Figure 7.3 shows a sample diagram. Note that these graphs can be generated in MS Excel.
WORK IN PROGRESS (WIP)
Work in progress refers to work that has not yet been completed. Kanban development is based upon the Lean production system that is used at Toyota Motor Company. The word Kanban means “signboard” in Japanese, another word for task board. Kanban development, a Lean/agile method, limits work that is in progress so that issues can be identified, waste can be minimized,* and costs that are related to changes can be limited. In addition to WIP, Kanban uses the “pull system” (based on actual or consumed demand) rather than the “push system” (based on forecast demand).† With the task board, value is visually displayed and the team has easy access to the information. With Kanban, teams are invigorated to try different methods and tactics. This results in continuous improvement under the pull system. The end result is that waste is eliminated or reduced.
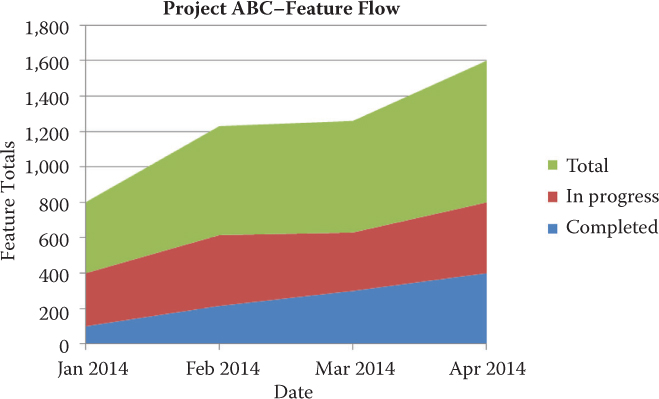
FIGURE 7.3
Cumulative flow diagram.
CHAPTER SUMMARY
This concludes our discussion on tracking and reporting value. Some of our metrics such as earned value are used in a similar way as in traditional project management. For the agile project, we are concerned about tracking and reporting of value delivered to the customer. It is very important to track and report value in the agile environment. We need to ensure that the project will be completed as planned, value is being delivered to the client, and the project’s status is reported to the stakeholders in a timely fashion. The tools and techniques described in this chapter represent the means by which we can accomplish the agile project’s tracking and reporting goals.