
![]()
Introduction to Business Analytics and Data Analysis Tools
There is an ever-increasing need for advanced information and decision support systems in today’s fierce global competitive environment. The profitability and the overall business can be managed better with access to predictive tools—to predict, even approximately, the market prices of raw materials used in production, for instance. Business analytics involves, among others, quantitative techniques, statistics, information technology (IT), data and analysis tools, and econometrics models. It can positively push business performance beyond executive experience or plain intuition.
Business analytics (or advanced analytics for that matter) can include nonfinancial variables as well, instead of traditional parameters that may be based only on financial performance. Business analytics can effectively help businesses, for example, in detecting credit card fraud, identifying potential customers, analyzing or predicting profitability per customer, helping telecom companies launch the most profitable mobile phone plans, and floating insurance policies that can be targeted to a designated segment of customers. In fact, advanced analytical techniques are already being used effectively in all these fields and many more.
This chapter covers the basics that are required to comprehend all the analytical techniques used in this book.
Business Analytics, the Science of Data-Driven Decision Making
Many analytical techniques are data intensive and require business decision makers to have an understanding of statistical and various other analytical tools. These techniques invariably require some level of IT and database knowledge. Organizations using business analytics techniques in decision making also need to develop and implement a data-driven approach in their day-to-day operations, planning, and strategy making. However, in a large number of cases, businesses have no other choice but to implement a data-driven decision-making approach because of fierce competition and cost-cutting pressures. This makes business analytics a lucrative and rewarding career choice. This may be the right time for you to enter this field because the business analytics culture is still in its nascent stage in most organizations around the world and is on the verge of exploding with respect to growing opportunities.
Business Analytics Defined
Business analytics is all about data, methodologies, IT, applications, mathematical, and statistical techniques and skills required to get new business insights and understand business performance. It uses iterative and methodical exploration of past data to support business decisions.
Business analytics aims to increase profitability, reduce warranty expenditures, acquire new customers, retain customers, upsell or cross-sell, monitor the supply chain, improve operations, or simply reduce the response time to customer complaints, among others. The applications of business analytics are numerous and across industry verticals, including manufacturing, finance, telecom, and retail. The global banking and financial industry traditionally has been one of the most active users of analytics techniques. The typical applications in the finance vertical are detecting credit card fraud, identifying loan defaulters, acquiring new customers, identifying responders to e-mail campaigns, predicting relationship value or profitability of customers, and designing new financial and insurance products. All these processes use a huge amount of data and fairly involved statistical calculations and interpretations.
Any application of business analytics involves a considerable amount of effort in defining the problem and the methodology to solve it, data collection, data cleansing, model building, model validation, and the interpretation of results. It is an iterative process, and the models might need to be built several times before they are finally accepted. Even an established model needs to be revisited/rebuilt periodically for changes in the input data or changes in the business conditions (and assumptions) that were used in the original model building.
Any meaningful decision support system that uses data analytics thus requires development and implementation of a strong data-driven culture within the organization and all the external entities that support it.
Let’s take an example of a popular retail web site that aims to promote an upmarket product. To do that, the retail web site wants to know which segment of customers it needs to target to maximize product sales with minimum promotional dollars. To do this, the web site needs to collect and analyze customer data. The web site may also want to know how many customers visited it and at what time; their gender, income bracket, and demographic data; which sections of the web site they visited and in what frequency; their buying and surfing patterns; the web browser they used; the search strings they used to get into the web site; and other such information.
If analyzed properly, this data presents an enormous opportunity to garner useful business insights about customers, thereby providing a chance to cut promotional costs and improve overall sales. Business analytics techniques are capable of working with multiple and a variety of data sources to build the models that can derive rich business insights that were not possible before. This derived rich fact base can be used to improve customer experiences, streamline operations, and thereby improve overall profitability. In the previous example, it is possible, by applying business analytics techniques, to target the product to a segment of customers who are most likely to buy it, thereby minimizing the promotional costs.
Conventional business performance parameters are based mainly on finance-based indicators such as top-line revenue and bottom-line profit. But there is more to the performance of a company than just financial parameters. Measures such as operational efficiency, employee motivation, average employee salary, working conditions, and so on, may be equally important. Hence, the numbers of parameters that are used to measure or predict the performance of a company have been increased here. These parameters will increase the amount of data and the complexity of analyzing it. This is just one example. The sheer volume of data and number of variables that need to be handled in order to analyze consumer behavior on a social media web site, for instance, is immense. In such a situation, conventional wisdom and reporting tools may fail. Advanced analytics predictive modeling techniques help in such instances.
The subsequent chapters in this book will deal with data analytics. Statistical and quantitative techniques used in advanced analytics, along with IT, provide business insights while handling a vast amount of data that was not possible until a few years ago. Today’s powerful computing machines and software (such as SAS) take care of all the laborious tasks of analytics algorithms coding and frees the analyst to work on the important tasks of interpretation and applying the results to gain business insights.
Is Advanced Analytics the Solution for You?
Anyone who is in a competitive business environment and faces challenges such as the following, or almost any problem for which data is available, might be a potential candidate for applying advanced analytics techniques:
- Consumer buying pattern analysis
- Improving overall customer satisfaction
- Predicting the lead times in supply chain
- Warrant costs optimization
- Right sizing or the optimization of the sales force
- Price and promotion modeling
- Predicting customer response to sales promotion
- Credit risk analysis
- Fraud identification
- Identifying potential loan defaulters
- Drug discovery
- Clinical data analysis
- Web site analytics
- Text analysis (for instance on Twitter)
- Social media analytics
- Identifying genes responsible for a particular disease
As discussed, business analytics is a culture that needs to be developed, implemented, and finally integrated as a way of life in any organization with regard to decision making. Many organizations around the world have already experienced and realized the potential of this culture and are successfully optimizing their resources by applying these techniques.
EXAMPLE
Trade-offs such as sales volumes versus price points and the costs of carrying inventory versus the chances of stocks not available on demand are always part of day-to-day decision making for managers. Many of these business decisions are highly subjective or based on available data that is not that relevant.
In one such example, a company’s analysis found that the driving force of customer sentiments on key social media sites is not its TV commercials but the interaction with the company’s call centers. The quality of service provided by the company, and the quality of call center interaction, was largely affecting the brand impact. Based on these insights, the company decided to divert part of the spending on TV commercials toward improving the call center satisfaction levels. The results were clearly visible; customer satisfaction surveys improved considerably, and there was a significant increase in customer base and revenues.
Simulation, Modeling, and Optimization
This section (and the chapter, by and large) explains the terminology and basics to build a background for the coming chapters, which will be more focused and technical in nature.
Simulation
There are various types of simulations. In the context of analytics, computer simulations, an oft-used term, is more relevant. Some real-world systems or scenarios might be complex and difficult to comprehend or predict. Predicting a snow storm or predicting stock prices are classic examples. They depend upon several variables or factors, which are practically impossible to predict. Daily stock prices, for instance, may be affected by current political conditions, major events during the day, international business environment, dollar prices, or simply the overall mood in the market.
There can be various levels of simulations, from simple programs that are a few hundred of lines of code which are complex and millions of lines of code. Computer simulations used in atmospheric sciences are another classic example where complex computer systems and software are used for weather prediction and forecasting.
Computer simulations use various statistical models in analytics.
Modeling
A modeling is merely the mathematical logic and concepts that go into a computer program. These models, along with the associated data, represent the real-world systems. These models can be used to study the effect of different components and predict system behavior. As discussed earlier, the accuracy with which a model represents a real-world system may vary and depends upon the business needs and resources available. For instance, 90 percent accuracy in prediction might be acceptable in banking applications such as the identification of loan defaulters, but in systems that involve human life—for instance, reliability models in aerospace applications—accuracy of 100 percent, or as close to it, is desired.
Optimization
Optimization is a term related to computer simulations. The sole objective of some computer simulations may be simply to ensure optimization, which in simple terms can be explained as minimization or maximization of a mathematical function, subject to a given set of constrains. In optimization problems, a set of variables might need to be selected from a range of available alternatives to minimize or maximize a mathematical function while working with constraints. Although optimization is discussed here in its most simple form, there is much more to it.
An instance of a simple optimization problem is maximizing the working time of a machine, while keeping the maintenance costs below a certain level. If enough data is available, this kind of problem may be solved using advanced analytics techniques. Another instance of a practical optimization problem is chemical process factories, where an engineer may need to adjust a given set of process parameters in order to get maximum output of a chemical reaction plant, while also keeping the costs within budget. Advanced analytical techniques can be an alternative here as well.
Data Warehousing and Data Mining
Creating a data warehouse can be considered one of the most important basics. It can give a jump start to any business analytics project. Consider an example of a multilocational business organization with sales offices and manufacturing plants spread across the country. Today, in almost all large establishments, some amount of business process automation using homegrown or packaged applications such as SAP is expected. Some processes can be local, and their transaction data might be maintained at the branch level. It may not be possible to provide the head office with quarterly sales reports across the products and locations, unless all the relevant data is readily available to the reporting engine. This task is easier if the company links its branch-level data sources and makes them available in a central database. The data may need cleansing and transformations before being loaded in the central database. This is done in order to make the raw data more meaningful for further analysis and reporting. This central database is often called a data warehouse.
The previous instance was just one example of a data warehouse. We live in a data age. Terabytes and petabytes of data are being continuously generated by the World Wide Web, sales transactions, product description literatures, hospital records, population surveys, remote-sensing data by satellites, engineering analysis results, multimedia and videos, and voice and data communications networks. The list is endless. The sources of data in a data warehouse can be multiple and heterogeneous. Interesting patterns and useful knowledge can be discovered by analyzing this vast amount of available data. This process of knowledge discovery is termed data mining (Figure 1-1). The sources of data for a data mining project may be multiple, such as a single large company-wide data warehouse or a combination of data warehouses, flat files, Internet, commercial information repositories, social media web sites, and several other such sources.

Figure 1-1. Data mining
What Can Be Discovered Using Data Mining?
There are a few defined types of pattern discoveries in data mining. Consider the familiar example of the bank and credit card. Bank managers are sometimes interested only in summaries of a few general features in a target class. For instance, a bank manager might be interested in credit card defaulters who regularly miss payment deadlines by 90 days or more. This kind of abstraction is called characterization.
In the same credit card example, the bank manager might want to compare the features of clients who pay on time versus clients who regularly default beyond 90 days. This is a comparative study, termed as discrimination, between two target groups.
In yet another type of abstraction called association analysis, the same bank manager might be interested in knowing how many new credit card customers also took personal loans. The bank may also be interested in building a model that can be used as a support tool to accept or reject the new credit card applications. For this purpose, the bank might want to classify the clients as “very safe,” “medium risky,” and “highly risky,” as one of the steps. It might be done after a thorough analysis of a large number of client attributes.
The bank might also be interested in predicting which customers can be potential loan defaulters, again based on an established model, which consumes a large number of attributes pertaining to its clients. This is predictive analysis.
To open new branches or ATMs, the bank might be interested in knowing the concentration of customers by geographical location. This abstraction, called clustering, is similar to classification, but the names of classes and subclasses are not known as the analysis is begun. The class names (the geography names with sizable concentration) are known only after the analysis is complete. While doing a cluster analysis or classification on a given client attribute, there may be some values that do not fit in with any class or cluster. These exclusions or surprises are outliers.
Outlier values might not be allowed in some model-building activities because they tend to bias the result in a particular direction, which may not be a true interpretation of the given data set. Such outliers are common while dealing with $ values in data sets. Deviation analysis deals with finding the differences between the expected and actual values.
For example, it might be interesting to know the deviation with which a model predicts the credit card loan defaulters. Such an analysis is possible when both the model-predicted values and actual values are present. It is, in fact, periodically done to ascertain the effectiveness of models. If the deviation is not acceptable, it might warrant the rebuilding of the model.
Deviation analysis also attempts to find the causes of observed deviations between predicted and actual values. This is by no means a complete list of patterns that can be discovered using data mining techniques. The scope is much wider.
Business Intelligence, Reporting, and Business Analytics
Business intelligence (BI) and business analytics are two different but interconnected techniques. As reported in one of SAS’s blogs, a majority of business intelligence systems aim at providing comprehensive reporting capabilities and dashboards to the target group of users. While business analytics tools can do reporting and dashboards, they can also do statistical analysis to provide forecasting, regression, and modeling. SAS business analytics equips users with everything needed for data-driven decision making, which includes information and data management and statistical and presentation tools.
Analytics Techniques Used in the Industry
The previous few sections introduced the uses of data mining or business analytics. This section will examine the terminology in detail. Only the frequently used terms in the industry are discussed here.
Then the chapter will introduce and give examples of many of these analytics techniques and applications. Some of the more frequently used techniques will be covered in detail in later chapters.
Regression Modeling and Analysis
To understand regression and predictive modeling, consider the same example of a bank trying to aggressively increase its customer base for some of its credit card offerings. The credit card manager wants to attract new customers who will not default on credit card loans. The bank manager might want to build a model from a similar set of past customer data that resembles the set of target customers closely. This model will be used to assign a credit score to the new customers, which in turn will be used to decide whether to issue a credit card to a potential customer. There might be several other considerations aside from the calculated credit score before a final decision is made to allocate the card.
The bank manager might want to view and analyze several variables related to each of the potential clients in order to calculate their credit score, which is dependent on variables such as the customer’s age, income group, profession, number of existing loans, and so on. The credit score here is a dependent variable, and other customer variables are independent variables. With the help of past customer data and a set of suitable statistical techniques, the manager will attempt to build a model that will establish a relationship between the dependent variable (the credit score in this case) and a lot of independent variables about the customers, such as monthly income, house and car ownership status, education, current loans already taken, information on existing credit cards, credit score and the past loan default history from the federal data bureaus, and so on. There may be up to 500 such independent variables that are collected from a variety of sources, such as credit card application, federal data, and customers’ data and credit history available with the bank. All such variables might not be useful in building the model. The number of independent variables can be reduced to a more manageable number, for instance 50 or less, by applying some empirical and scientific techniques. Once the relationship between independent and dependent variables is established using available data, the model needs validation on a different but similar set of customer data. Then it can be used to predict the credit scores of the potential customers. A prediction accuracy of 90 percent to 95 percent may be considered good in banking and financial applications; an accuracy of 75 percent is must. This kind of predictive model needs a periodic validation and may be rebuilt. It is mandatory in some financial institutions to revalidate the model at least once a year with renewed conditions and data.
In recent times, revenues for new movies depend largely on the buzz created by that movie on social media in its first weekend of release. In an experiment, data for 37 movies was collected. The data was the number of tweets on a movie and the corresponding tickets sold. The graph in Figure 1-2 shows the number of tweets on the x-axis and number of tickets sold on the y-axis for a particular movie. The question to be answered was, If a new movie gets 50,000 tweets (for instance), how many tickets are expected to be sold in the first week? A regression model was used to predict the number of tickets (y) based on number of tweets (x) (Figure 1-3).
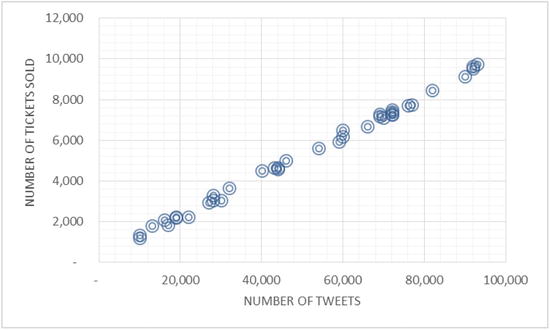
Figure 1-2. Number of Tickets Sold vs. Number of Tweets—a data collection for sample movies
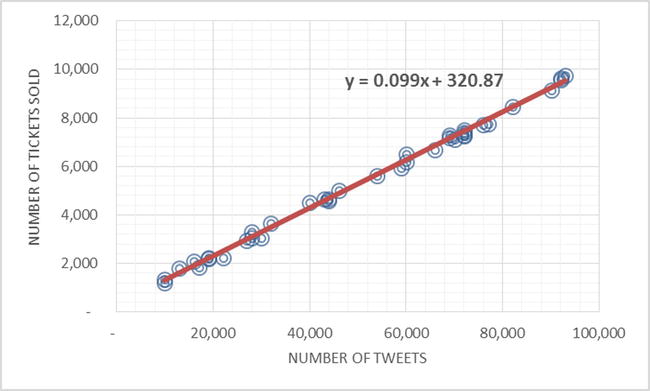
Figure 1-3. The regression model for Number of Tickets Sold vs. Number of Tweets—prediction using regression model
Using the previous regression predictive model equation, the number of tickets was estimated to be 5,271 for a movie that had 50,000 tweets in the first week of release.
Time Series Forecasting
Time series forecasting is a simple form of forecasting technique, wherein some data points are available over regular time intervals of days, weeks, or months. If some patterns can be identified in the historical data, it is possible to project those patterns into the future as a forecast. Sales forecasting is a popular usage of time series forecasting. In Figure 1-3, a straight line shows the trend from the past data. This straight line can easily be extended into a few more time periods to have fairly accurate forecasts. In addition to trends, time series forecasts can also show seasonality, which is simply a repeat pattern that is observed within a year or less (such as more sales of gift items on occasions such as Christmas or Valentine’s Day). Figure 1-4 shows an actual sales forecast, the trend, and the seasonality of demand.

Figure 1-4. A time series forecast showing the seasonality of demand
Figure 1-4 shows the average monthly sales of an apparel showroom for three years. There is a stock clearance sale every four months, with huge discounts on all brands. The peak in every fourth month is apparent from the figure.
Time series analysis can also be used in the example of bank and credit card to forecast losses or profits in future, given the same data for a historical period of 24 months, for instance. Time series forecasts are also used in weather and stock market analysis.
Other examples of time series data include representations of yearly sales volumes, mortgage interest rate variations over time, and data representations in statistical quality control measurements such as accuracy of an industrial lathe machine for a period of one month. In these representations, the time component is taken on the x-axis, and the variable, like sales volume, is on the y-axis. Some of these trends may follow a steady straight-line increase or a decline over a period of time. Others may be cyclic or random in nature. While applying time series forecasting techniques, it is usually assumed that the past trend will continue for a reasonable time in the future. This future forecasting of the trend may be useful in many business situations, such as stocks procurement, planning of cash flow, and so on.
Conjoint Analysis
Conjoint analysis is a statistical technique, mostly used in market research, to determine what product (or service), features, or pricing would be attractive to most of the customers in order to affect their buying decision positively.
In conjoint studies, target responders are shown a product with different features and pricing levels. Their preferences, likes, and dislikes are recorded for the alternative product profiles. Researchers then apply statistical techniques to determine the contribution of each of these product features to overall likeability or a potential buying decision. Based on these studies, a marketing model can be made that can estimate the profitability, market share, and potential revenue that can be realized from different product designs, pricing, or their combinations.
It is an established fact that some mobile phones sell more because of their ease of use and other user-friendly features. While designing the user interface of a new phone, for example, a set of target users is shown a carefully controlled set of different phone models, each having some different and unique feature yet very close to each other in terms of the overall functionality. Each user interface may have a different set of background colors; the placement of commonly used functions may also be different for each phone. Some phones might also offer unique features such as dual SIM. The responders are then asked to rate the models and the controlled set of functionalities available in each variation. Based on a conjoint analysis of this data, it may be possible to decide which features will be received well in the marketplace. The analysis may also help determine the price points of the new model in various markets across the globe.
Cluster Analysis
The intent of any cluster analysis exercise is to split the existing data or observations into similar and discrete groups. Each observation is divided groupwise in classification type of problems, while in cluster analysis, the aim is to determine the number and composition of groups that may exist in a given data or observation set.
For example, the customers could be grouped into some distinct groups in order to target them with different pricing strategies and customized products and services. These distinct customer groups (Figure 1-5) may include frequent customers, occasional customers, high net worth customers, and so on. The number of such groups is unknown when beginning the analysis but is determined as a result of analysis.

Figure 1-5. A cluster analysis plot
The graph in Figure 1-6 shows the debt to income ratio versus age. Customer segments that are similar in nature can be identified using cluster analysis.

Figure 1-6. Debt to Income Ratio vs. Age
The debt to income ratio in Figure 1-6 is low for age groups 20 to 30. The 30-to-45 age group segment has a higher debt to income ratio. The three groups need to be treated differently instead of as one single population, depending on the business objective.
Segmentation
Segmentation is similar to classification, where the criteria to divide observations into distinct groups needs to be found. The number of groups may be apparent even at the beginning of the analysis, while the aim of cluster analysis is to identify areas with concentrations different than other groups. Hence, clustering is discovering the presence of boundaries between different groups, while segmentation uses boundaries or some distinct criterion to form the groups.
Clustering is about dividing the population into different groups based on all the factors available. Segmentation is also dividing the population into different groups but based on predefined criteria such as maximizing the profit variable, minimizing the defects, and so on. Segmentation is widely used in marketing to create the right campaign for the customer segment that yields maximum leads.
Principal Components and Factor Analysis
These statistical methodologies are used to reduce the number of variables or dimensions in a model building exercise. These are usually independent variables. Principal component analysis is a method of combining a large number of variables into a small number of subsets, while factor analysis is a methodology used to determine the structure or underlying relationship by calculating the hidden factors that determine the variable relationships.
Some analysis studies may start with a large number of variables, but because of practical constraints such as data handling, data collection time, budgets, computing resources available, and so on, it may be necessary to drastically reduce the number of variables that will appear on the final data model. Only those independent variables that make most sense to the business need to be retained.
There might also be interdependency between some variables. For example, income levels of individuals in a typical analysis might be closely related to the monthly dollars they spend. The more the income, the more the monthly spend. In such a case, it is better to keep only one variable for the analysis and remove the monthly spend from the final analysis.
The regression modeling section discussed using 500 variables as a starting point to determine the credit score of potential customers. The principal component analysis can be one of the methods to reduce the number of variables to a manageable level of 40 variables (for example), which will finally appear in the final data model.
Correspondence Analysis
Correspondence analysis is similar to principal component analysis but applies to nonquantitative or categorical data such as gender, status of pass or fail, color of objects, and field of specialization. It especially applies to cross-tabulation. Correspondence analysis provides a way to graphically represent the structure of cross-tabulations with each row and column represented as a point.
Survival Analytics
Survival analytics is typically used when variables such as time of death, duration of a hospital stay, and time to complete a doctoral thesis need to be predicted. It basically deals with the time to event data. For a more detailed treatment of this topic, please refer to www.amstat.org/chapters/northeasternillinois/pastevents/presentations/summer05_Ibrahim_J.pdf.
Some Practical Applications of Business Analytics
The following sections discuss a couple of examples on the practical usage of application of business analytics in the real world. Predicting customer behavior towards some product features, or application of business analytics in the supply chain to predict the constraints, such as raw material lead times, are very common examples. Applications of analytics are very popular in retail and predicting trends on social media as well.
Customer Analytics
Predicting consumer behavior is the key to all marketing campaigns. Market segmentation, customer relationship management, pricing, product design, promotion, and direct marketing campaigns can benefit to a large extent if consumer behavior can be predicted with reasonable accuracy. Companies with direct interaction with customers collect and analyze a lot of consumer-related data to get valuable business insights that may be useful in positively affecting sales and marketing strategies. Retailers such as Amazon and Walmart have a vast amount of transactional data available at their disposal, and it contains information about every product and customer on a daily basis. These companies use business analytics techniques effectively for marketing, pricing policies, and campaign designs, which enable them to reach the right customers with the right products. They understand customer needs better using analytics. They can swap better-selling products at the cost of less-efficient ones. Many companies are also tapping the power of social media to get meaningful data, which can be used to analyze consumer behavior. The results of this analytics can also be used to design more personalized direct marketing campaigns.
Operational Analytics
Several companies use operational analytics to improve existing operations. It is now possible to look into business processes in real time for any given time frame, with companies having enterprise resource planning (ERP) systems such as SAP, which give an integrated operational view of the business. Drilling down into history to re-create the events is also possible. With proper analytics tools, this data is used to analyze root cases, uncover trends, and prevent disasters. Operational analytics can be used to predict lead times of shipments and other constraints in supply chains. Some software can present a graphical view of supply chain, which can depict any possible constraints in events such as shipments and production delays.
Social Media Analytics
Millions of consumers use social media at any given time. Whenever a new mobile phone or a movie, for instance, is launched in the market, millions of people tweet about it almost instantly, write about their feelings on Facebook, and give their opinions in the numerous blogs on the World Wide Web. This data, if tapped properly, can be an important source to uncover user attitudes, sentiments, opinions, and trends. Online reputation and future revenue predictions for brands, products, and effectiveness of ad campaigns can be determined by applying proper analytical techniques on these instant, vast, and valuable sources of data. In fact, many players in the analytics software market such as IBM and SAS claim to have products to achieve this.
Social media analytics is simply text mining or text analytics in some sense. Unstructured text data is available on social media web sites, which can be challenging to analyze using traditional analytics techniques. (Describing text analytics techniques is out of scope for this book.)
Some companies are now using consumer sentiment analysis on key social media web sites such as Twitter and Facebook to predict revenues from new movie launches or any new products introduced in the market.
Data Used in Analytics
The data used in analytics can be broadly divided into two types: qualitative and quantitative. The qualitative, discrete, or categorical data is expressed in terms of natural languages. Color, days of a week, street name, city name, and so on, fall under this type of data. Measurements that are explained with the help of numbers are quantitative data, or a continuous form of data. Distance between two cities expressed in miles, height of a person measured in inches, and so on, are forms of continuous data.
This data can come from a variety of sources that can be internal or external. Internal sources include customer transactions, company databases and data warehouses, e-mails, product databases, and the like. External data sources can be professional credit bureaus, federal databases, and other commercially available databases. In some cases, such as engineering analysis, a company may like developing its own data to solve an uncommon problem.
Selecting the data for building a business analytics problem requires a thorough understanding of the overall business and the problem to be resolved. The past sections discussed that an analytics model uses data combined with the statistical techniques used to analyze it. Hence, the accuracy of any model is largely dependent upon the quality of underlying data and statistical methods used to analyze it.
Obtaining data in a usable format is the first step in any model-building process. You need to first understand the format and content of the raw data made available for building a model. Raw data may require extraction from its base sources such as a flat file or a data warehouse. It may be available in multiple sources and in a variety of formats. The format of the raw data may warrant separation of desired field values, which otherwise appear to be junk or have little meaning in its raw form. The data may require a cleansing step as well, before an attempt is made to process it further. For example, a gender field may have only two values of male and female. Any other value in this field may be considered as junk. However, it may vary depending upon the application. In the same way, a negative value in an amounts field may not be acceptable.
In some cases, the size of available data may be so large that it may require sampling to reduce it to a manageable form for analysis purposes. A sample is a subset from the available data, which for all practical purposes represents all the characteristics of the original population. The data sourcing, extraction, transformation, and cleansing may eat up to 70 percent of total hours made available to a business analytics project.
Big Data vs. Conventional Business Analytics
Conventional analytical tools and techniques are inadequate to handle data that is unstructured (like text data), that is too large in size, or that is growing rapidly like social media data. A cluster analysis on a 200MB file with 1 million customer records is manageable, but the same cluster analysis on 1000GB of Facebook customer profile information will take a considerable amount of time if conventional tools and techniques are used. Facebook as well as entities like Google and Walmart generate data in petabytes every day. Distributed computing methodologies might need to be used in order to carry out such analysis.
Introduction to Big Data
The SAS web site defines big data as follows:
Big data is a popular term used to describe the exponential growth and availability of data, both structured and unstructured. And big data may be as important to business—and society—as the Internet has become. Why? More data may lead to more accurate analyses.
It further states, “More accurate analyses may lead to more confident decision making. And better decisions can mean greater operational efficiencies, cost reductions, and reduced risk.”
This definition refers to big data as a popular term that is used to describe data sets of large volumes that are beyond the limits of commonly used desktop database and analytical applications. Sometimes even server-class databases and analytical applications fail to manage this kind of data set.
Wikipedia describes big data sizes as a constantly moving target, ranging from a few dozen terabytes to some petabytes (as in 2012) in a single data set. The size of big data may vary from one organization to the other, depending on the capabilities of software that are commonly used to process the data set in its domain. For some organizations, only a few hundred gigabytes of data may require reconsideration using their data processing and analysis systems, while some may feel quite at home with even hundreds of terabytes of data.
CONSIDER A FEW EXAMPLES
Cern’s Large Hydron Collider experiments deal with 500 quintillion bytes of data per day, which is 200 times more than all other sources combined in the world.
In Business
eBay.com uses a 40 petabytes Hadoop cluster to support its merchandising, search, and consumer recommendations.
Amazon.com deals with some of the world’s largest Linux databases, which measure up to 24 terabytes.
Walmart’s daily consumer transactions run into 1 million per hour. Its databases sizes are estimated to be 2.5 petabytes.
All this, of course, is extremely large data. It is almost impossible for conventional database and business applications to handle it.
The industry has two more definitions for big data.
- Big data is a collection of data sets so large and complex that it becomes difficult to process using on-hand database management tools or traditional data processing applications.
- Big data is the data whose scale, diversity, and complexity requires new architecture, techniques, algorithms, and analytics to manage it and extract value and hidden knowledge from it.
In simple terms, big data cannot be handled by conventional data-handling tools, and big data analysis cannot be performed using conventional analytical tools. Big data tools that use distributed computing techniques are needed.
Big Data Is Not Just About Size
Gartner defines the three v’s of big data as volume, velocity, and variety. So far, only the volume aspect of big data has been discussed. In this context, the speed with which the data is getting created is also important. Consider the familiar example of the Cern Hydron Collider experiments; it annually generates 150 million petabytes of data, which is about 1.36EB (1EB = 1073741824GB) per day. Per-hour transactions for Walmart are more than 1 million.
The third v is variety. This dimension refers to the type of formats in which the data gets generated. It can be structured, numeric or non-numeric, text, e-mail, customer transactions, audio, and video, to name just a few.
In addition to these three v’s, some like to include veracity while defining big data. Veracity includes the biases, noise, and deviation that is inherent in most big data sets. It is more common to the data generated from social media web sites. The SAS web site also counts on data complexity as one of the factors for defining big data.
Gartner’s definition of the three v’s has almost become an industry standard when it comes to defining big data.
Sources of Big Data
Some of the big data sources have already been discussed in the earlier sections. Advanced science studies in environmental sciences, genomics, microbiology, quantum physics, and so on, are the sources of data sets that may be classified in the category of big data. Scientists are often struck by the sheer volume of data sets they need to analyze for their research work. They need to continuously innovate ways and means to store, process, and analyze such data.
Daily customer transactions with retailers such as Amazon, Walmart, and eBay also generate large volumes of data at amazing rates. This kind of data mainly falls under the category of structured data. Unstructured text data such as product descriptions, book reviews, and so on, is also involved. Healthcare systems also add hundreds of terabytes of data to data centers annually in the form of patient records and case documentations. Global consumer transactions processed daily by credit card companies such as Visa, American Express, and MasterCard may also be classified as sources of big data.
The United States and other governments also are big sources of data generation. They need the power of some of the world’s most powerful supercomputers to meaningfully process the data in reasonable time frames. Research projects in fields such as economics and population studies, conducted by the World Bank, UN, and IMF, also consume large amounts of data.
More recently, social media sites such as Facebook, Twitter, and LinkedIn are presenting some great opportunities in the field of big data analysis. These sites are now among some of the biggest data generation sources in the world. They are mainly the sources of unstructured data. Data forms included here are text data such as customer responses, conversations, messages, and so on. Lots of other data sources such as audio clips, numerous videos, and images are also included. Their databases are hundreds of petabytes. This data, although difficult to analyze, presents immense opportunities to generate useful insights and information such as product promotion, trend and sentiment analysis, brand management, online reputation management for political outfits and individuals, to name a few. Social media analytics is a rapidly growing field, and several startups and established companies are devoting considerable time and energies to this practice. Table 1-1 compares big data to conventional data.
Table 1-1. Big Data vs. Conventional Data
|
Big Data |
Normal or Conventional Data |
|---|---|
|
Huge data sets. |
Data set size in control. |
|
Unstructured data such as text, video, and audio. |
Normally structured data such as numbers and categories, but it can take other forms as well. |
|
Hard-to-perform queries and analysis. |
Relatively easy-to-perform queries and analysis. |
|
Needs a new methodology for analysis. |
Data analysis can be achieved by using conventional methods. |
|
Need tools such as Hadoop, Hive, Hbase, Pig, Sqoop, and so on. |
Tools such as SQL, SAS, R, and Excel alone may be sufficient. |
|
Raw transactional data. |
The aggregated or sampled or filtered data. |
|
Used for reporting, basic analysis, and text mining. Advanced analytics is only in a starting stage in big data. |
Used for reporting, advanced analysis, and predictive modeling . |
|
Big data analysis needs both programming skills (such as Java) and analytical skills to perform analysis. |
Analytical skills are sufficient for conventional data; advanced analysis tools don’t require expert programing skills. |
|
Petabytes/exabytes of data. Millions/billions of accounts. Billions/trillions of transactions. |
Megabytes/gigabytes of data. Thousands/millions of accounts. Millions of transactions. |
|
Generated by big financial institutions, Facebook, Google, Amazon, eBay, Walmart, and so on. |
Generated by small enterprises and small banks. |
Big Data Use Cases
Big Data is a buzzword today. Every organization wants to use it in the decision-making process. Provided next are just a few examples to give you a feel for its application.
Big Data in Retail
This case is centered on an imaginary large retail chain The retail chain decides to use big data to its advantage to predict trends and to prepare for future demands. The work begins several months before the holiday shopping season begins. The need is to predict the thrust segments and determine the hot items for the season. For analysis, the enterprise data is combined with other relevant information such as industry advertising, web browsing patterns, and social media sentiments. Big data analytics makes use of predictive modeling and generates a future demand pattern for various consumer items. Location-wise demand prediction is also done. Delivery channels such as brick-and-mortar shops and online web sites are also determined, and the delivery of various items is done as per the predicted values. Big data price optimization models are used to determine the right price levels. This may vary from one location to the other.
Big data analytics on the customer demand data combined with current price levels, inventories, and competition data helps the retailer to adjust the prices in real time as per demand and other market dynamics. The expected buying pattern predictions are used to pinpoint customers who are likely to buy a hot-pick item this season. When the customer is at the retail store, they can be contacted using text messaging or e-mail and can be presented with a real-time promotional offer that may prompt a buying decision. This promotional offer can be in the form of a discount on the purchase value of a product, a gift card, or, for instance, a $10 discount on future purchases. Finally, the retailer might be interested in knowing what other items can be bundled with the item of interest or what other items the client might be interested in purchasing with this item. The retailers are using big data analytics to do the following:
- Demand forecasting
- Determining the right products for promotion
- Anticipating the right delivery channels for different products
- Determining the right locations and availability of the right products at these locations
- Managing inventory
- Knowing the customer to target
- Deciding upon real-time promotional offers
- Performing real-time pricing that depends upon the most current market dynamics
![]() Note The techniques listed here may be common in big data and conventional analytics. The only difference is the volume of data. For phenomenally large volumes of data, when you apply these analytical techniques, they are sometimes termed big data analytics.
Note The techniques listed here may be common in big data and conventional analytics. The only difference is the volume of data. For phenomenally large volumes of data, when you apply these analytical techniques, they are sometimes termed big data analytics.
Big Data Use Cases in Financial Industry
Consider this interesting case from the banking industry [4]. The case is similar to the retail use case discussed earlier. The bank analyzes data such as customer spending patterns, recent transaction history, credit information, and social media. The recent transaction history indicates that a customer has just bought a new car. Her social media analysis says that she is an adventure lover. The bank can now consider sending a text message to her immediately, while she is still at the automobile shop, extending an offer of free credit of $5,000 for any purchases made in the next 24 hours. Data analysis has already indicated to the bank her income levels, her available credit, and the costs of adventure accessories such as fog lamps. Based on the big data insights, the bank already knows the financial risk factors involved in making this offer. If that is not enough, the bank may also make an offer of 10 percent cash back on a lunch in the Chinese restaurant of her choice in the nearby locality, based on her food and restaurant choices in her social media interactions. Is this not delightful for the customer and a new revenue stream for the bank?
Consider one more simple case of detecting credit card fraud transactions immediately in collaboration with one’s mobile phone operator [5]. The operator is always informed about the client’s approximate current location, and if that data shows that a client is somewhere in the United States and his credit card registers a transaction somewhere in the United Kingdom, it indicates a high possibility of fraudulent transaction. Given that both the credit card company and the mobile phone operator have millions of customers and the number of real-time transactions may be even higher, this case may be classified under big data analytics.
Introduction to Data Analysis Tools
This section will discuss some of the more commonly used business analytics tools that are used in the industry today. It is not enough for a data analyst to learn about just one tool. They need to apply different tools as per the situation or what the problem at hand demands. A general knowledge of the strengths and weaknesses of the tools will definitely add value to a data analytics career.
This section will discuss the features of and give resources for further information for three industry-leading tools: SAS, R, and SPSS.
Business analytics aims to model the data in order to discover useful information or business insights and to support decision making. It requires various operations on the data, such as reviewing, cleansing, transforming and modeling, validations, and interpretations to gain useful business insights. Sometimes the sets of data may have a million records or more. Handling and operating such complex data requires automated analysis tools. Fortunately, many such good tools are available today. A simple Google search for data analysis tools will give you a list of a number of such tools. Many of them are open source and free for use. SAS, SPSS, and R are the most widely used software packages today, at least for business analytics applications. R is the most popular and widely used statistical analysis package in the open source category, and SAS and SPSS are the two most widely used data analysis packages that are commercially available.
The SAS tool has been around since the 1970s. There are so many legacies built using this tool that most of the companies in the corporate world that are into business analytics at any level continue to use SAS. R was introduced in 1996. Over the years, a lot of new capabilities and features have been built around R. It is one of the most powerful open source data analysis tools available today. This makes it popular in the research and academic community. Many companies from the corporate world have also started using R. SPSS has also existed for more than 20 years now. It has a strong user base in the social sciences and many other communities.
Commonly Used Data Analysis Software
In the following sections, we talk about some commonly used data analysis software and how to make a choice. SAS, SPSS, and R may be termed as the most commonly used software in the industry.
SAS
SPSS
R
MATLAB
RapidMiner
- Good GUI-based tool for segmentation and clustering; can also be used for conventional modeling
- Open source
Weka
SAP
- Tool for managing business operations and customer relations
- Most widely used operations tracking tool
Minitab
Apache Mahout
Other Tools
- Statistica
- KXEN Modeler
- GNU Octave
- Knime
Choosing a Tool
The final choice of data analysis tool to be used depends upon many considerations.
- The business application, its complexity, and the level of expertise available in the organization.
- The long-term business, information, and analytics strategy of the organization.
- Existing organizational processes.
- Budgetary constraints.
- The investments proposed or already done in the processing hardware systems, which in turn might decide on factors such as processing power and memory available for the software to run.
- Overall organization structure and where the analytics work is being carried out.
- Project environment and governance structure.
- Comfort level of the company in using open source software and warranties and other legal considerations.
- The size of data to be handled.
- The sophistication of graphics and presentation required in the project.
- What analytics techniques to be used and how frequently they will be used.
- How the current data is organized and how comfortable the team is in handling data.
- Whether a data warehouse is in place and how adequately it covers business and customer information that may be required for the analysis.
- Legacy considerations. Is any other similar tool in use already? If yes, how much time and resources are required for any planned switch-over?
- Return-on-investment expectations.
Many more considerations specific to an organization or a project can be added to this list. The order of importance of these considerations may vary from person to person, from project to project, and from one organization to another. The final decision, however, is not an easy one. The later sections of this chapter will list a few comparative features of SAS, SPSS, and R, which might help the decision-making process on the choice of tool that will best suit your needs. Finally, instead of zeroing in on a single tool, deciding to use multiple tools for different business analytics needs is also possible.
In some cases, it might be concluded that a simple spreadsheet application tool, such as Microsoft Excel, is the most convenient and effective and yet gives sufficient insights required to solve the business problem in hand.
Sometimes a single analytics project might require the use of more than one tool. A data analyst will be expected to apply different software tools depending on the problem at hand.
Main Parts of SAS, SPSS, and R
SAS and SPSS have hundreds of functions and procedures and can be broadly divided into five parts.
- Data management and input functions, which help to read, transform, and organize the data prior to the analysis
- Data analysis procedures, which help in the actual statistical analysis
- SAS’s output delivery system (ODS) and SPSS’s output management system (OMS), which help to extract the output data for final representation or to be used by another procedures as inputs
- Macro languages, which can be used to give sets of commands repeatedly and to conduct programming-related tasks
- Matrix languages (SAS IML and SPSS Matrix), which can be used to add new algorithms
R has all these five areas integrated into one. Most of the R procedures are written using the R language, while SAS and SPSS do not use their native languages to write their procedures. Being open source, R’s procedures are available for the users to see and edit to their own advantage.
SAS
As per the SAS web site, the SAS suite of business analytics software has 35+ years of experience and 60,000+ customer sites worldwide. It has the largest market share globally with regard to advanced analytics. It can do practically everything related to advanced analytics, business intelligence, data management, and predictive analytics. It is therefore not strange that the entire book is dedicated to explaining the applications of SAS in advanced business analytics.
SAS development originally started at North Carolina State University, where it was developed from 1966 to 1976. The SAS Institute, founded in 1976, owns this software worldwide. Since 1976, new modules and functionalities have been being added in the core software. The social media analytics module was added in 2010.
The SAS software is overall huge and has more than 200 components. Some of the interesting components are the following:
- Base SAS: Basic procedures and data management
- SAS/STAT: Statistical analysis
- SAS/GRAPH: Graphics and presentation
- SAS/ETS: Econometrics and Time Series Analysis
- SAS/IML: Interactive matrix language
- SAS/INSIGHT: Data mining
- Enterprise Miner: Data mining
Analysis Using SAS: The Basic Elements
This section will concentrate on Base SAS procedures. Base SAS helps to read, extract, transform, manage, and do statistical analysis on almost all forms of data. This data can be from a variety of sources such as Excel, flat files, relational databases, and the Internet. SAS provides a point-and-click graphical user interface to perform statistical analysis of data. This option is easy to use and may be useful to nontechnical users or as a means to do a quick analysis. SAS also provides its own programming language, called the SAS programming language. This option provides everything that the GUI has, in addition to several advanced operations and analysis. Many professional SAS users prefer using only the programming option because it gives almost unlimited control to the user on data manipulation, analysis, and presentation.
Most SAS programs have a DATA step and a PROC step. The DATA step is used for retrieval and manipulation of data, while the PROC step contains code for data analysis and reporting. There are approximately 300 PROC procedures. SAS also provides a macro language that can be used to perform routine programming tasks, including repetitive calls to SAS procedures. In the earlier system, SAS provided an ODS, and by using it, SAS data could be published in many commonly used file formats such as Excel, PDF, and HTML. Many of the SAS procedures have the advantage of long history, a wide user base, and excellent documentation.
The Main Advantage Offered by SAS
The SAS programming language is a high-level procedural programming language that offers a plethora of built-in statistical and mathematical functions. It also offers both linear and nonlinear graphics capabilities with advanced reporting features. It is possible to manipulate and conveniently handle the data using SAS programming language, prior to applying statistical techniques. The data manipulation capabilities offered by SAS become even more important because up to three-fourths of the time spent in most analytics project is on data extraction, transformation, and cleaning. This capability is nonexistent in some other popular data analysis packages, which may require data to be manipulated or transformed using several other programs before it can be submitted to the actual statistical analysis procedures. Some statistical techniques such as analysis of variance (ANOVA) procedures are especially strong in the SAS environment.
Listing 1-1 and Listing 1-2 are samples of SAS code. They are just to give you a feel of how SAS code generally looks. More detailed treatments of writing SAS code will be covered later in this book.
Listing 1-1. Regression SAS Code
Proc reg data=sales;
Model bill_amount=income  Average_spending  family_members Age;
Run;
Listing 1-2. Cluster Analysis Code
Proc fastclus  data= sup_market radius=0 replace=full maxclusters = 5 ;
id cust_id;
Var visitsincome age spends;
run;
The R Tool
Discussed in the earlier sections, R is an integrated tool for data manipulation, data management, data analysis, and graphics and reporting capabilities. It can do all of the following in an integrated environment:
- Data management functions such as extraction, handling, manipulation and transformation, storage
- The full function and object-oriented R programming language
- Statistical analysis procedures
- Graphics and advanced reporting capabilities
R is open source software maintained by the R Development Core Team and a vast R community (www.r-project.org). It is supported by a large number of packages, which makes it feature rich for the analytics community. About 25 statistical packages are supplied with the core R software as standard and recommended packages. Many more are made available from the CRAN web site at http://CRAN.R-project.org and from other sources. The CRAN site at http://cran.r-project.org/doc/manuals/R-intro.html#Top offers a good resource for an R introduction, including documentation resources.
R’s extensibility is one of its biggest advantages. Thousands of packages are available as extensions to the core R software. Developers can see the code behind R procedures and modify it to write their own packages. Most popular programming languages such as C++, Java, and Python can be connected to the R environment. SPSS has a link to R for users who are primarily using the SPSS environment for data analysis. SAS also offers some means to move the data and graphics between the two packages. Table 1-2 lists the most widely used R packages (see http://piccolboni.info/2012/05/essential-r-packages.html).
Table 1-2. Most Widely Used R Packages
|
Rank |
Package |
Description |
|---|---|---|
|
1 |
Stats |
Distributions and other basic statistical stuff |
|
2 |
Methods |
Object-oriented programming |
|
3 |
graphics |
Of course, graphics |
|
4 |
MASS |
Supporting material for Modern Applied Statistics with S |
|
5 |
grDevices |
Graphical devices |
|
6 |
utils |
In a snub to modularity, a little bit of everything, but very useful |
|
7 |
lattice |
Graphics |
|
8 |
grid |
More graphics |
|
9 |
Matrix |
Matrices |
|
10 |
mvtnorm |
Multivariate normal and t distributions |
|
11 |
sp |
Spatial data |
|
12 |
tcltk |
GUI development |
|
13 |
splines |
Needless to say, splines |
|
14 |
nlme |
Mixed-effects models |
|
15 |
survival |
Survival analysis |
|
16 |
cluster |
Clustering |
|
17 |
R.methodsS3 |
Object-oriented programming |
|
18 |
coda |
MCMC |
|
19 |
igraph |
Graphs (the combinatorial objects) |
|
20 |
akima |
Interpolation of irregularly spaced data |
|
21 |
rgl |
3D graphics (openGL) |
|
22 |
rJava |
Interface with Java |
|
23 |
RColorBrewer |
Palette generations |
|
24 |
ape |
Phylogenetics |
|
25 |
gtools |
Functions that didn’t fit anywhere else, including macros |
|
26 |
nnet |
Neural networks |
|
27 |
quadprog |
Quadratic programming |
|
28 |
boot |
Bootstrap |
|
29 |
Hmisc |
Yet another miscellaneous package |
|
30 |
car |
Companion to the Applied Regression book |
|
31 |
lme4 |
Linear mixed-effects models |
|
32 |
foreign |
Data compatibility |
|
33 |
Rcpp |
R C++ integration |
Here are a few R code snippets. It is not necessary to understand them at this stage. The next three chapters are devoted to SAS programming.
Input_data=read.csv("Datasets/Insurance_data.csv")
#reads an external CSV file

input_data_final=Input_data[,-c(1)]
#stores the variables of the dataset separately

input_data_final=scale(input_data_final)
#normalizes the data

clusters_five<-kmeans(input_data_final,5)
#creates 5 clusters from the given data

cluser_summary_mean_five=aggregate(input_data_final,by=list(clusters_five$cluster),FUN=mean)
#summarizes clusters by mean

View(cluser_summary_count_five)
#returns the results summarized by size
IBM SPSS Analytics Tool
SPSS originally stood for Statistical Package for the Social Sciences. It is a software package used for statistical analysis, originally developed by SPSS Inc. It was acquired by IBM in 2009, and IBM renamed it as SPSS Statistics, with a latest version of SPSS Statistics 22.
Many SPSS users think it has a stronger command menu option compared to R and SAS; its learning curve is also shorter.
The web site at http://fmwww.bc.edu/GStat/docs/StataVSPSS.html has the following opinion about SPSS:
SPSS has its roots in the social sciences and the analysis of questionnaires and surveys is where many of its core strengths lie.
SPSS has been in existence for a long time and hence has a strong user base. Like with any other software, you always have to do a cost-to-benefit analysis while making a buying decision.
Users may find SAS and SPSS similar to each other, and switching from one to the other may be fairly easy. R may look somewhat different for first-time users.
Features of SPSS Statistics 22
SPSS Statistics 22 is built on the philosophy of data-driven decision making anytime, anywhere. It has many new features, such as interaction with mobile devices. It works on Windows, Mac, and Linux desktops. For mobile devices, it supports Apple, Windows 8, and Android devices. It has support for Automatic Linear Modeling (ALM) and heat maps. It enhances the Monte Carlo simulation to help in improving the accuracy of predictive models for uncertain inputs. SPSS Statistics Server is good as far as scalability and performance is concerned. Custom programming is also made easier than before. Python plug-ins can be added as a part of the main installation.
Monte Carlo simulation is a problem-solving technique that is used for approximating certain results by doing multiple trials or simulations that use random variables.
Selection of Analytics Tools
The web site at http://stanfordphd.com/Statistical_Software.html contains a statistical feature comparison for R, Minitab, SAS, STATA, and SPSS. R looks feature-rich given its supporting packages, which are written by the R core development team and many other R enthusiasts. SAS has been around since the 1970s and has a large user base. It has great data management capabilities, which make it a one-stop shop for most of the analytics exercises. The user does not need to go to any other program whether for reading the data files or for the final presentation.
SPSS has great menu-driven features and does not need any training in programming in most cases. The SAS market share and its wide appeal make it the main topic of this book. Several companies in the corporate world find themselves comfortable with SAS, mainly because of the large legacy built around it over the years, its industrial quality code, its good quality of documentation, and the skill availability in the market.
As discussed in this chapter, the fact that all available applications have their own strengths and weaknesses needs to be accepted. No software is fit for all occasions. A data analyst must learn multiple software products and use them as the situation demands to be successful.
The Background Required for a Successful Career in Business Analytics
In this section, we’ll talk about what is required if you want to be a data scientist. The main requirement is a love of numbers. A mathematics background at the graduate level usually helps. A good statistics or quantitative techniques course at the graduate level may also be a good start. Candidates with a degree in statistics usually find business analytics to be a natural career choice. An experience working with basic computer programming, databases, and SQL will serve as a solid foundation. You can also start with business intelligence or reporting job and gradually migrate into full-fledged analytics. Knowledge of spreadsheet packages, such as Microsoft Excel, and basic databases, such as Microsoft Access, usually help. Some formal courses in advanced statistics help. With the advent of big data, frameworks such as Hadoop are also gaining importance.
Skills Required for a Business Analytics Professional
The following are the skills required to be successful in the field of business analytics. As you rise in your company’s hierarchy, the soft skills take prominence over hardcore technical skills. (See www.villanovau.com/business-analyst-skills for more information.)
Communication Skills
A business analyst needs to interact with users, senior management, technical staff, and clients in order to understand project requirements, business objectives, methodologies to be followed, testing, and other project-related activities. They need to thoroughly understand the business and the underlying problems to be solved. The analysis results are often presented to senior management and other project stakeholders using sophisticated Microsoft PowerPoint presentations and other reporting tools. A high level of verbal and written language skills is necessary to succeed in this career.
Technical Skills
Data analyst use sophisticated statistical packages, reporting tools, presentation, and testing software as part of their day-to-day work life. Mastering a single tool or software is usually not enough; a combination of software may be required depending upon the nature of the problem. Sometimes a plain programming language such as C is used to do the complex operations on the data, prior to building the final model. Multiple databases may be involved in the project, and the analyst may need to extract and process the data from these multiple databases. A variety of reporting and presentation tools may be used to effectively present the project results. Hence, a strong technical aptitude and IT skills are required to succeed.
Analytical Skills
The job here is to analyze large and complex data sets, business documents, surveys, business, and operational requirements. A business analyst needs to develop a high level of understanding of the business, the problem to be solved, analysis methodologies, and presentation requirements. Analysts may need to suggest the prescriptive measures to correct a business problem. Strong analytical aptitude is vital to success in this job.
Problem-Solving Skills
It may be easy to conclude how important the problem-solving skills are for a business analyst, based on the chapter so far. During the course of the project, and even otherwise, an analyst faces a variety of challenges almost every day.
Decision-Making Skills
Business analysts need to take inputs from various sources and stakeholders on complex business matters and then use sound judgment to decide the right course of action. An analyst may need to advise management, developers, and clients on the business, and some of those decisions may have a long-lasting effect on the business, affecting billions of dollars of business. An ability to make right decisions based on correct inputs and methodologies thus is an important skill for a business analyst.
Managerial Skills
Analytics problem solving is often done in the form of projects. An analyst needs to manage the project and direct the staff members in day-to-day activities. All the projects need to be managed within the constraints of time, cost, and quality. It takes high degrees of project management and managerial skills. It involves being skilled in negotiation and persuasion as well.
Conclusion
In this chapter we were introduced to analytics and applications of business analytics. We also discussed the most widely used analytical tools. In future chapters we will get into SAS programming and analytical concepts. Upcoming chapters will have more hands-on exercises and case studies.